 How Sustainable Is China’s Recovery?
(Yicai Global) Aug. 19 -- At 3.2 percent, GDP growth in the second quarter this year was rather strong, surprising both analysts and policymakers. Indeed, even China’s Politburo noted that the economy’s performance was clearly better than expected (明显好于预期).
With last week’s release of the July economic data, an atmosphere of disappointment has emerged, as many of the indicators did not grow as rapidly as expected. In particular, there is a sense that the recovery is unbalanced, with the growth of supply exceeding that of demand, and a fear that inventories will rise, causing the economy to stall.
However, a careful look at the data reveals that the recovery may not be as unbalanced as it might appear and that there are, indeed, quite a few bright spots.
Let’s begin with consumption. Here the market focused on the retail sales data, which were down by 1 percent year-over-year in July. Much of the weakness in retail sales came from catering services (down 11 percent), as diners continue to stay away from restaurants out of health concerns. Another area of weakness was sales of petroleum products (-14 percent). However, this seems more related to the drop in the retail price of gasoline (-16 percent) than an indication of weak demand.
On the bright side, unit passenger car sales were up 9 percent in July, following moderate growth in May and June. This is an encouraging sign, as consumers have to be fairly confident in order to spend on a big-ticket durable like a car.
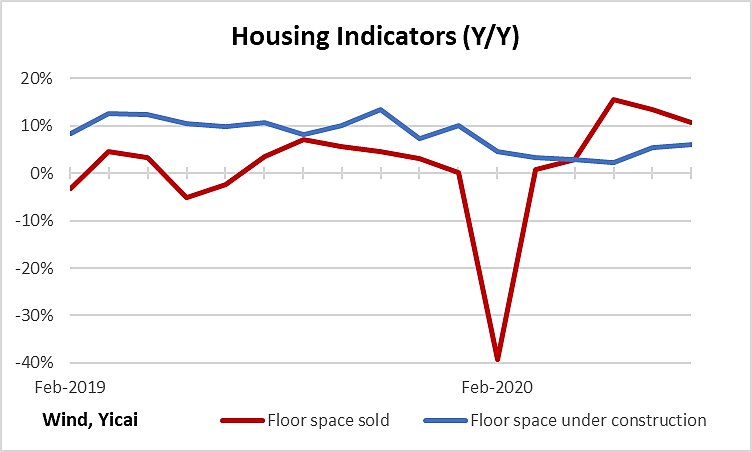
This confidence appears to also be reflected in the housing market. Figure 1 shows that sales of apartments (the red line) have been very strong in the last three months, growing 13 percent on average. This compares to only 2 percent, on average, in 2019. The willingness of households to purchase housing, at this point in time, indicates that they are not particularly worried about their economic circumstances.
The demand for housing is provoking an increase in supply, as floor space under construction (the blue line) is rebounding from its May trough. Increased residential construction is one of the reasons why the production of China’s iron and steel has rebounded so sharply.
Figure 1
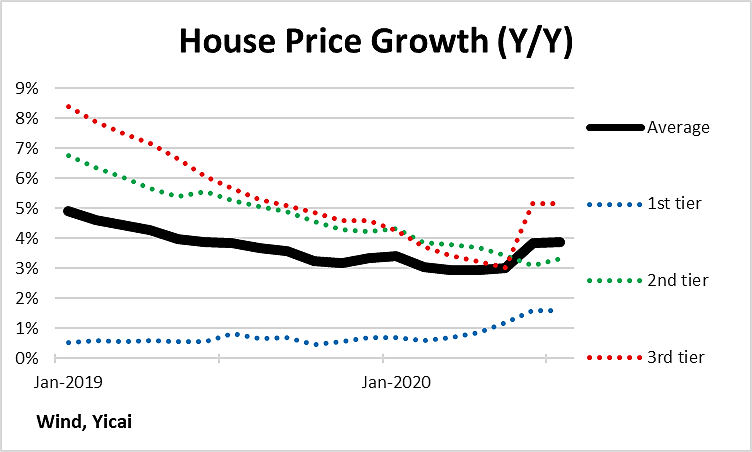
As long as home price increases remain moderate, the authorities are likely to allow housing to support the recovery. Figure 2 shows that price growth accelerated in June and July, especially in third-tier cities. However, the rate of increase, about 4 percent nationally, is comparable to what we saw mid-last year, so construction activity should continue to remain robust in the second half of the year.
Figure 2
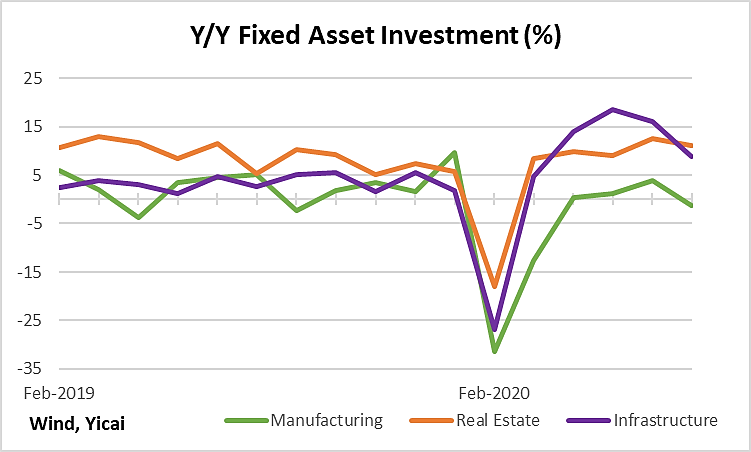
Turning to the supply side, there is little evidence of a looming surfeit of goods. Fixed asset investment (FAI) did rebound sharply in April and has remained strong. However, investment in manufacturing remains quite sluggish (the green line in Figure 3), suggesting that entrepreneurs remain cautious about adding new capacity.
In recent months, much of the strength in FAI has come from infrastructure investment. While other countries use fiscal policy to subsidize incomes and support consumption, the Chinese authorities use infrastructure investment as a demand management tool. It serves to support employment while providing the basic services that the economy will need over time. Of the various types of infrastructure investment, the provision of power, natural gas and water has been the most important so far this year.
Figure 3
Despite the weakness in its trading partners’ economies, China’s exports were up 7 percent year-over-year in July. Sales to the US and the ASEAN countries grew by 13 and 14 percent respectively. China’s exports of computers (+36 percent) and cell phones (+43 percent) were particularly strong. As countries in the rest of the world recover from the effect of the virus, China benefits from being the producer most able to provide the goods they need.
China’s imports remained sluggish, but this does not appear to reflect a problem with domestic demand. Low commodity prices played a role in depressing import growth. As a major commodity importer, Chinese incomes benefit from lower commodity prices. Consider the drivers noted above who have extra cash left in their pockets, after paying less at the pumps for gasoline. There is also evidence that domestic Chinese firms are increasingly replacing foreign ones as suppliers of key inputs used to produce export goods. This is likely because supply chains outside of China have not yet fully recovered.
Robust exports and sluggish imports combined to produce a large trade surplus in July, which was just a touch lower than the all-time high recorded in May. To the extent that China can press its advantage as the country to have recovered from the virus first, its firms can gain market share both at home and abroad and support the recovery.
Figure 4
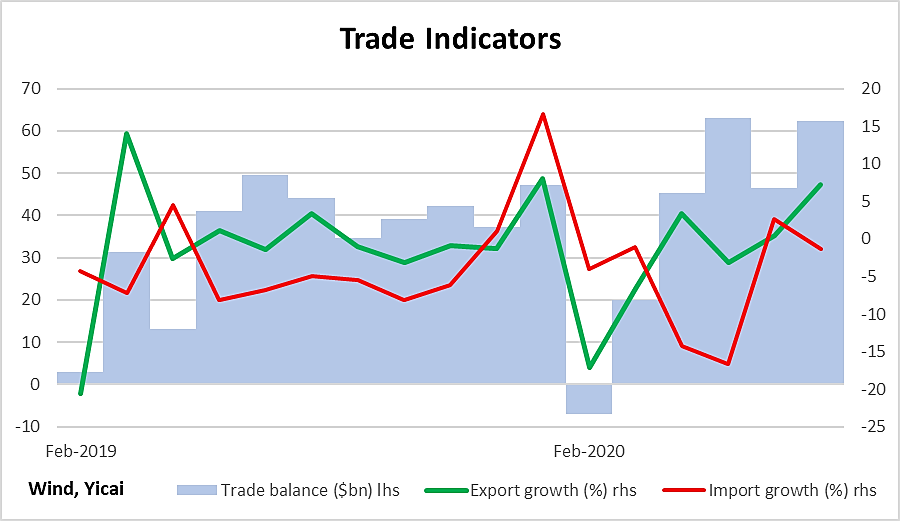
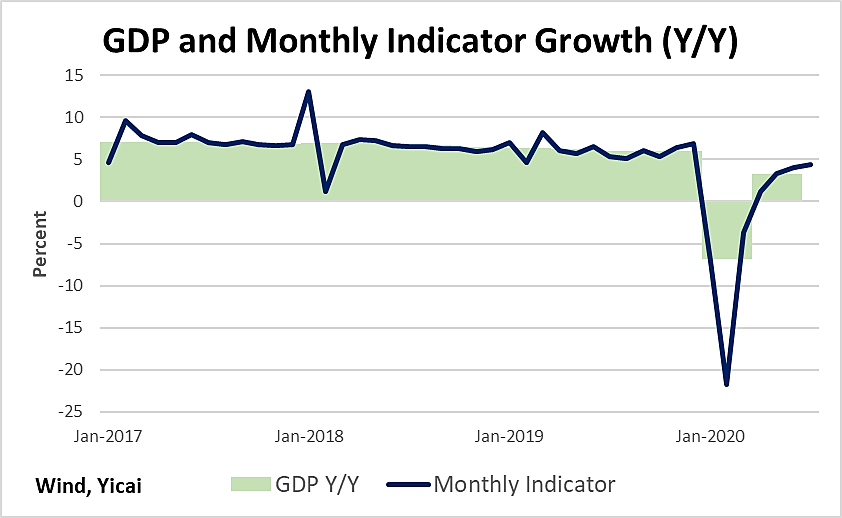
Figure 5 attempts to summarize July’s economic information. The Monthly Economic Indicator it presents is simply a weighted average of the Industrial Value Added and Service Production Index series published by China’s National Bureau of Statistics. It suggests that the economy grew at 4.4 percent in July, which represents a significant acceleration from growth in the second quarter.
Figure 5 shows that the Monthly Economic Indicator appears to be losing momentum. However, it is natural that the economy should decelerate as it approaches its potential rate of growth. Chinese fiscal and monetary support has been prudent and is unlikely to push the economy into excess demand.
Uncertainty remains particularly high in the second half of the year, which makes forecasting even more difficult than usual. Nevertheless, it is reasonable to expect that the Chinese economy will return to potential growth. Whether the market is pleasantly surprised or let down will depend on how its expectations evolve.
Figure 5
