
China Securities Intelligent Financial News Kangtuo Medical (688314) disclosed its 2024 annual report on March 28. In 2024, the company will achieve a total operating income of 322 million yuan, a year-on-year increase of 17.06%; the net profit attributable to the parent company was 88.3991 million yuan, a year-on-year increase of 17.07%; deducted non-net profit of 74.8609 million yuan, a year-on-year increase of 9.52%; the net cash flow from operating activities was 140 million yuan, a year-on-year increase of 64.57%; During the reporting period, Kangtuo Medical's basic earnings per share was 1.09 yuan, and the weighted average return on equity was 14.37%. The company's 2024 annual distribution plan is: it intends to distribute 1.8 yuan (tax included) to all shareholders for every 10 shares.

Based on the closing price on March 27, Kangtu Medical's current price-to-earnings ratio (TTM) is about 25.78 times, the price-to-book ratio (LF) is about 3.59 times, and the price-to-sales ratio (TTM) is about 7.08 times.


According to the data, the company's main products are PEEK bone plates, additive manufacturing of polyetheretherketone skull defect repair prostheses, PEEK link sheets, titanium mesh plates, titanium link sheets, titanium screws, bone plugs/bone mesh/bone plug strips, disposable brain drainage devices, eagle claw sternal fixators, PEEK sternal fixation belts, rib bone plates, polyetheretherketone maxillofacial implants, titanium and titanium alloy artificial dental implants, implant tools, etc.


According to the data, the company's weighted average return on equity in 2024 will be 14.37%, an increase of 0.91 percentage points from the same period last year. The company's return on invested capital in 2024 will be 13.02%, an increase of 1.11 percentage points from the same period last year.


As of 2024, the company's net cash flow from operating activities will be 140 million yuan, a year-on-year increase of 64.57%; The net cash flow from financing activities was -45.9462 million yuan, a year-on-year decrease of 14.1513 million yuan, and the net cash flow from investment activities was -91.3553 million yuan, compared with -28.0377 million yuan in the same period last year.


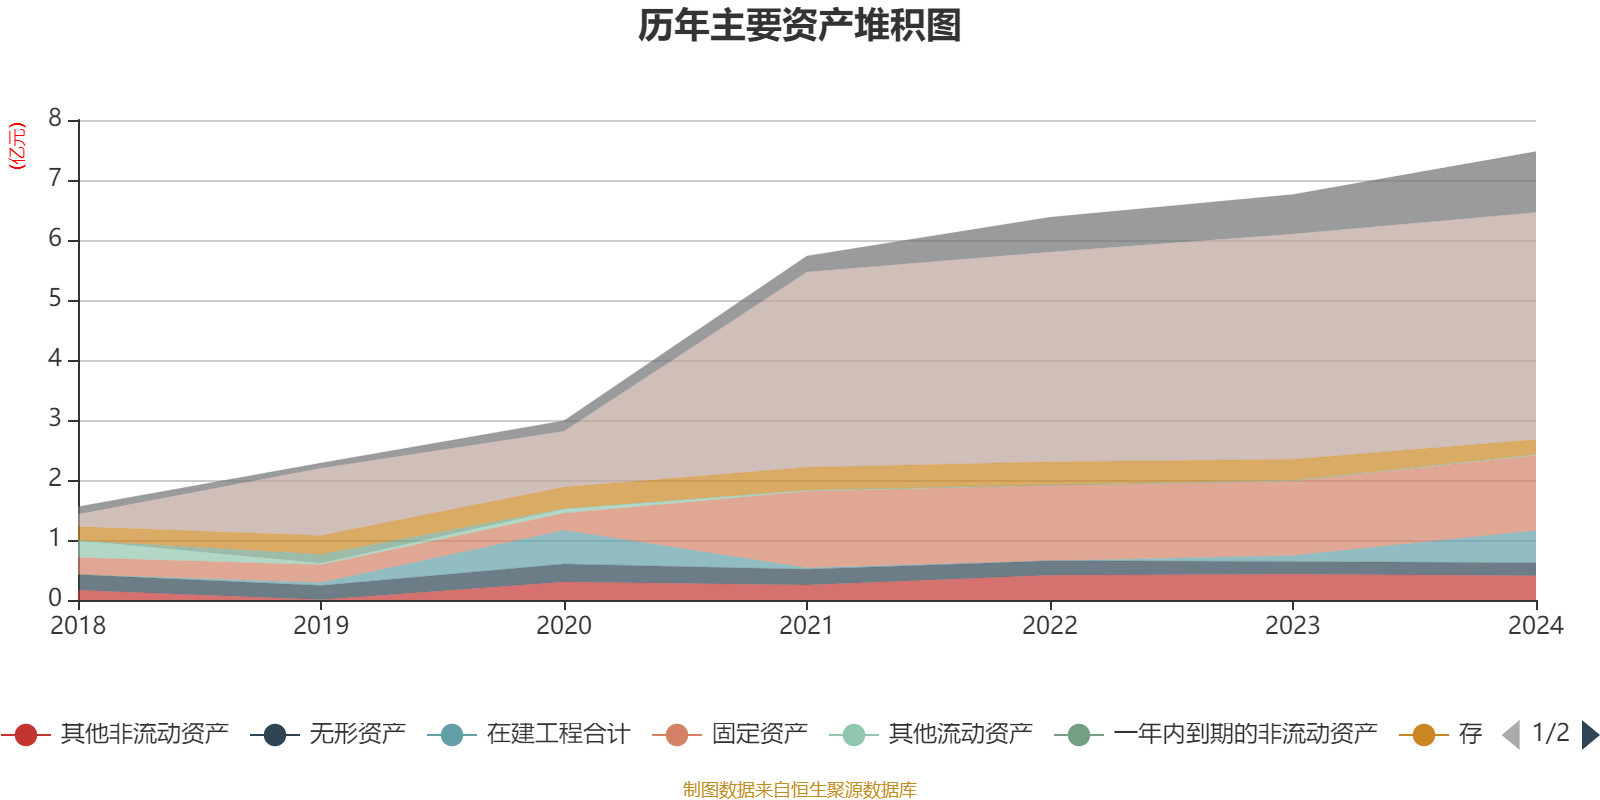
In terms of major changes in assets, as of the end of 2024, the total number of projects under construction of the company increased by 440.92% from the end of the previous year, accounting for 5.74 percentage points of the company's total assets, monetary funds increased by 0.91% from the end of the previous year, accounting for 4.85 percentage points of the company's total assets, and other non-current financial assets accounted for 2.68% of the company's total assets, compared with 0 at the end of the previous year. Inventory decreased by 30.03% from the end of the previous year, accounting for 1.92 percentage points of the company's total assets.
In terms of major changes in liabilities, as of the end of 2024, the company's notes payable and accounts payable increased by 53.44% from the end of the previous year, accounting for 0.97 percentage points of the company's total assets, leasing liabilities increased by 585.36% from the end of the previous year, accounting for 0.79 percentage points of the company's total assets, employee compensation payable increased by 37.3% from the end of the previous year, accounting for 0.34 percentage points of the company's total assets, and contract liabilities increased by 125.78% from the end of the previous year. The proportion of the company's total assets increased by 0.3 percentage points.

From the perspective of inventory changes, as of the end of 2024, the book value of the company's inventory was 24.7506 million yuan, accounting for 3.89% of net assets, a decrease of 10.6209 million yuan from the end of the previous year. Among them, the provision for inventory decline was 21.5237 million yuan, and the provision ratio was 46.51%.


In 2024, the company's R&D investment will be 29.5758 million yuan, a year-on-year increase of 67.69%; R&D investment accounted for 9.19% of operating income, an increase of 2.78 percentage points over the same period last year. In addition, the capitalization rate of the company's R&D investment for the year was 19.18%.


In 2024, the company has a current ratio of 4.45 and a quick ratio of 4.19.


According to the annual report, among the top ten circulating shareholders of the company at the end of 2024, the new shareholders are Fuguo Xingyuan Preferred 12-month Holding Period Hybrid Securities Investment Fund and Fuguo Culture, Sports and Health Equity Securities Investment Fund, replacing Shanghai Hongxi Investment Development Center (Limited Partnership) and Li Yan at the end of the third quarter. In terms of specific shareholding ratio, Liu Wenlei's shareholding has increased.
| shareholder name | number of shares outstanding(10,000 shares). | to total share capital (%) | change ratio (percentage points): |
|---|---|---|---|
| Hu Liren | 3954.58 | 48.6782 | unchanged |
| Zhu Hailong | 768.6 | 9.4609 | unchanged |
| Xi'an Heying Enterprise Management Consulting Partnership (Limited Partnership) | 380.8 | 4.6873 | unchanged |
| Fuguo Xingyuan preferred 12-month holding period hybrid securities investment fund | 161.44 | 1.9871 | New |
| Hu Ligong | 130.76 | 1.6095 | Unchanged |
| Fuguo Culture, Sports and Health Equity Securities Investment Fund | 107.85 | 1.3275 | New Entrant |
| Wang He | : 84.5 | 1.0401 | |
| Zhao Ruoyu | , 82.6 | ,1.0167 | ,|
| Liu Wenlei | , 69.26 | ,0.8525 | 0.146 |
| Wu Dong | 62.6 | 0.7705 | unchanged |

Proofreading: Sun Ping
Indicator Annotation:
P/E ratio = total market capitalization / net profit. When the company loses money, the P/E ratio is negative, and it is not practical to use the P/E ratio for valuation, and the P/B ratio or P/B ratio is often used as a reference.
Price-to-book ratio = total market capitalization / net assets. The price-to-book ratio valuation method is mostly used for companies with large fluctuations in earnings and relatively stable net assets.
Price-to-sales ratio = total market capitalization / operating income. The price-to-sales ratio method is often used for growing companies that are losing money or making small profits.
The price-to-earnings ratio and price-to-sales ratio in this article are calculated using the TTM method, that is, the data for the 12 months up to the latest financial report (including forecast). The price-to-book ratio is calculated using the LF method, that is, based on the latest financial report data. The quantile calculation range of the three is from the company's listing to the latest announcement date.
When the P/E ratio and price-to-book ratio are negative, the current quantile is not displayed, which will cause the line chart to be interrupted.
Ticker Name
Percentage Change
Inclusion Date


