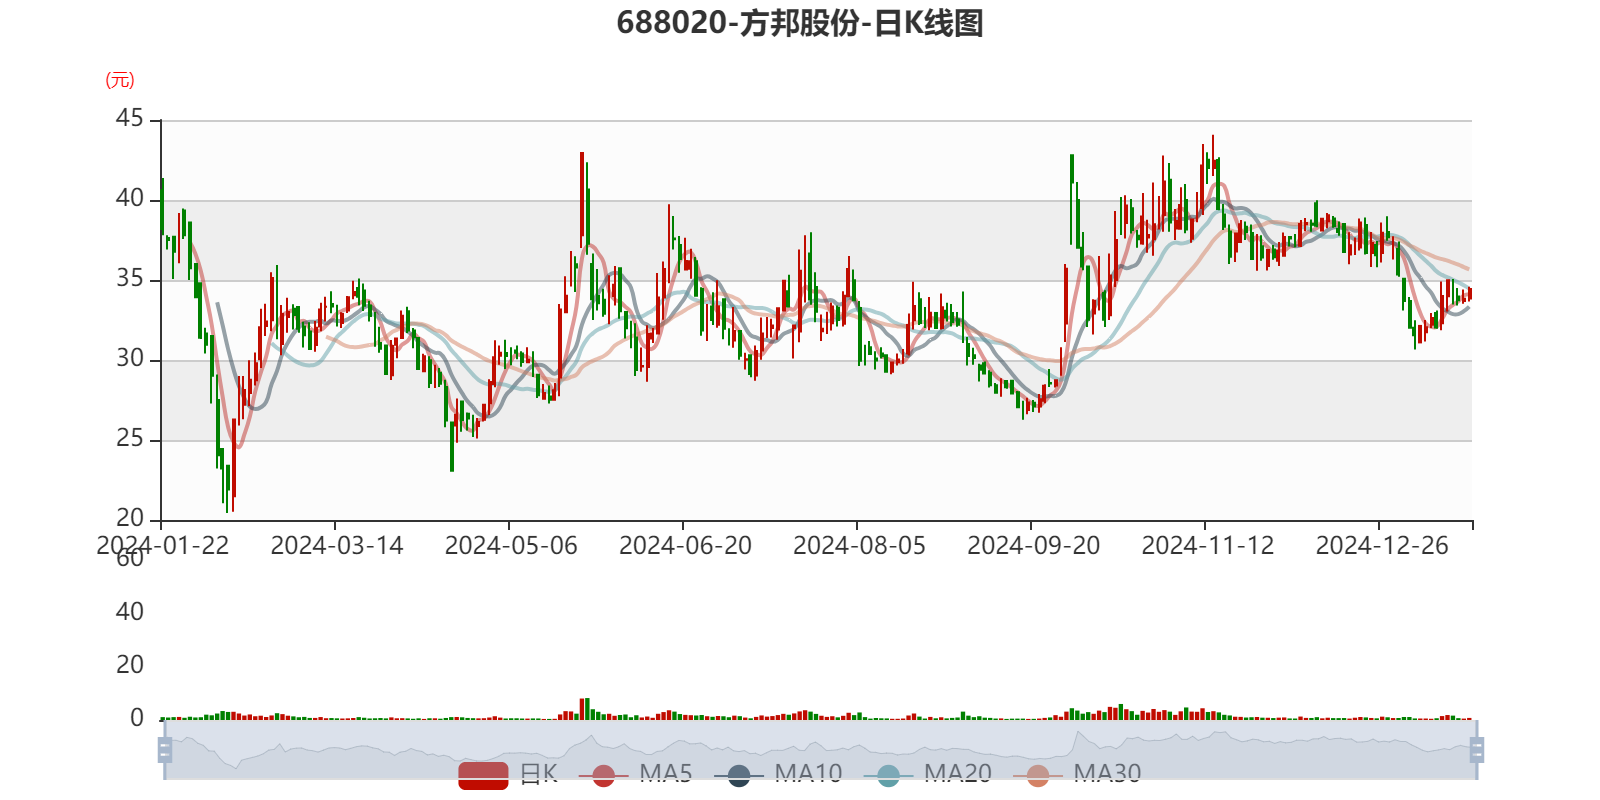
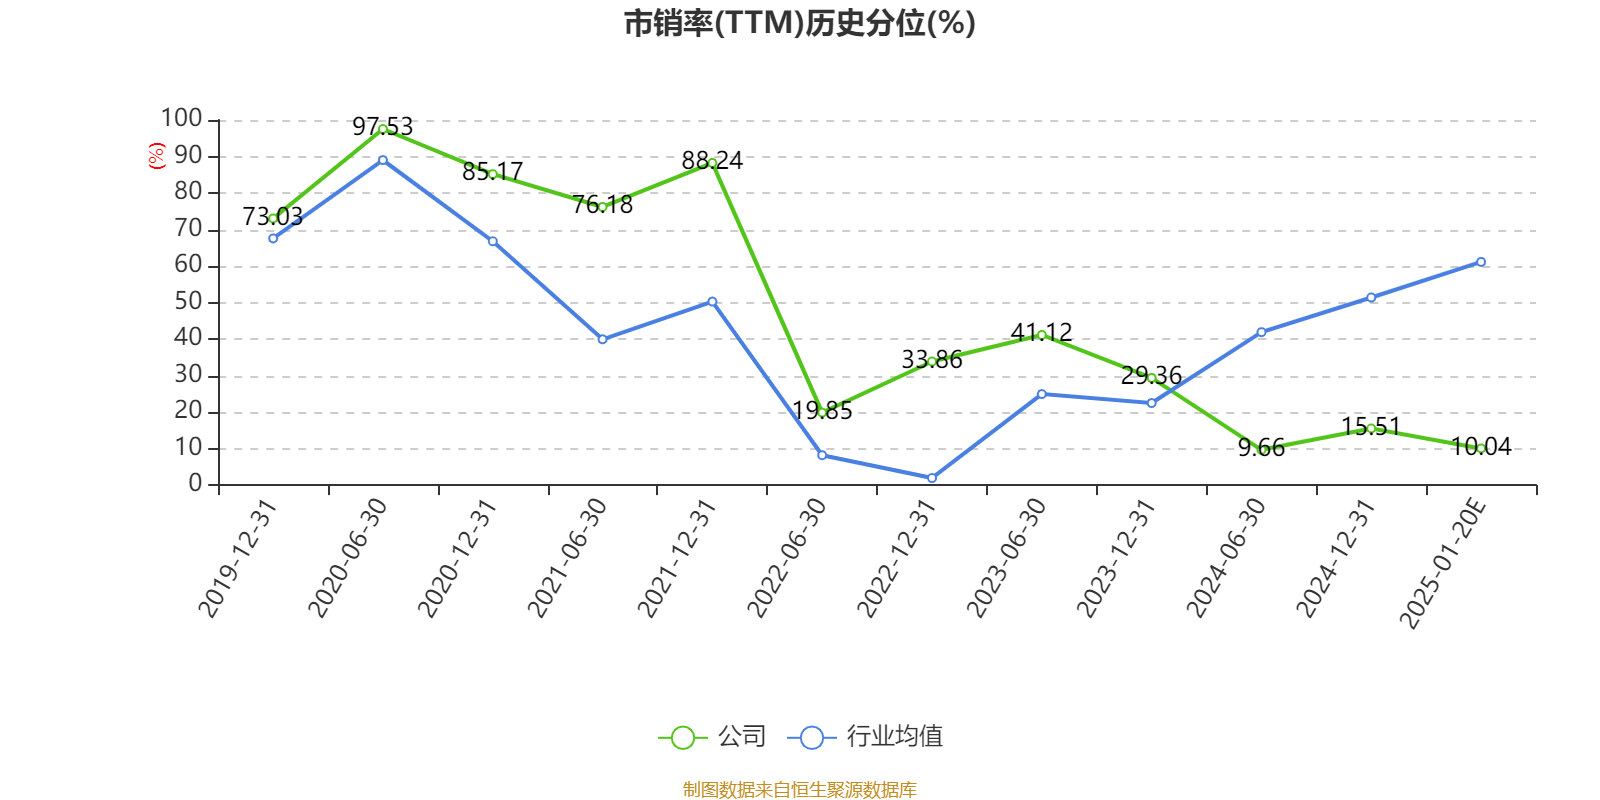
China Securities Intelligent Financial News Fangbang Co., Ltd. (688020) disclosed the 2024 annual performance forecast on the evening of January 20, and is expected to achieve operating income of 344 million yuan in 2024, a net profit loss of 57 million yuan to 90 million yuan attributable to the parent company, a loss of 68.6701 million yuan in the same period last year, and a non-net profit loss of 73 million yuan to 110 million yuan, a loss of 85.8515 million yuan in the same period last year. Based on the closing price on January 20, Fangbang shares currently have a price-to-earnings ratio (TTM) of about -30.86 times to -48.73 times, a price-to-book ratio (LF) of about 1.95 times, and a price-to-sales ratio (TTM) of about 8.07 times.
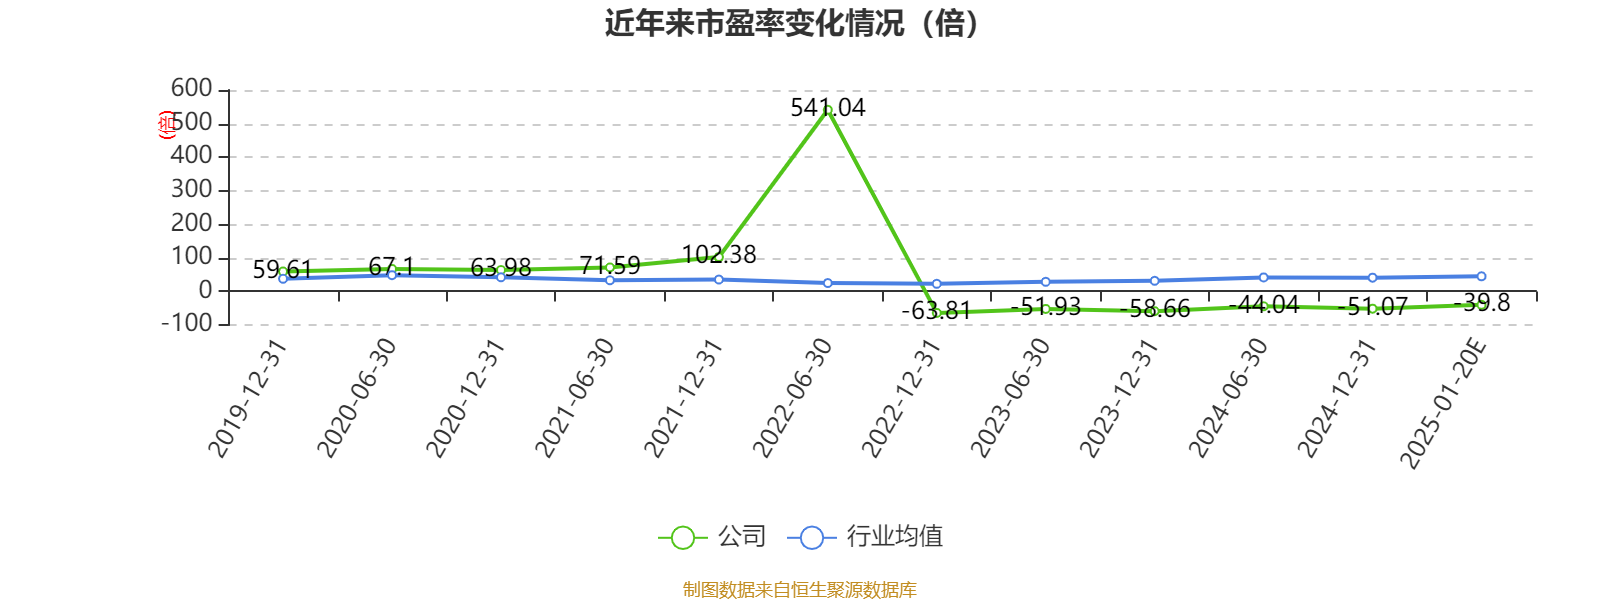
Based on the average value of this disclosed performance forecast, the company's price-to-earnings ratio (TTM) chart in recent years is as follows
:
According to the data, the company's electromagnetic shielding film, various copper foils, flexible copper clad laminates, resistive films, and composite copper foils.
According to the announcement, the reason for the change in the company's performance is that the sales volume of shielding film in 2024 will increase year-on-year, but due to the impact of the overall cost reduction and intensified competition in the industrial chain, the unit price of shielding film sales has decreased slightly, and the overall profitability of shielding film is basically the same as that of last year.
During the reporting period, the copper foil business is expected to make an impairment provision for fixed assets of 15 million, and at the same time, the company has taken a series of measures to improve product yield, adjust product structure, actively control product shipments, reduce production costs, etc., and actively develop and sell copper foil products with high gross profit such as RTF, which has slightly reduced the overall loss of copper foil products.
During the reporting period, the sales volume of flexible copper clad laminate increased significantly, as a new entrant in the industry, in order to open up the market, the sales unit price was low, and the economy of scale was not reached, and the depreciation of fixed assets was superimposed, and the flexible copper clad laminate business was still in a state of loss.
During the reporting period, a series of important progress has been made in the development and certification of new products, such as a certain model of peelable copper has completed the certification of some carrier board manufacturers and major chip terminals and obtained sample orders, the key technical indicators of copper foil products for high-speed copper shielding for AI servers have been recognized by customers, and the flexible shielding cover has entered the supply chain of a mainstream brand mobile phone terminal. However, due to the fact that the company's R&D products are basic composite electronic materials, the overall development and certification cycle is long, and it takes time to increase orders, stabilize production and improve yield, so it will take time for new products to contribute significantly to performance.
Proofreading: Yang Ning
Indicator Annotation:
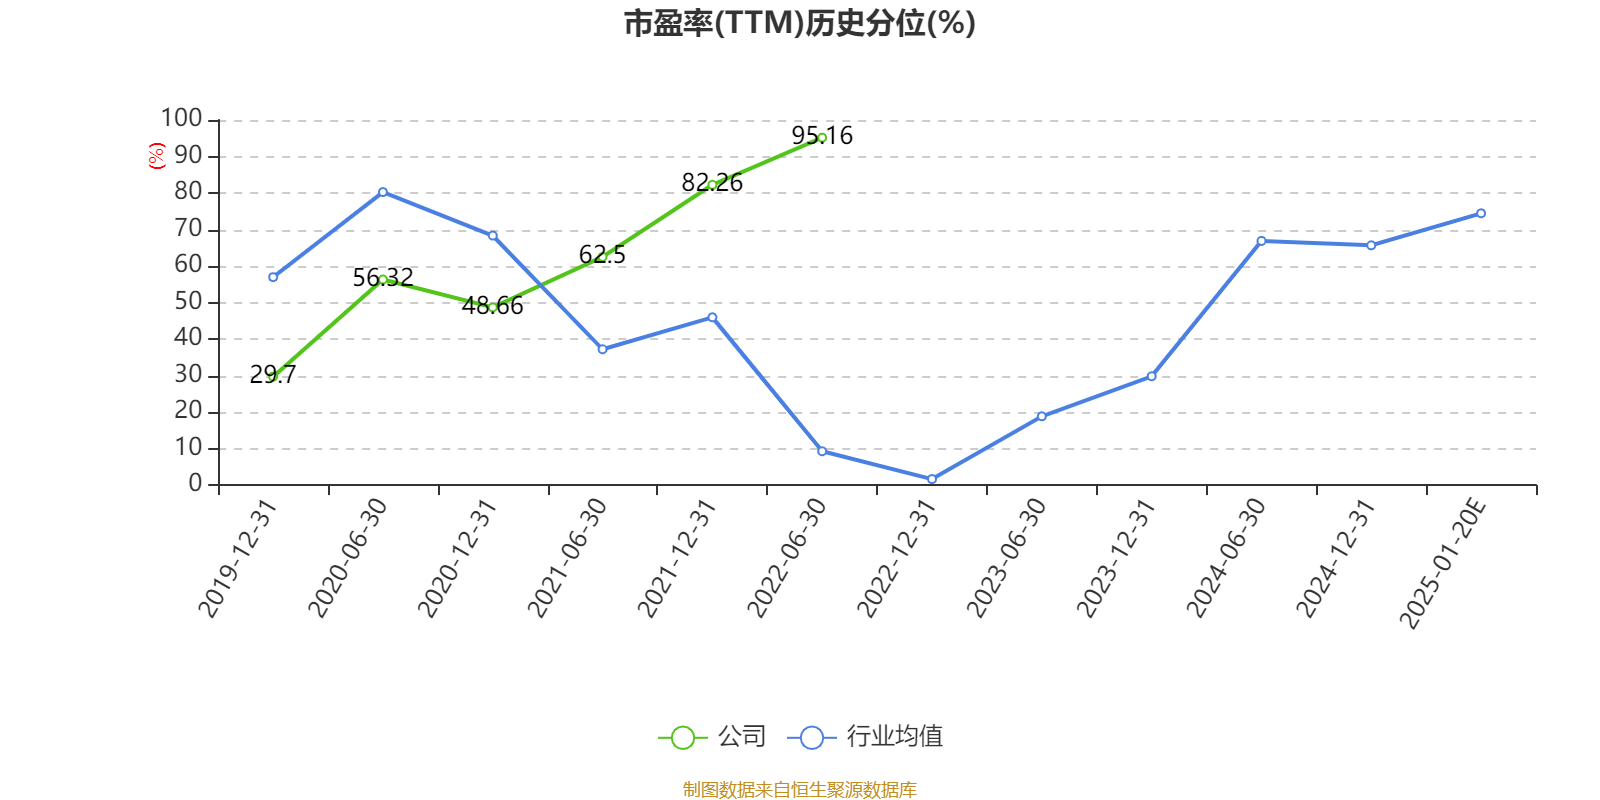
P/E ratio = total market capitalization / net profit. When the company loses money, the P/E ratio is negative, and it is not practical to use the P/E ratio for valuation, and the P/B ratio or P/B ratio is often used as a reference.
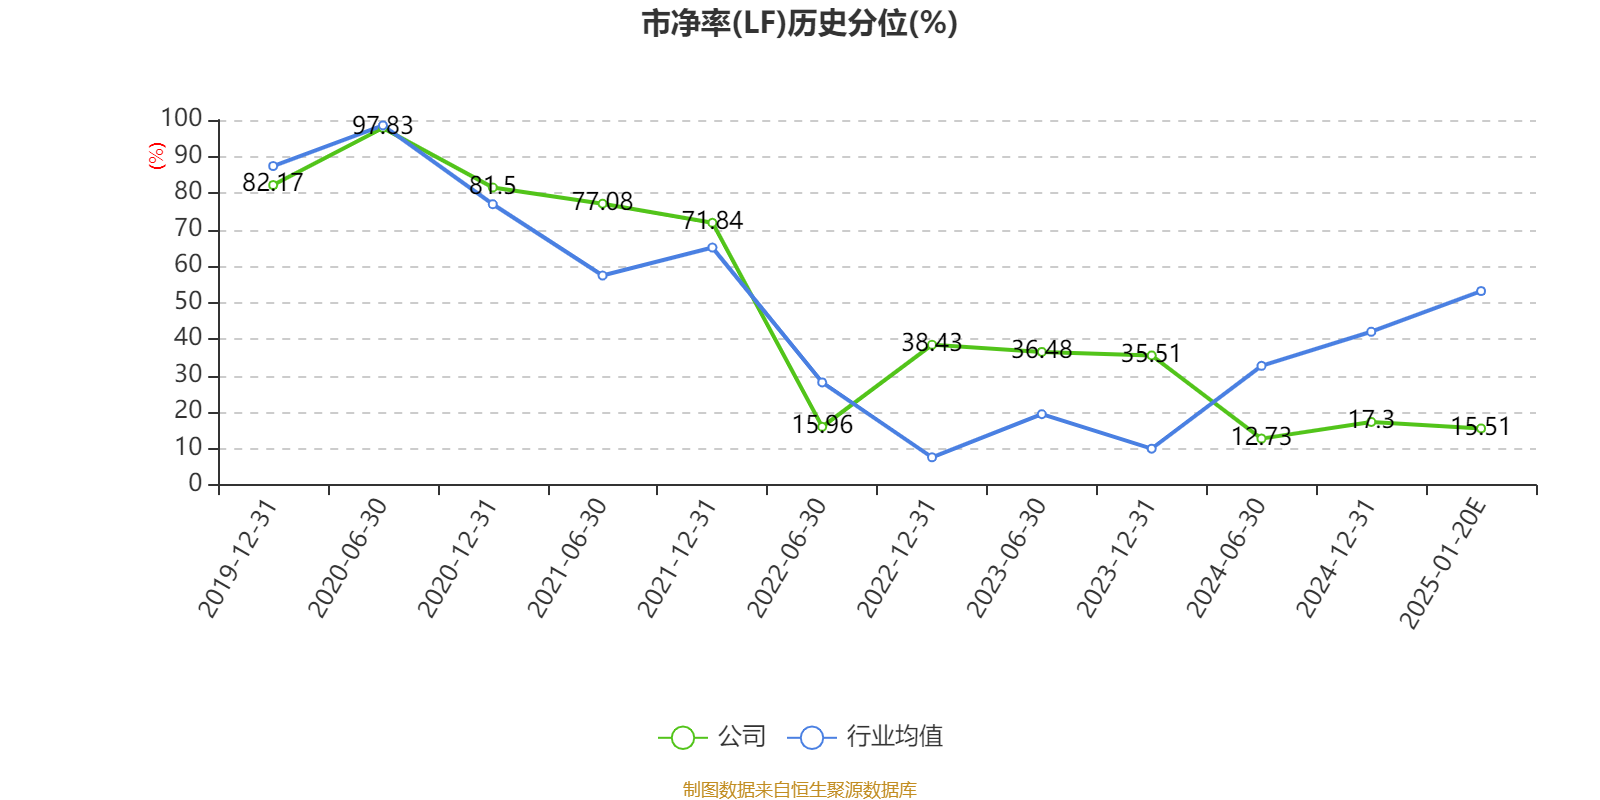
Price-to-book ratio = total market capitalization / net assets. The price-to-book ratio valuation method is mostly used for companies with large fluctuations in earnings and relatively stable net assets.
Price-to-sales ratio = total market capitalization / operating income. The price-to-sales ratio method is often used for growing companies that are losing money or making small profits.
The price-to-earnings ratio and price-to-sales ratio in this article are calculated using the TTM method, that is, the data for the 12 months up to the latest financial report (including forecast). The price-to-book ratio is calculated using the LF method, that is, based on the latest financial report data. The quantile calculation range of the three is from the company's listing to the latest announcement date.
When the P/E ratio and price-to-book ratio are negative, the current quantile is not displayed, which will cause the line chart to be interrupted.
Ticker Name
Percentage Change
Inclusion Date


