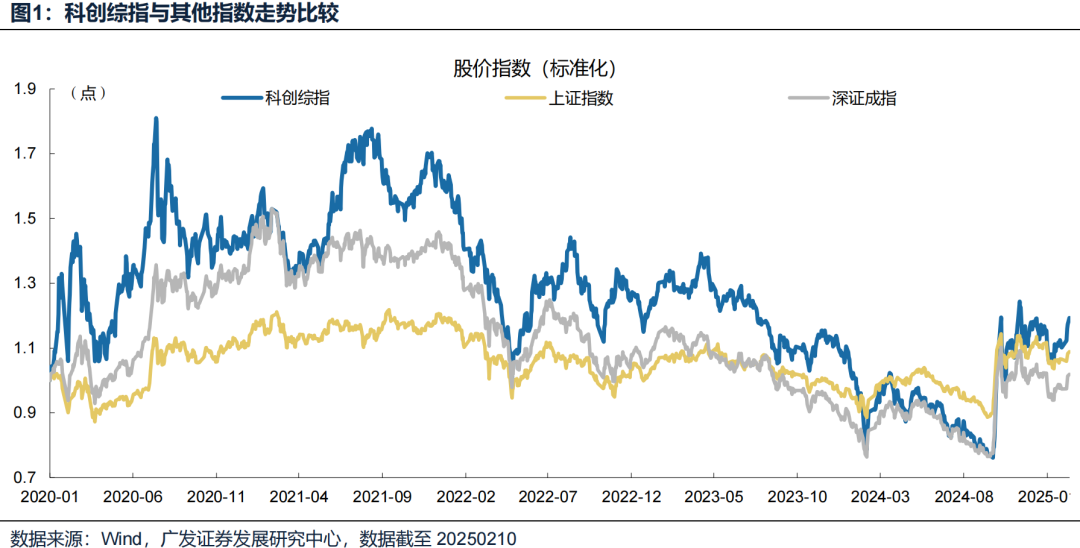
SSE STAR Market Composite Index: Since 2020 (as of 2.10), the annualized return of the STAR Market Composite Index is 3.65%, which is better than other broad-based indices such as the Shanghai Composite Index and the Shenzhen Component Index. In terms of risk, the volatility of the STAR Composite Index is slightly higher than that of the Shenzhen Component Index and the Shanghai Composite Index. Higher absolute returns and slightly higher volatility make the STAR Composite Index much better than other major broad-based indices.
Why is there an opportunity in the current Science and Technology Innovation Composite Index?
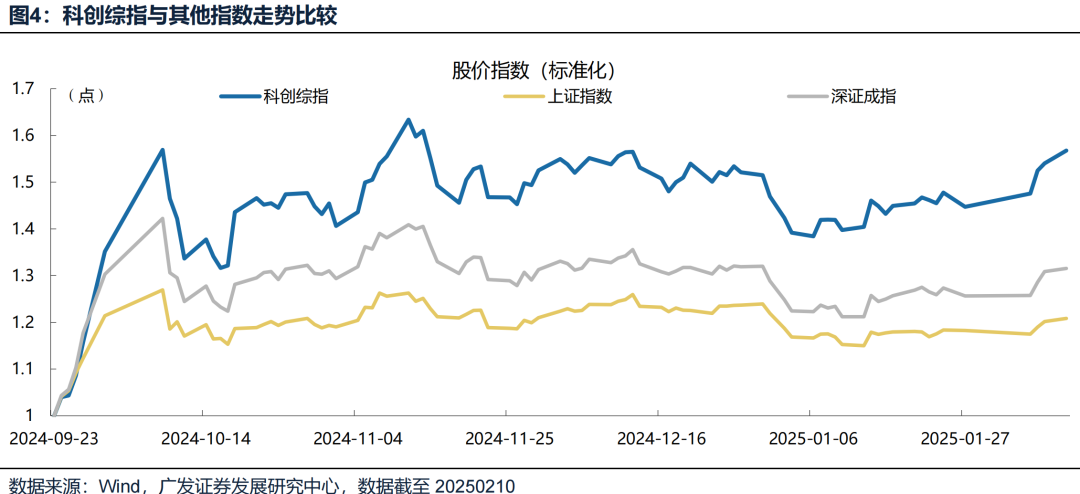
1. Ideal for thickening returns: In the recent market rebound, the STAR Composite Index has also shown stronger upward momentum. For example, between September 24, 2024 and February 10, 2025, the STAR Composite Index rose by 56.7%, significantly outperforming the 20.8% of the Shanghai Composite Index and the 31.5% of the Shenzhen Component Index, and the elasticity of the STAR Composite Index was significantly better than that of the broad-based index of the whole market.
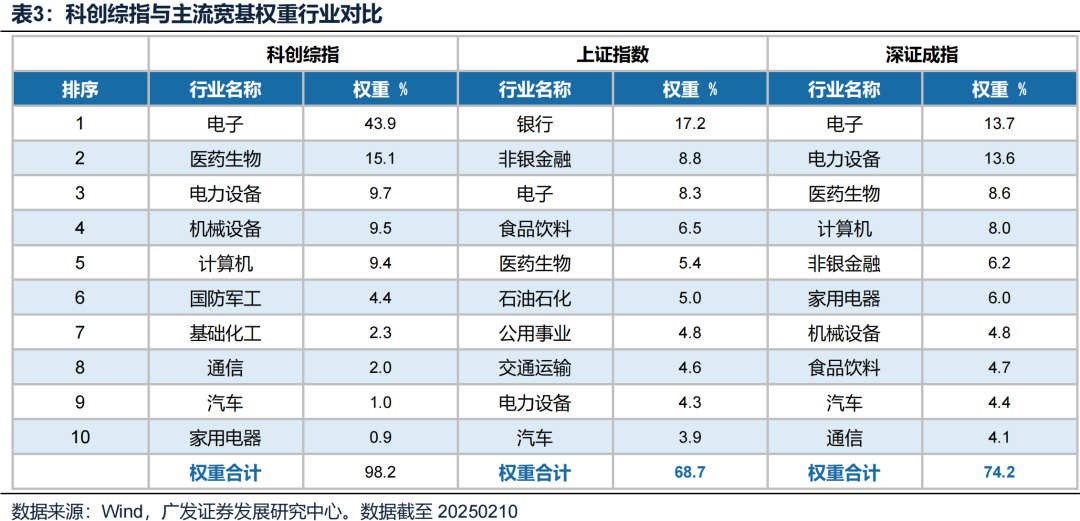
2. Focus on science and technology enterprises, focusing on reflecting the trend of scientific and technological innovation and industrial upgrading: The science and technology innovation composite index overpowers electronics (43.9%), medicine (15.1%) and machinery and equipment (9.5%), and the allocation of industry weights shows its emphasis on emerging technology industries.
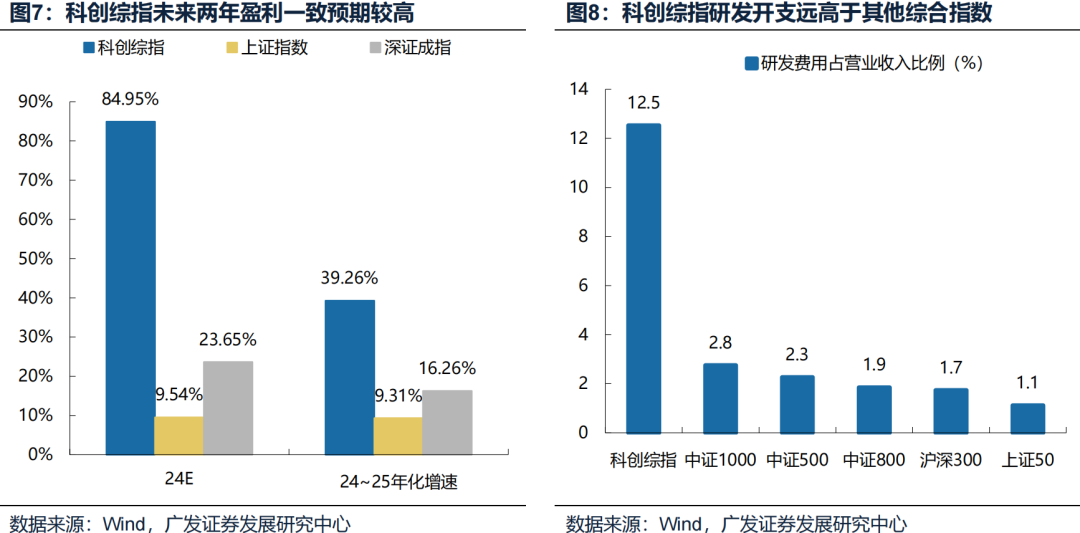
3. The consensus expectation that the net profit growth rate is better than that of other indices may be behind the high-intensity R&D investment of the Science and Technology Innovation Composite Index: In terms of industry distribution, the Science and Technology Innovation Composite Index accounts for a relatively high number and weight in industries such as semiconductors, power equipment, machinery manufacturing and medicine. Among them, the weight of the semiconductor industry reached 38.1%, the weight of the power equipment and machinery manufacturing industry was about 10%, and the weight of the pharmaceutical industry was 8.3%.
4. The current position of equity assets is still low, the Federal Reserve still expects two interest rate cuts, and foreign capital is expected to accelerate the inflow of A-share technology growth: The annualized growth rate of the Science and Technology Innovation Composite Index in 2024-2025 is expected to be 39.26%, much higher than other composite indexes. As of the third quarter of 2024, the median R&D expenses of the constituent stocks of the STAR Composite Index as a percentage of revenue is 12.5%.
5. Fearless of short-term technology industry rotation, the Science and Technology Innovation Composite Index allocates the optimal technology growth assets with one click. There are usually opportunities for rotation and replenishment within the technology growth sector, but it is difficult for ordinary investors to accurately grasp the style switch, while the Science and Technology Innovation Composite Index can allocate the optimal technology growth assets with one click.
6. The U.S. election has landed on the ground, overseas macro uncertainty has decreased, and China's policy bottom has appeared, and the medium-term style of the technology growth sector is expected to prevail. The poor performance growth rate is the core factor that determines the relative trend of the style, and the emergence of DeepSeek will bring strong support to the subsequent AI industry, which is expected to drive the performance growth gap of the technology growth style to widen again.
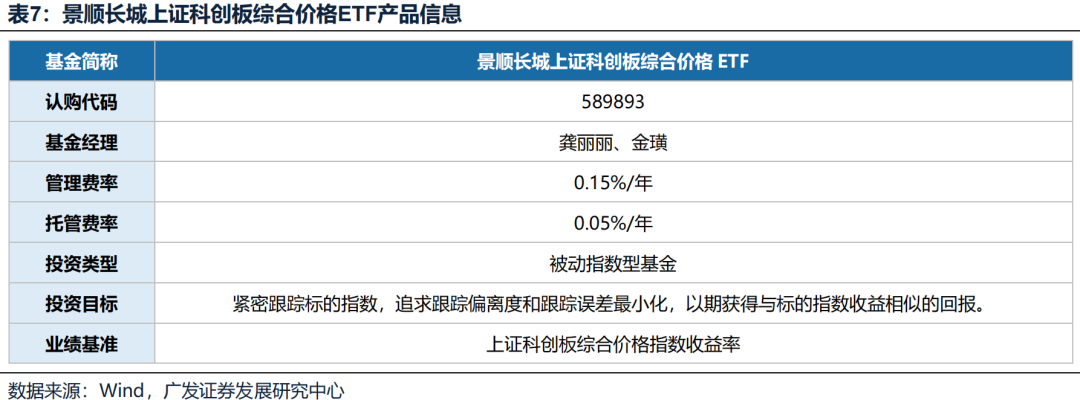
Invesco Great Wall SSE STAR Market Composite Price ETF (589893): The first batch of SSE STAR Market Composite Price ETFs. It will be officially released on February 17, 2025.
Risk warning: the risk of performance falling short of expectations, geopolitical risk, ETF tracking error risk, etc.
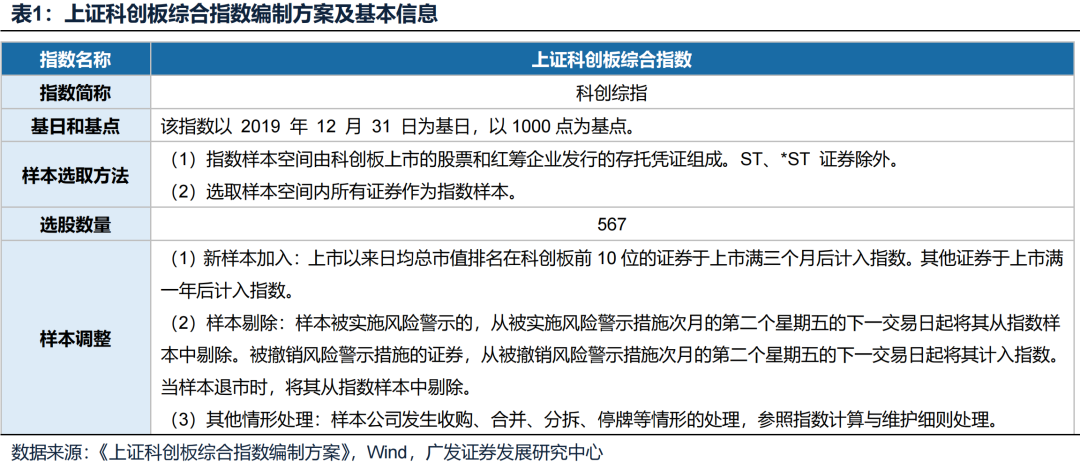
1. SSE STAR Market Composite Index: A comprehensive depiction of the overall performance of the STAR Market
SSE STAR Market Composite Index: The SSE STAR Market Composite Index selects all eligible securities of listed companies (except ST and *ST securities) from the SSE STAR Market as the index sample, aiming to fully reflect the overall performance of the STAR Market. The index has a market capitalization coverage of nearly 97% and includes large, medium and small-cap securities, with an average and median total market capitalization of $13.5 billion and $5.4 billion as of February 10, 2025. The distribution of its industries is relatively balanced, with semiconductors, power equipment, machinery manufacturing and pharmaceuticals accounting for a relatively high number and weight, of which the weight of semiconductors is 38%. The launch of the STAR Market Composite Index complements the existing STAR Market Scale Index, further covering more than 200 small-capitalization companies with high growth potential that are not included in the STAR 50, STAR 100 and STAR 200 Indexes. As an important core index of the STAR Market, the STAR Composite Index not only provides investors with a powerful tool to observe the overall operation of the STAR Market, but also provides diversified options for domestic and foreign medium and long-term capital allocation to the STAR Market.
Second, the long-term yield significantly outperforms other broad-based indices, thanks to the high growth behind it
From the perspective of both returns and risks, the Science and Technology Innovation Composite Index shows a high return elasticity and a relatively controllable risk level. Specifically:
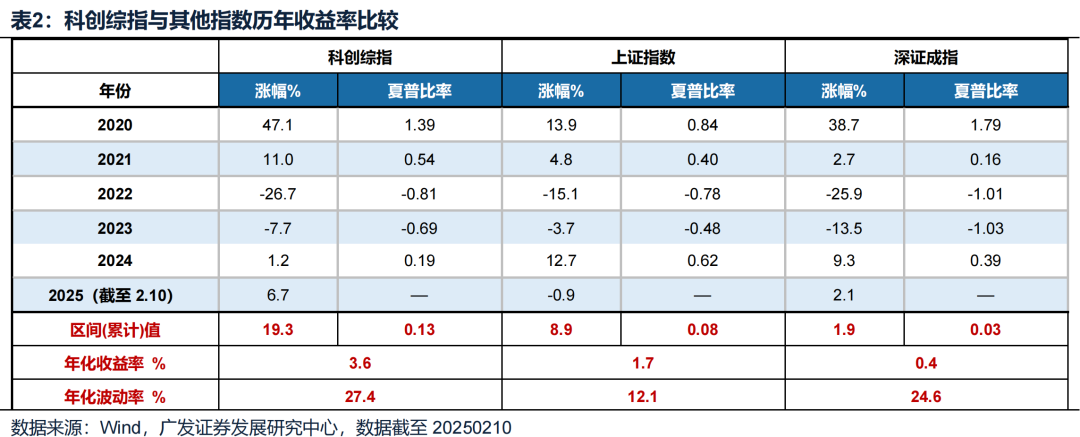
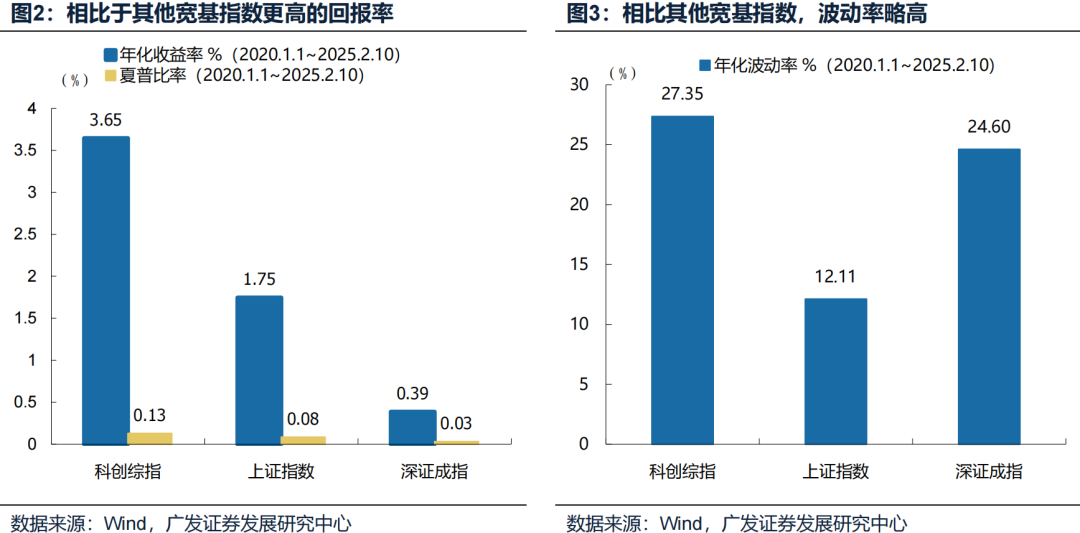
(1) In terms of income, the annualized return of the STAR Composite Index is 3.6%, which is better than other broad-based indices such as the Shanghai Composite Index and the Shenzhen Component Index. The Science and Technology Innovation Composite Index was established on December 31, 2019, and in the time period of January 1, 2020 ~ February 10, 2025, among the mainstream broad-based indexes, the cumulative returns of the Shanghai Composite Index and the Shenzhen Component Index were 8.9% and 1.9% respectively, and the corresponding annualized returns were 1.7% and 0.4% respectively; The cumulative return of the STAR Composite Index is 19.3%, and the corresponding annualized return is 3.6%.
(2) In terms of risk, the volatility of the STAR Composite Index is slightly higher than that of the Shenzhen Component Index and the Shanghai Composite Index. In the time period of January 1, 2020 ~ February 10, 2025, the annualized volatility of the STAR Composite Index is 27.4%, slightly higher than the 12.1% of the Shanghai Composite Index and the 24.6% of the Shenzhen Component Index.
(3) Higher absolute returns and slightly higher volatility make the Sharpe ratio of the STAR Composite Index much better than that of other major broad-based indices. In the time period of January 1, 2020 ~ February 10, 2025, the annualized Sharpe ratio of the STAR Composite Index is 0.13, which is higher than the 0.08 of the Shanghai Composite Index and the 0.03 of the Shenzhen Component Index.
3. Science and Technology Innovation Composite Index: Capture the growth opportunities of scientific and technological innovation and industrial upgrading
(1) Ideal choice for thickening income
The STAR Composite Index is suitable as an allocation to thicken returns in a portfolio. Although the volatility of the STAR Composite Index is slightly higher than that of other broad-based indices, making it suitable for investors who can withstand certain volatility and seek long-term growth, the annualized return of 3.65% and the Sharpe ratio of 0.13 have shown a good balance between risk and return since 2020. The industrialization cycle of scientific and technological innovation usually takes 3-5 years, which is suitable for capital allocation that can cross the market cycle, and the high-yield characteristics of the Science and Technology Innovation Composite Index enable it to capture the growth opportunities brought by scientific and technological innovation and industrial upgrading, and bring excess returns to the portfolio.
In the recent market rebound, the Science and Technology Innovation Composite Index has also shown stronger upward momentum. For example, between September 24, 2024 and February 10, 2025, the STAR Composite Index rose by 56.7%, significantly outperforming the 20.8% of the Shanghai Composite Index and the 31.5% of the Shenzhen Component Index, and the elasticity of the STAR Composite Index was significantly better than that of the broad-based index of the whole market.
(2) Focus on science and technology enterprises, focusing on reflecting the trend of scientific and technological innovation and industrial upgrading
The Science and Technology Innovation Composite Index overallocates electronics, pharmaceuticals and machinery and equipment, and its allocation in terms of industry weight shows its emphasis on emerging technology industries. (1) The electronics industry accounts for 43.9% of the weight of the STAR Composite Index, much higher than the weight of the electronics industry in the Shanghai Composite Index and the Shenzhen Component Index (8.3% and 13.7% respectively). (2) The pharmaceutical and biological industry accounts for 15.1% of the weight of the Science and Technology Innovation Composite Index, which is also higher than the weight of the pharmaceutical and biological industry in the Shanghai Composite Index and the Shenzhen Stock Exchange Component Index (5.4% and 8.6%, respectively). (3) The weight of the machinery and equipment industry in the Science and Technology Innovation Composite Index is 9.5%, which is also higher than the weight of the machinery and equipment industry in the Shanghai Composite Index and the Shenzhen Component Index (3.5% and 4.8%, respectively).
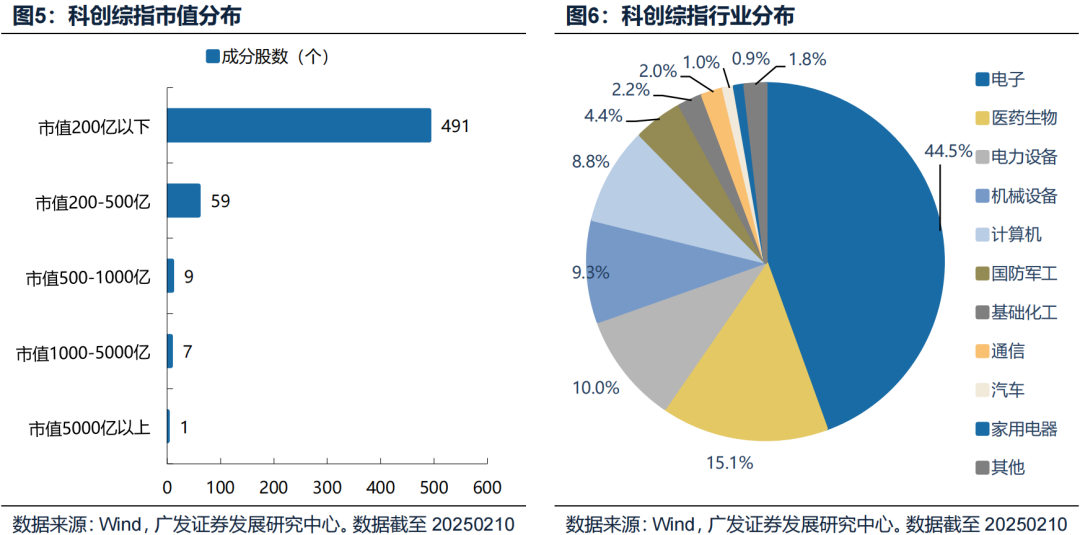
From the perspective of market capitalization distribution, as of February 10, 2025, the average and median total market capitalization of the sample of the STAR Market Composite Index are 13.5 billion yuan and 5.4 billion yuan, respectively, which are basically the same as the whole market of the Science and Technology Innovation Board. The STAR Composite Index includes large, medium and small-cap securities, with a market capitalization coverage of nearly 97%, which can more broadly represent the overall performance of listed companies of different sizes on the STAR Market.
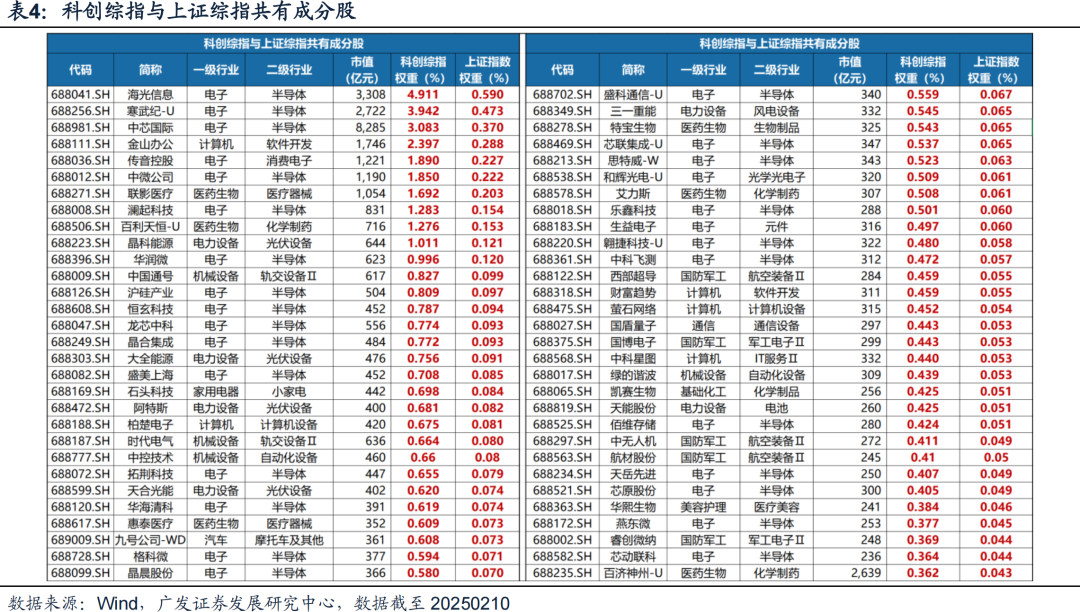
The STAR Composite Index is the most technologically advanced part of the Shanghai Composite Index. The 567 constituents of the STAR Composite Index are all among the constituent stocks of the Shanghai Composite Index, and the weight of technology growth stocks is much higher than that of the Shanghai Composite Index. For example, Haiguang Information (688041. SH) has a weight of 4.91% in the STAR Composite Index and only 0.59% in the Shanghai Composite Index. The Science and Technology Innovation Composite Index attaches more importance to scientific and technological innovation enterprises, especially those in high-tech fields such as semiconductors, medicine and biology, and power equipment. In contrast, the Shanghai Composite Index has a wider distribution of industries, covering many traditional industries such as finance, real estate, and consumption. This difference in the distribution of industries reflects the difference in market representation between the two indexes, with the STAR Composite Index focusing on reflecting the trend of technological innovation and industrial upgrading, while the Shanghai Composite Index is more representative of the overall operation of China's economy.
(3) The consensus expected net profit growth rate in 24~25 years is better than that of other indexes, which may be behind the high-intensity R&D investment of the Science and Technology Innovation Composite Index
The STAR Composite Index has shown significant advantages in terms of earnings expectations for the next two years. According to Wind's consensus estimates, the STAR Composite Index's earnings are expected to reach 84.95% in 2024, well above the Shanghai Composite Index's 9.54% and the Shenzhen Component Index's 23.65%. At the same time, the annualized growth rate of the STAR Composite Index from 2024 to 2025 is expected to be 39.26%, which is also significantly higher than the 9.31% of the Shanghai Composite Index and the 16.26% of the Shenzhen Component Index.
Behind the high growth may be the high-intensity R&D investment of the Science and Technology Innovation Composite Index. As of the third quarter of 2024, the median R&D expenses of the constituent stocks of the STAR Composite Index as a proportion of revenue is 12.5%, which is much higher than that of broad-based indices such as CSI 1000, CSI 500, CSI 800, CSI 300 and SSE 50. Behind the continuous high R&D investment, the market also has stronger profit expectations for the Science and Technology Innovation Composite Index.
(4) The current position of equity assets is still low, the Federal Reserve is still expected to cut interest rates twice, and foreign capital is expected to accelerate the inflow into A-share technology growth
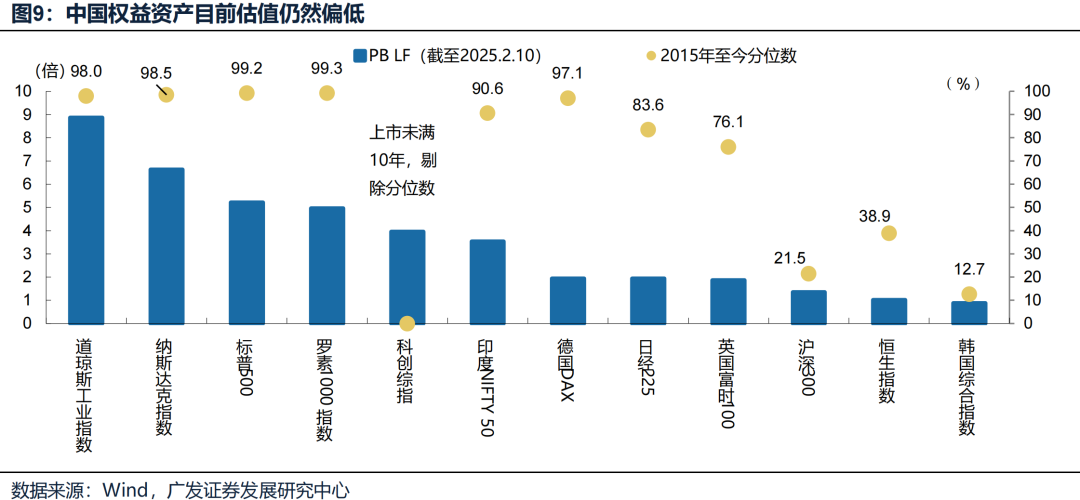
A-share valuations are currently in the middle of the post-historic bottom rally, but are still low compared to the rest of the world. As of February 10, 2025, the PB LF of the CSI 300 is 1.4X, which is at the 21.5% quantile since 2015, and the valuation and quantile of China's assets represented by the CSI 300 are lower than the stock indexes in major overseas markets, and the PB of the Science and Technology Innovation Composite Index, which represents the strongest growth of Chinese assets, is 4.0X, but it is still far lower than the 6.6X of the NASDAQ, and there is still a lot of room for valuation improvement. With the recent volatility of the global stock market and the stability of the RMB exchange rate, the attractiveness of A-shares to global funds has begun to rise, and the attractiveness of the STAR Composite Index is also expected to increase.
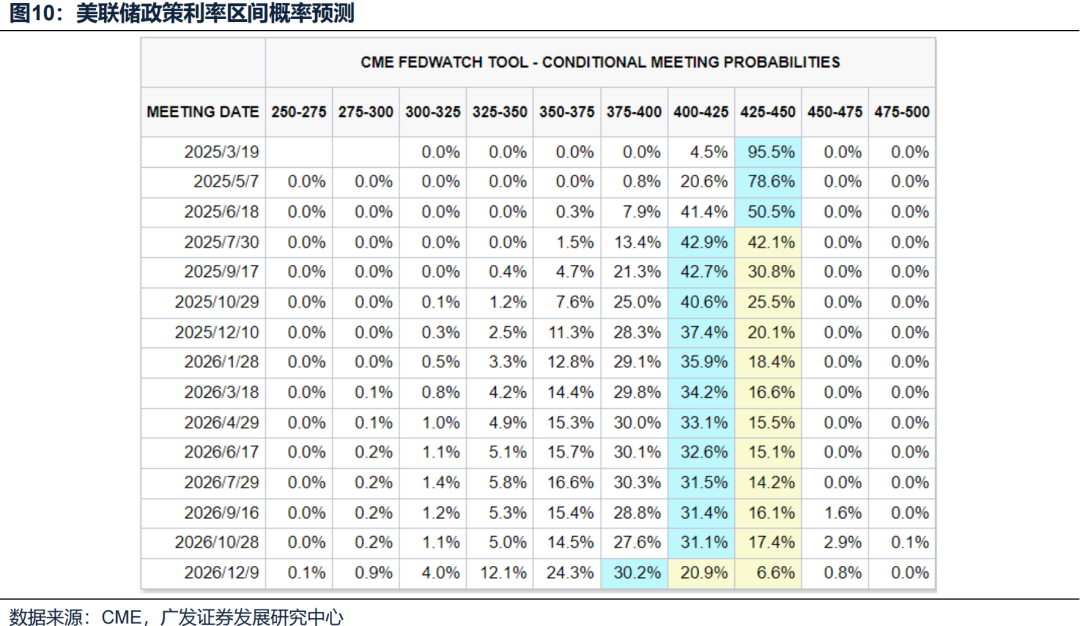
In the past two years, with the mismatch between the Chinese and US cycles, with the improvement of overseas liquidity and policy support, the trend of pressure on the performance of RMB assets is expected to reverse, and the pressure on foreign capital outflows is expected to be eased. On the one hand, overseas easing policies can reduce the pressure of RMB depreciation to a certain extent, and can reduce domestic policy constraints, making domestic monetary policy more flexible, which is conducive to improving the effect of stable economic growth. On the other hand, the Fed's entry into the interest rate cut cycle is also conducive to the return of foreign capital to A-shares, which in turn promotes the growth of A-shares and the rebound of core assets.
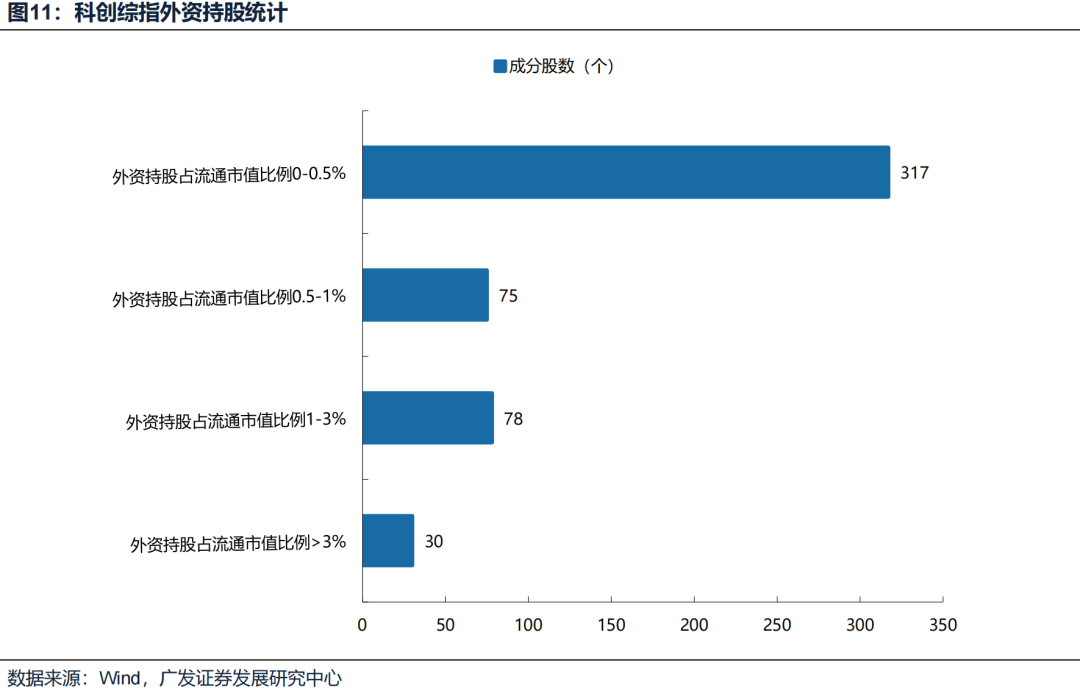
The proportion of foreign ownership of Chinese technology stocks is still low, and there is still a large room for inflow in the future. As an important part of China's capital market, the STAR Market is gradually becoming a hot spot for foreign investment. Among the constituent stocks of the Science and Technology Innovation Board, the number of companies with foreign holdings accounting for 0-0.5% of the circulating market value is the largest, reaching 317, while only 30 companies with foreign holdings accounting for more than 3% of the circulating market capitalization.
(5) Regardless of the short-term rotation of the technology industry, the Science and Technology Innovation Composite Index allocates the optimal technology growth assets with one click
In the short term, the market may see a high-low switch within technology stocks or growth. On the one hand, Deepseek's scientific and technological achievements bring greater imagination to the vertical downward end and application of AI, referring to the industrial path from smart phones to mobile Internet in 13-15 years, from hardware → infrastructure → terminal → applications, China has rich development experience in the field of application innovation empowered by general technology. On the other hand, the fund's quarterly report shows that TMT's internal holdings are differentiated, among which the proportion of hardware-related AI chips/SOC and other configurations has reached a new high, and robots/optical modules/consumer electronics are also at a high level. The configuration of computers/media in software and application fields is at a historically low level.
The Science and Technology Innovation Composite Index can allocate the optimal technology growth assets with one click, regardless of the rotation of the technology industry. There are usually opportunities for rotation and replenishment within the technology growth sector, but it is difficult for ordinary investors to accurately grasp the style switch, while the Science and Technology Innovation Composite Index can allocate the optimal technology growth assets with one click.
(6) The U.S. election has landed on the ground, overseas macro uncertainty has decreased, and China's policy bottom has appeared, and the medium-term style of the technology growth sector is expected to prevail
China's policy bottom has appeared: in order to deal with the macro and micro problems caused by the lack of nominal growth rate center, on September 24, a package of incremental policies released a signal to strengthen the counter-cyclical, and on September 26, the Politburo meeting further confirmed the opening of a round of stable growth cycle, followed by the Ministry of Finance, the Ministry of Housing and Urban-Rural Development, etc., have successively issued relevant policies, strengthening the determination and urgency of the top level to stabilize the economy, injecting confidence into the improvement of fundamental expectations, and further boosting market risk appetite, on November 8, the Standing Committee of the National People's Congress adopted the "6+4" debt framework. The "bottom of the policy" is basically confirmed.
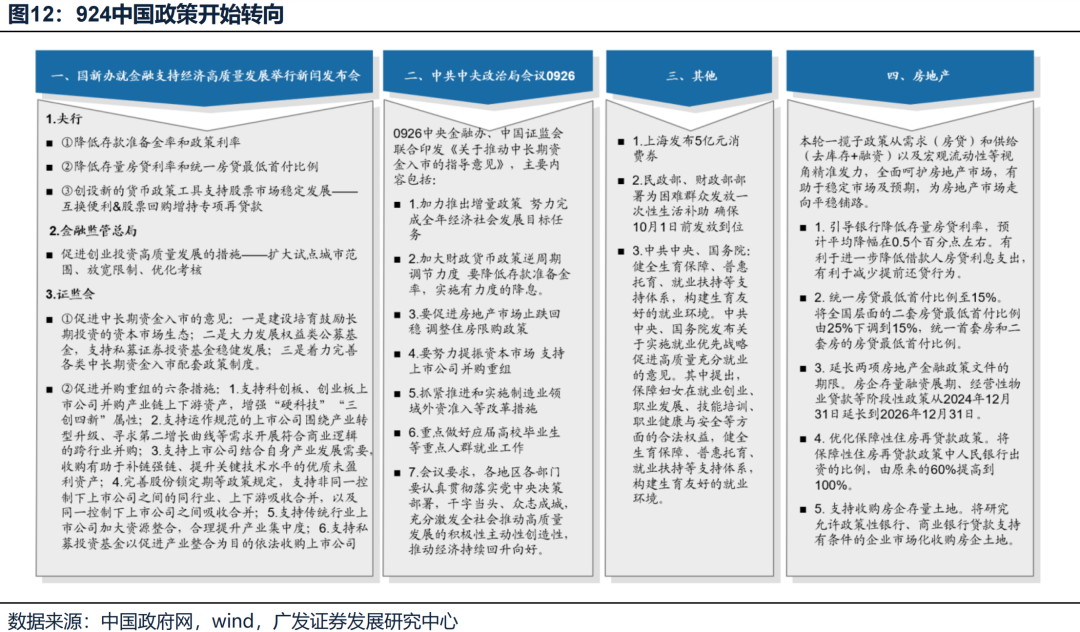
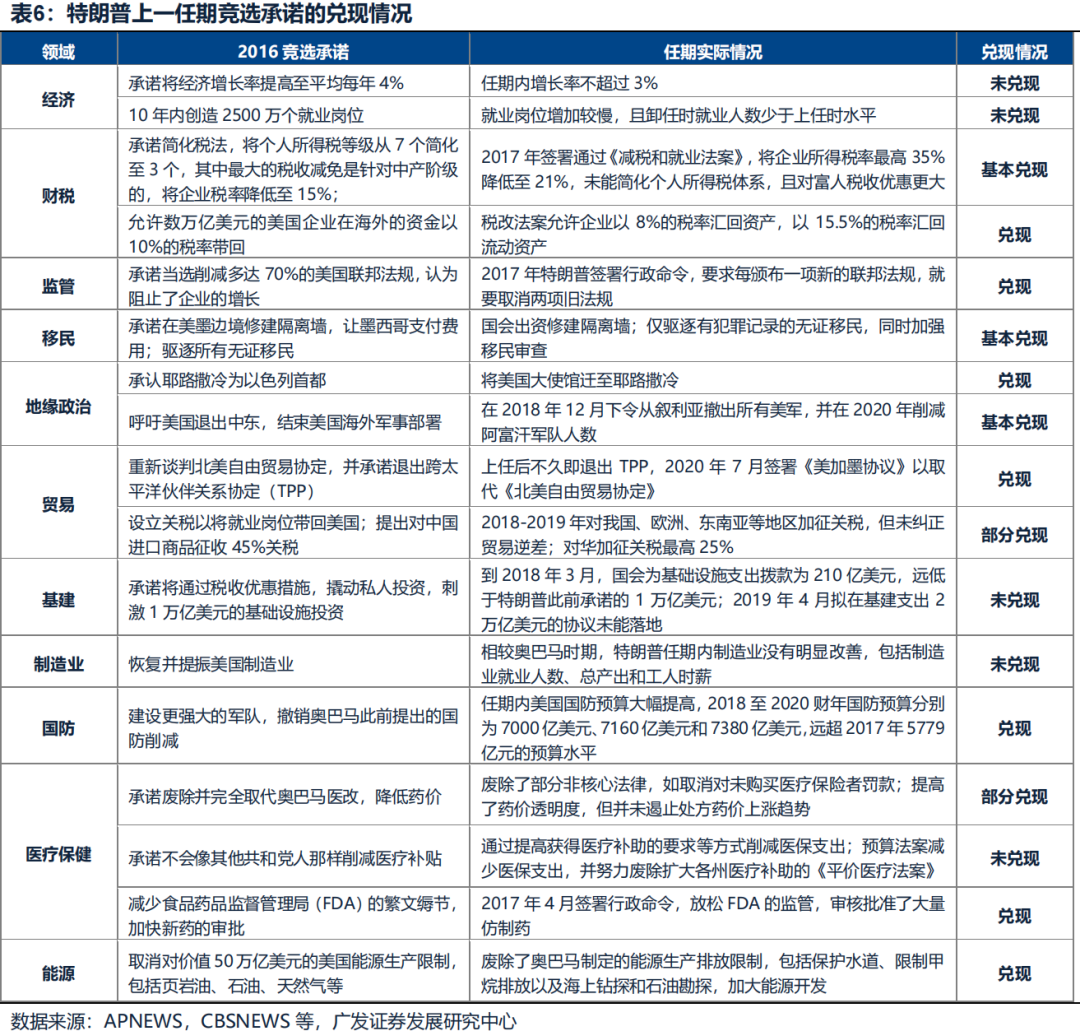
The U.S. election has landed on the ground, and overseas macro uncertainty has decreased: Trump's previous election campaign tariff sanctions promise has not been fully fulfilled, but has been greatly discounted, such as promising to abolish Obamacare, reduce drug prices, and not cut medical subsidies, etc., and finally tried to fulfill but did not succeed.
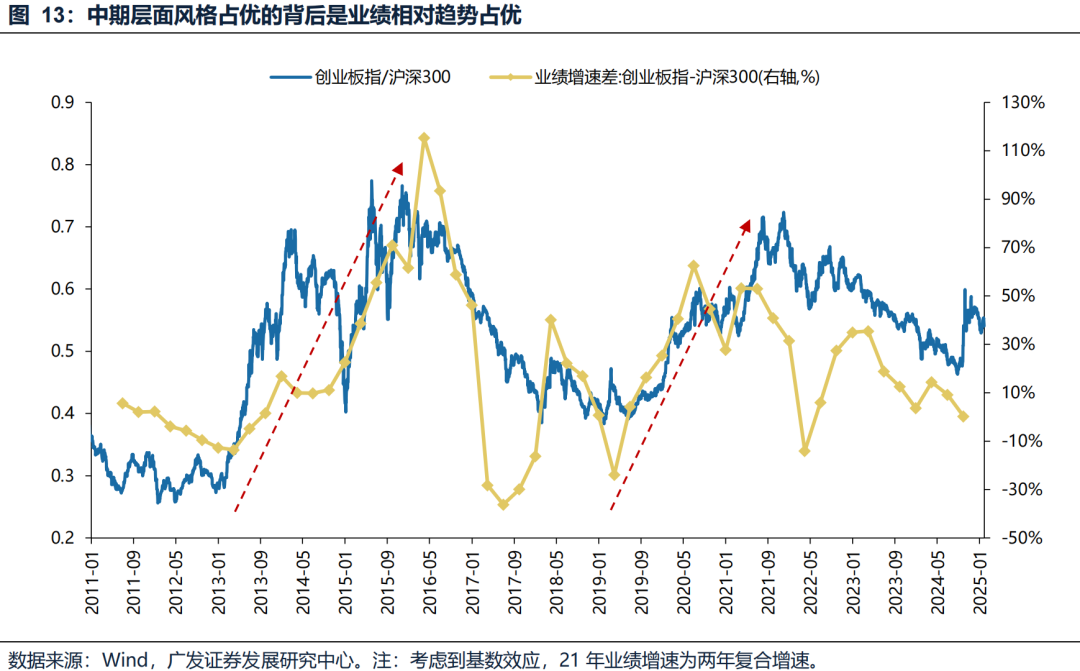
Looking forward to the medium-term dimension, the performance growth rate difference is the core factor that determines the relative trend of the style, and the emergence of DeepSeek will bring strong support to the subsequent AI industry, which is expected to drive the performance growth gap of the technology growth style to widen again.
Considering the lack of historical data of the Science and Technology Innovation Board, if the ChiNext index is used to approximate instead of the growth style, and the CSI 300 approximate represents the value style, it can be seen that behind the continuous dominance of the growth style in 13-15 years and 19-21 years, there is a widening gap between the growth direction and the relative advantage of the value direction. Behind the expansion of this relative advantage in performance, there are major changes in the industrial cycle, such as the issuance of 4G licenses in 13 years, the switch from the 3G era to the 4G era, such as the issuance of 5G licenses in 19 years, the switch from the 4G era to the 5G era, the rebound of the global semiconductor cycle, and the acceleration of domestic substitution, such as the delivery of the domestic Model 3 at the end of 19 years, and the 20-year "double carbon goal" proposed. The changes in 2025 may be mainly due to the fact that Deepseek's scientific and technological achievements will bring greater imagination to the vertical downward end and application of AI.
4. Invesco Great Wall SSE STAR Market Composite Price ETF (589893): The first batch of SSE STAR Market Composite Price ETFs
According to the company's official website, Invesco Great Wall Fund Management Co., Ltd. was established on June 12, 2003, and is the first Sino-US joint venture fund management company in China approved by the China Securities Regulatory Commission Zheng Jian Ji Jin Zi [2003] No. 76. Invesco Great Wall Fund was established by Invesco and Great Wall Securities, together with Kailuan Group and Success Group, of which Invesco and Great Wall Securities each hold 49% of the company's shares. The company has a registered capital of 130 million yuan, headquartered in Shenzhen, with branches in Beijing, Shanghai and Guangzhou.
In 2023, the company won the "Golden Bull Fund Management Company Award" and "Golden Bull Award 20th Anniversary Special Contribution Company Award" selected by China Securities Journal, and won the "2023 Golden Fund · Top Company Award.
Launched on February 17, 2025, the Invesco Great Wall SSE STAR Market Composite Price ETF (ticker symbol: 589893) is a company that closely tracks the SSE STAR Market Composite Price Index (000681. SH).
In addition, in order to better achieve the investment objective, the fund can invest a small amount in some non-constituent stocks (including the main board, the Science and Technology Innovation Board, the Growth Enterprise Market and other stocks and depositary receipts approved or registered by the China Securities Regulatory Commission), derivatives (stock index futures, stock options, etc.), bonds (including treasury bonds, financial bonds, corporate bonds, corporate bonds, local government bonds, publicly issued subordinated bonds, exchangeable bonds, Convertible bonds, pure debt portions of convertible bonds traded separately, central bank bills, medium-term notes, short-term financing bonds, ultra-short-term financing bonds, government-backed agency bonds, government-backed bonds), asset-backed securities, bond repurchases, bank deposits (including agreement deposits, time deposits and other bank deposits), interbank certificates of deposit, money market instruments and other financial instruments in which the CSRC allows the fund to invest (subject to the relevant regulations of the CSRC).
The Fund's portfolio ratio is as follows: the Fund's assets invested in the underlying index constituents and alternative constituents are not less than 90% of the Fund's net asset value and not less than 80% of the non-cash fund assets, except where restricted by laws and regulations. At the end of each trading day, after deducting the trading margin required for stock index futures contracts and stock option contracts, cash shall be maintained not less than one time of the trading margin, of which cash does not include settlement reserves, deposit margins and subscription receivables.
Quarterly evaluation of dividends provides investors with one more choice: the fund manager can regularly evaluate the excess rate of return of the fund relative to the underlying index once a quarter, and if the growth rate of the net value of the fund share approved on the fund return evaluation date exceeds the growth rate of the underlying index in the same period, the fund manager can distribute the income. The income distribution ratio of the fund is 50% of the excess return of the fund that meets the above fund dividend conditions on the return evaluation date. Income distribution can be avoided for less than 3 months from the effective date of the fund contract, and the fund income distribution can be made up to 4 times a year.
The Invesco Great Wall SSE STAR Market Composite Price ETF tracks the SSE STAR Market Composite Price Index, and the fund's investment strategy is as follows: by comprehensively considering the liquidity, investment restrictions, transaction costs, trading restrictions and other factors of the underlying index constituents, the fund's stock portfolio can be constructed by selecting the full replication method or the sampling replication method to better achieve the purpose of tracking the underlying index.
5. Risk Warning
There may be a risk of tracking deviation and tracking error in the ETF tracking index; The larger-than-expected geopolitical conflict has put more upward pressure on global inflation than expected; Overseas inflation and the resilience of the U.S. economy have led to a weaker easing of global liquidity (the timing of the Fed's interest rate cuts, the decline in U.S. Treasury rates) than expected; The domestic policy to stabilize growth is less than expected, which makes the economic recovery weak, and the index performance is lower than expected.
Ticker Name
Percentage Change
Inclusion Date


