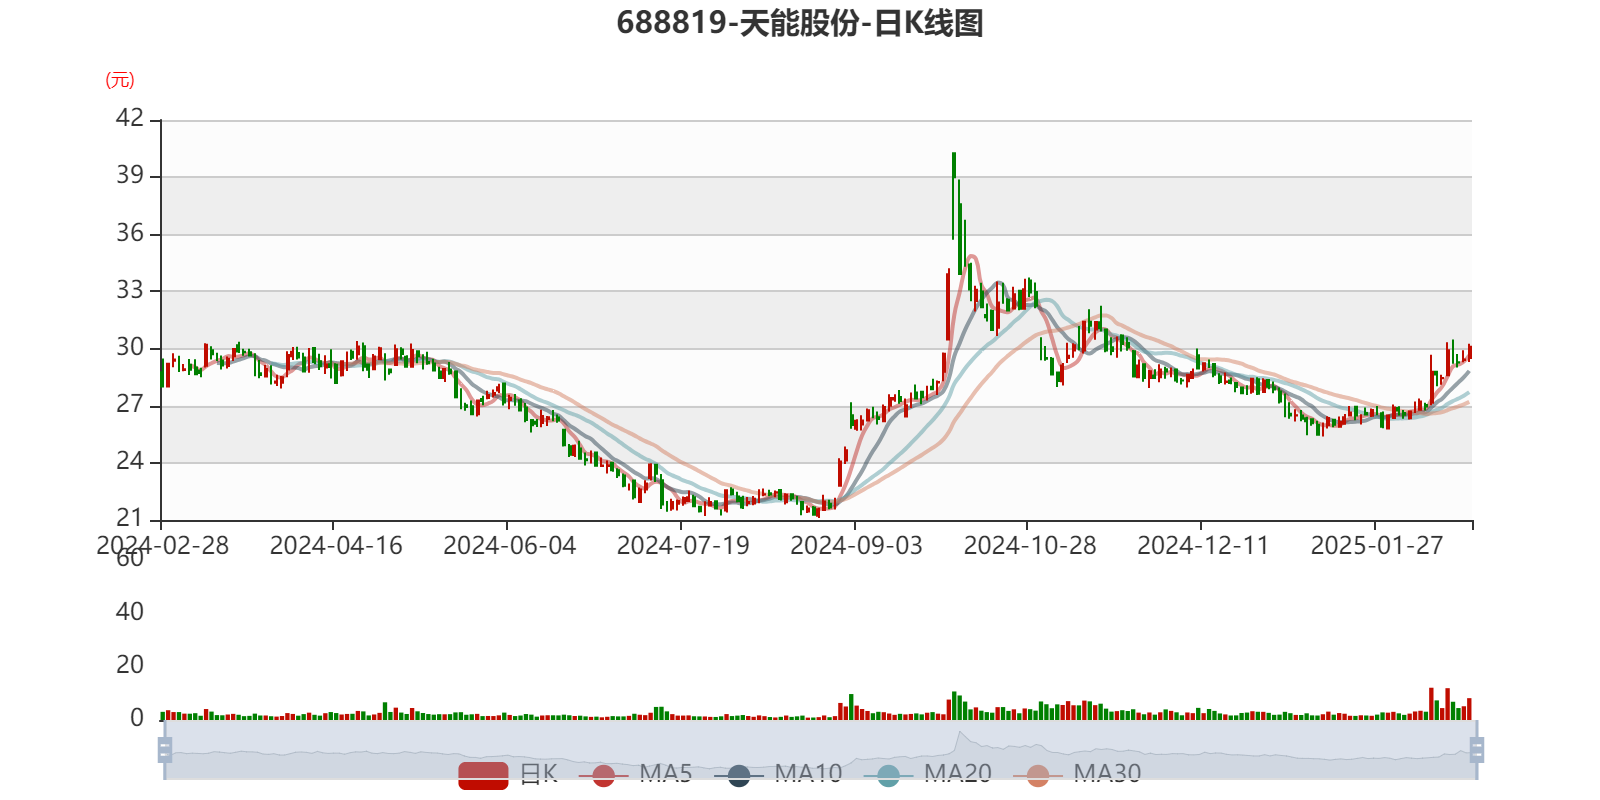
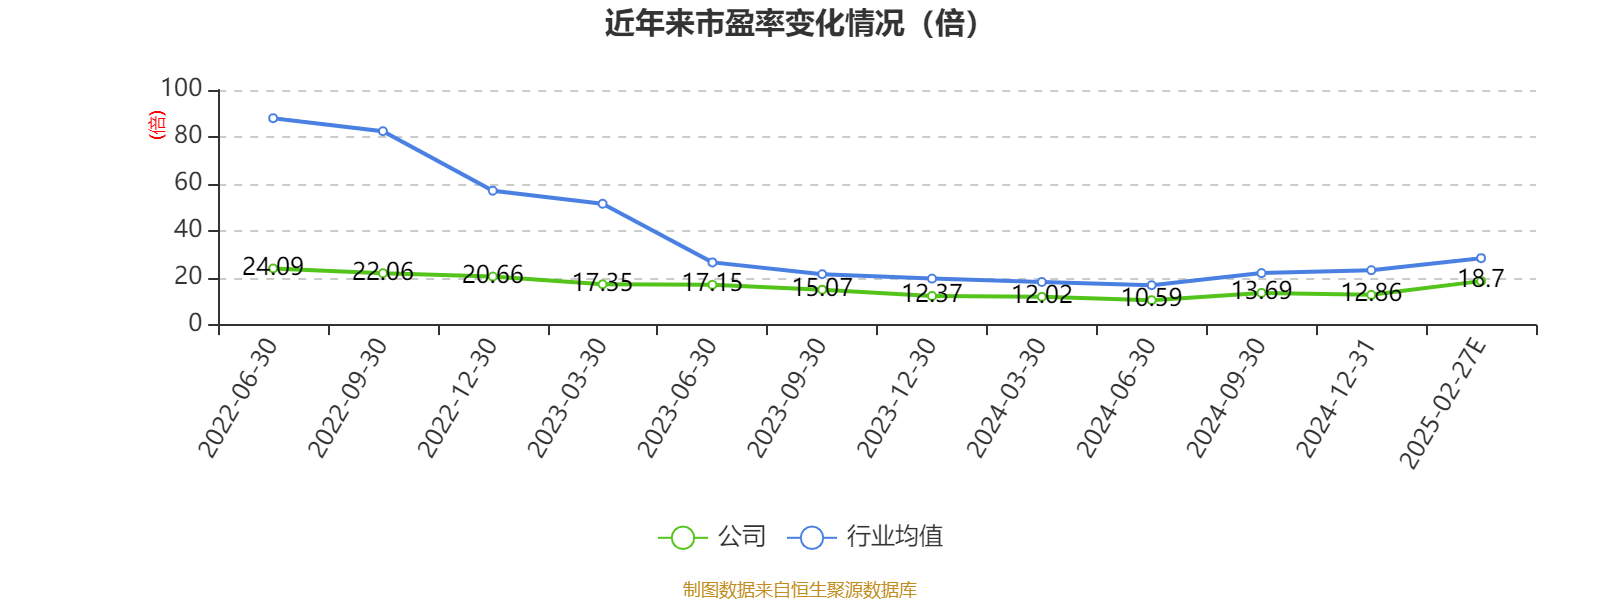
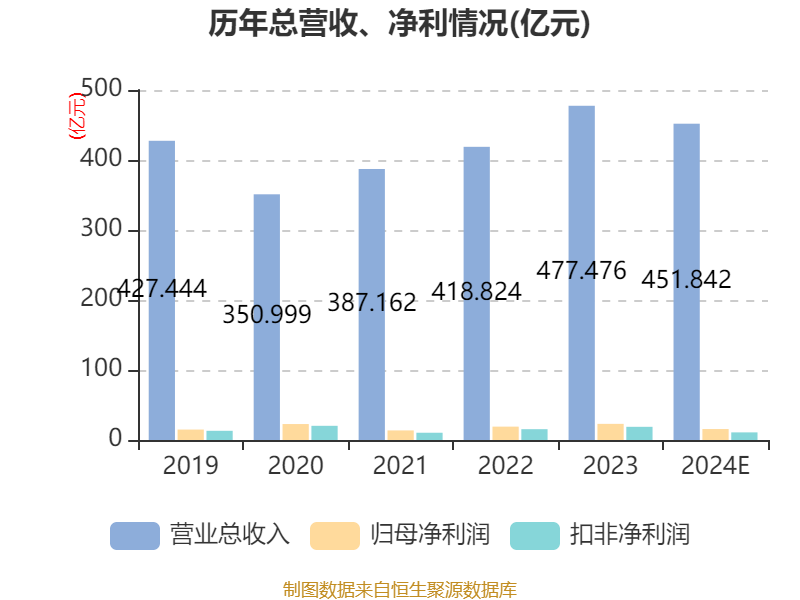
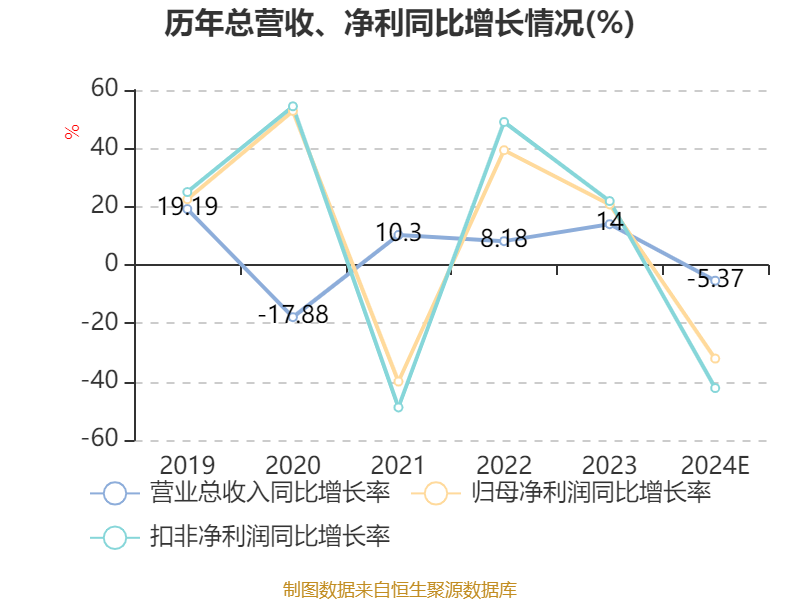
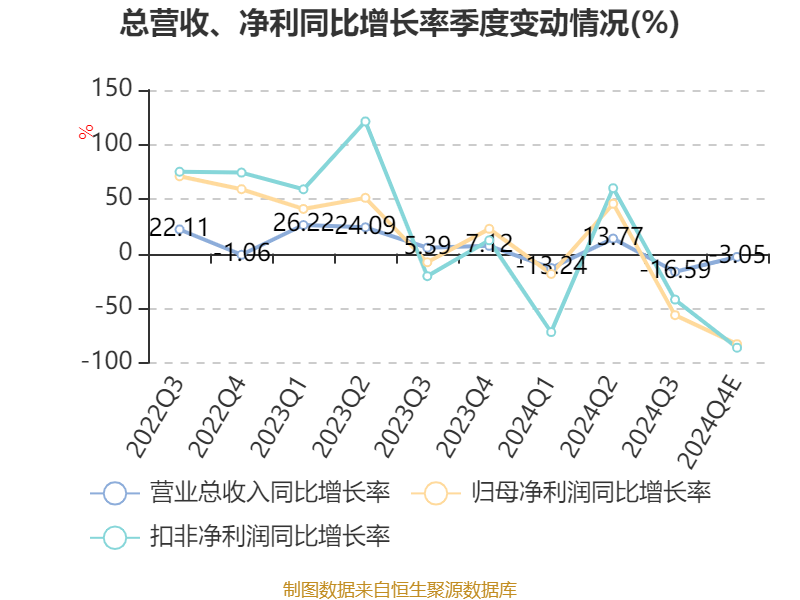
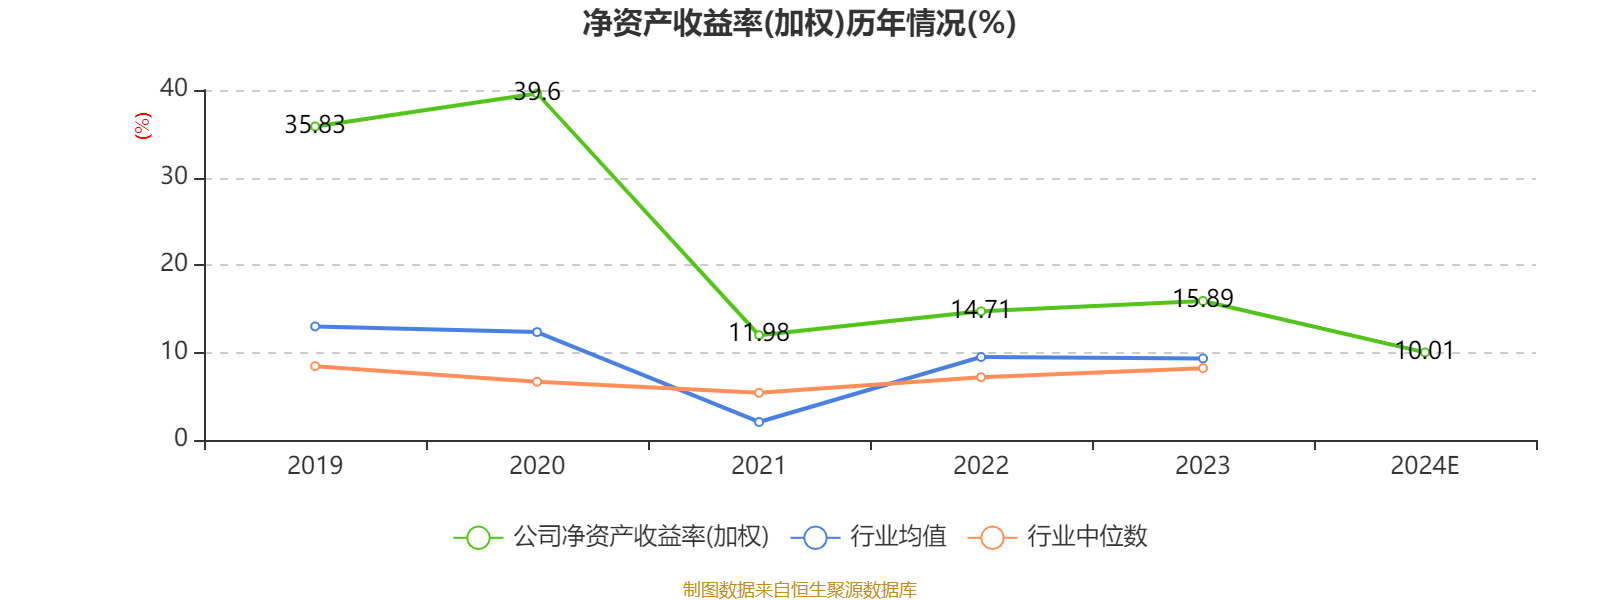
China Securities Intelligent Financial News Tianneng Co., Ltd. (688819) disclosed its 2024 performance express report on the evening of February 27, and the company achieved operating income of 45.184 billion yuan, a year-on-year decrease of 5.37%; the net profit attributable to the parent company was 1.565 billion yuan, a year-on-year decrease of 32.09%; deducted non-net profit of 1.089 billion yuan, a year-on-year decrease of 42.2%; The basic earnings per share was 1.61 yuan, and the weighted average return on equity was 10.01%. Based on the closing price on February 27, Tianneng shares currently have a price-to-earnings ratio (TTM) of about 18.7 times, a price-to-book ratio (LF) of about 1.84 times, and a price-to-sales ratio (TTM) of about 0.64 times.
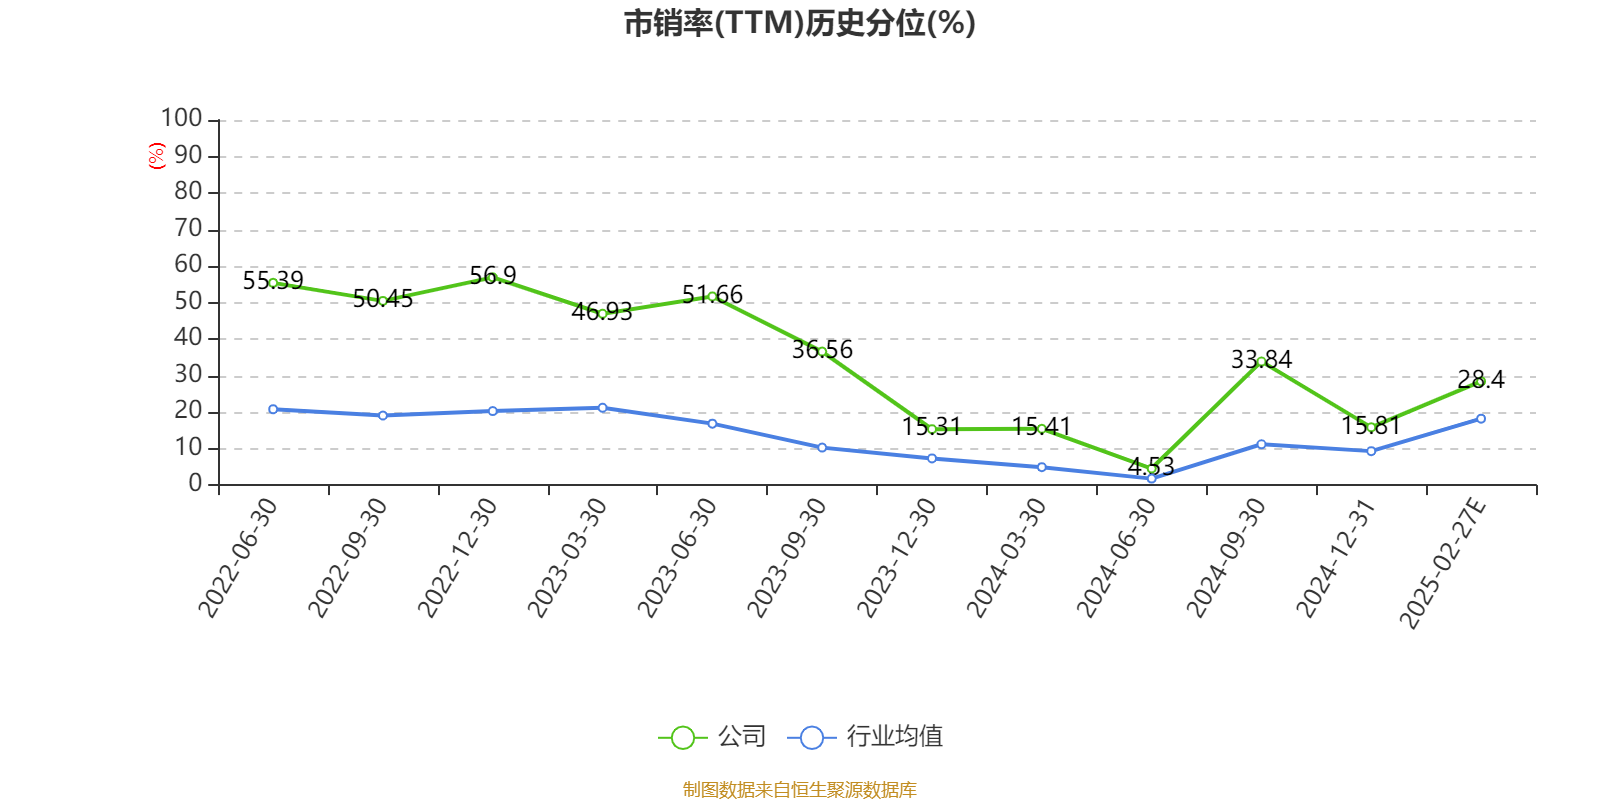
Based on the data of this disclosed performance report, the company's price-to-earnings ratio (TTM) chart in recent years is as follows:
According to the data, the company's main electric light vehicle power batteries, energy storage batteries, special vehicle power batteries, and automobile start-stop batteries.
During the reporting period, affected by changes in industry policies, the sales volume of lead-acid batteries declined, resulting in a decline in the company's operating income.
During the reporting period, affected by changes in industry policies, the sales volume of lead-acid batteries declined, and the gross profit margin was lower than the same period last year due to the sharp rise in the prices of raw materials for major products, resulting in a decrease in net profit attributable to shareholders of listed companies in the current period compared with the same period last year.
According to the data, the company's weighted average return on equity in 2024 will be 10.01%, down 5.88 percentage points from the same period last year.
Proofreading: Shen Nan
Indicator Annotation:
P/E ratio = total market capitalization / net profit. When the company loses money, the P/E ratio is negative, and it is not practical to use the P/E ratio for valuation, and the P/B ratio or P/B ratio is often used as a reference.
Price-to-book ratio = total market capitalization / net assets. The price-to-book ratio valuation method is mostly used for companies with large fluctuations in earnings and relatively stable net assets.
Price-to-sales ratio = total market capitalization / operating income. The price-to-sales ratio method is often used for growing companies that are losing money or making small profits.
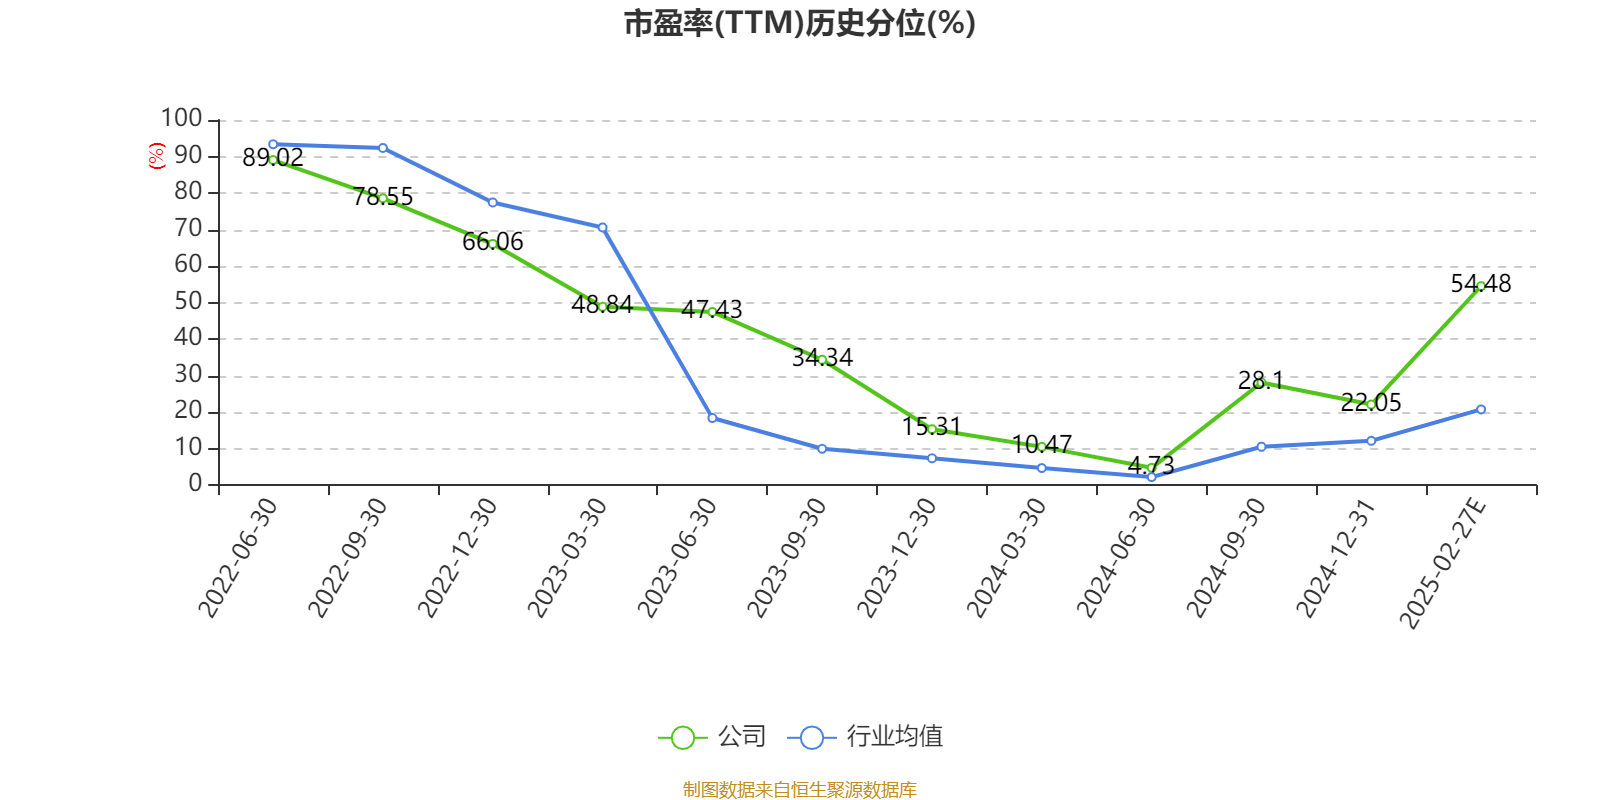
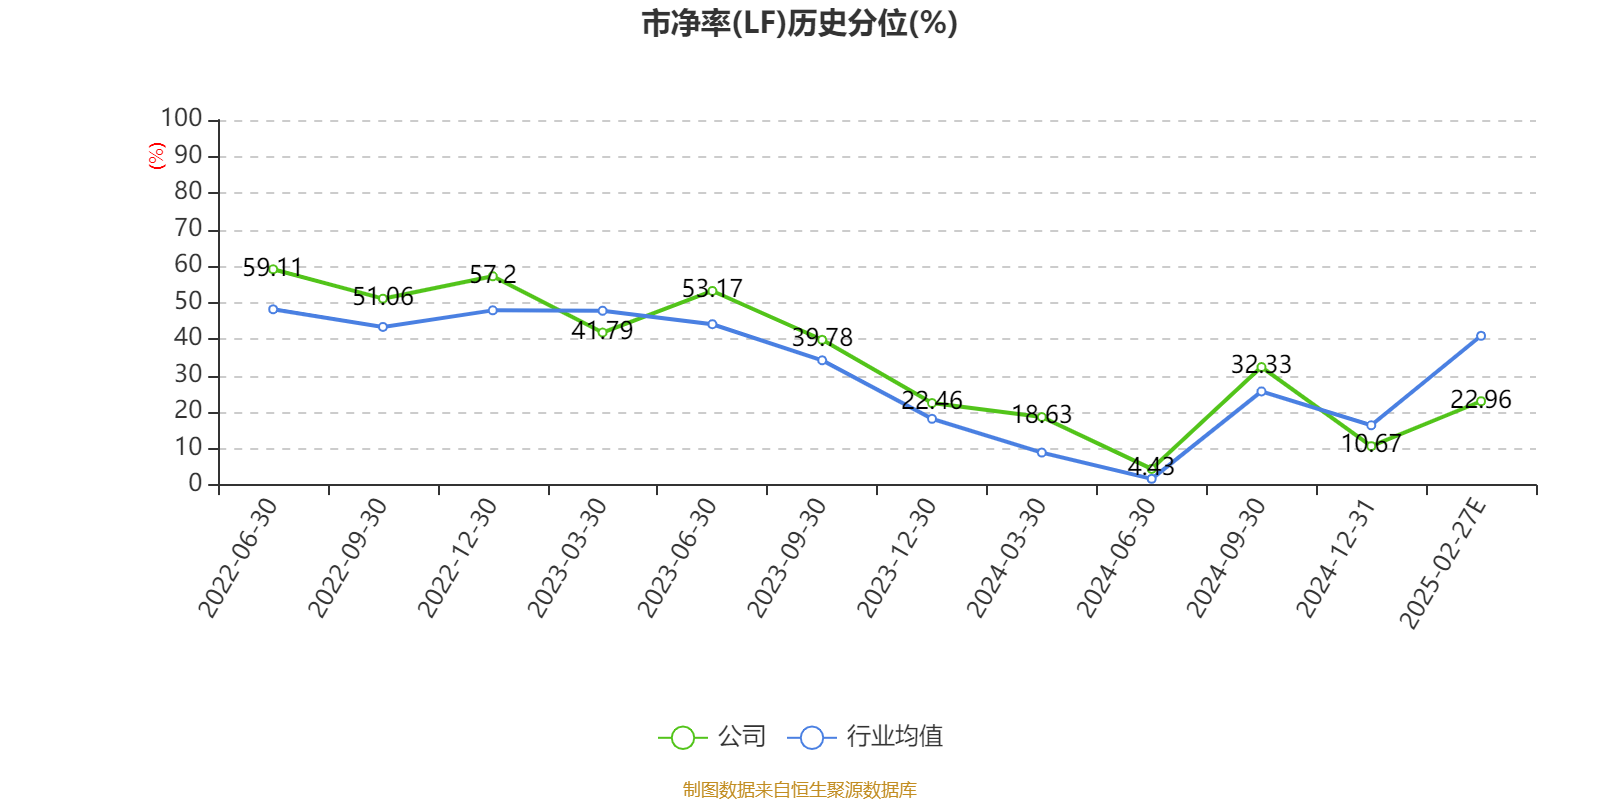
The price-to-earnings ratio and price-to-sales ratio in this article are calculated using the TTM method, that is, the data for the 12 months up to the latest financial report (including forecast). The price-to-book ratio is calculated using the LF method, that is, based on the latest financial report data. The quantile calculation range of the three is from the company's listing to the latest announcement date.
When the P/E ratio and price-to-book ratio are negative, the current quantile is not displayed, which will cause the line chart to be interrupted.
Ticker Name
Percentage Change
Inclusion Date


