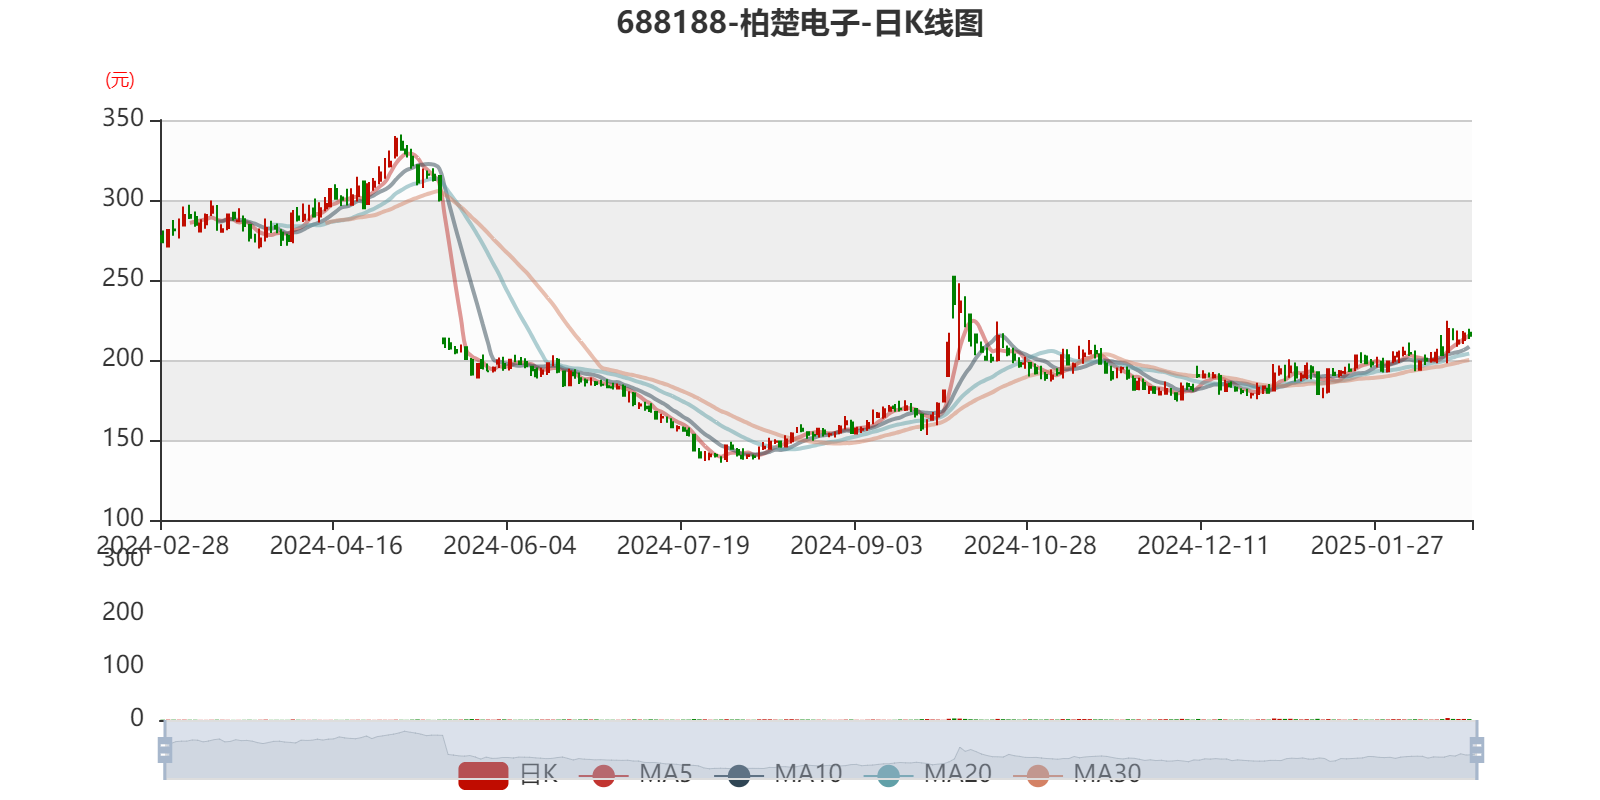
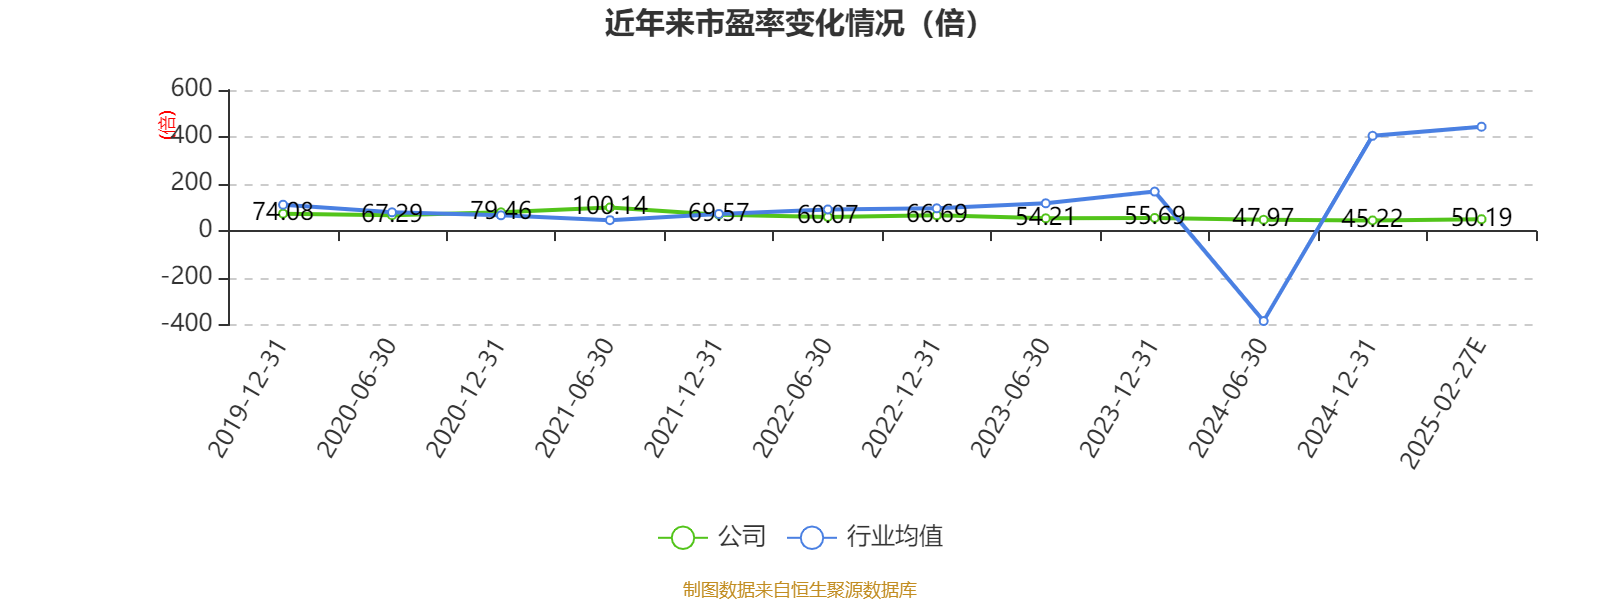
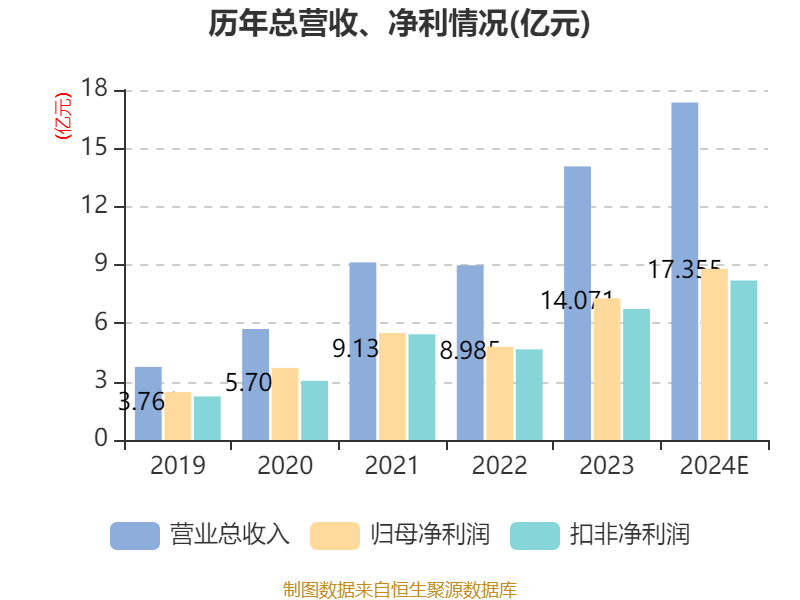
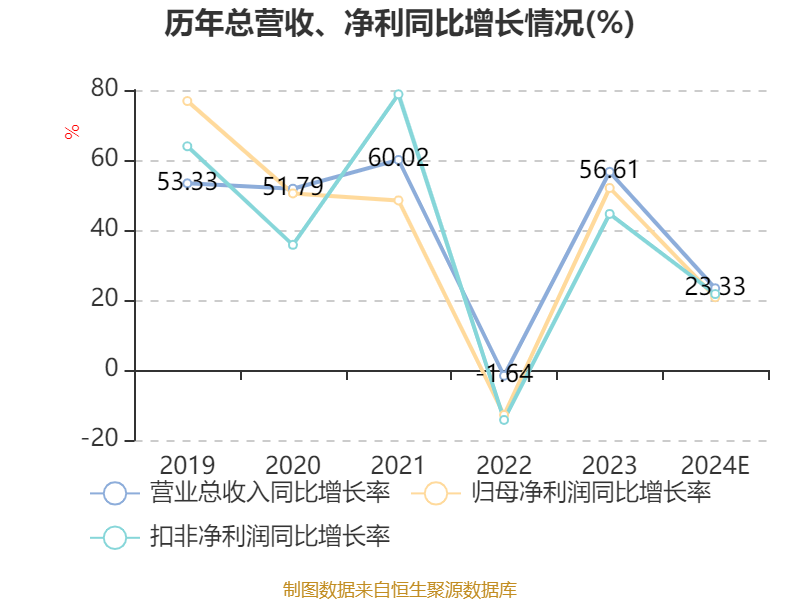
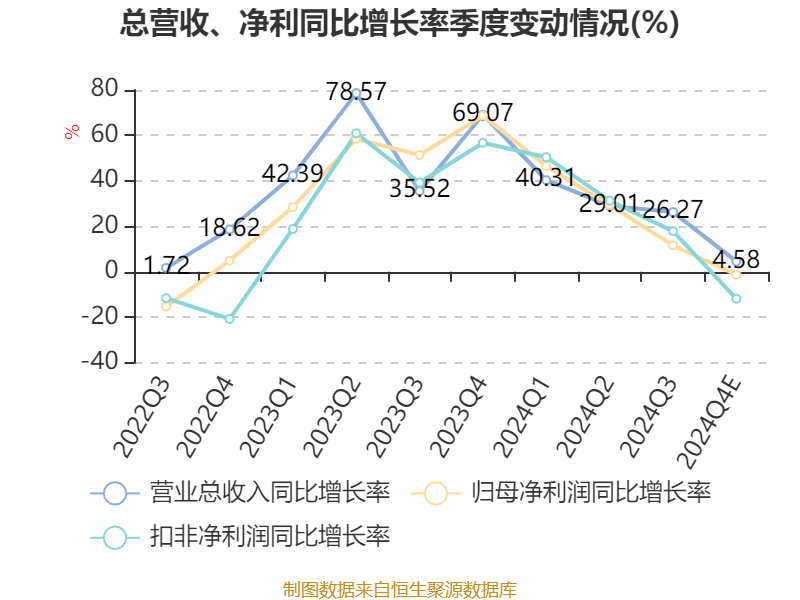
China Securities Intelligent Financial News Baichu Electronics (688188) disclosed its 2024 performance report on the evening of February 27, and the company achieved operating income of 1.735 billion yuan, a year-on-year increase of 23.33%; net profit attributable to the parent company was 880 million yuan, a year-on-year increase of 20.79%; deducted non-net profit of 820 million yuan, a year-on-year increase of 21.71%; The basic earnings per share was 4.29 yuan, and the weighted average return on equity was 17.01%. Based on the closing price on February 27, the current price-to-earnings ratio (TTM) of Baichu Electronics is about 50.19 times, the price-to-book ratio (LF) is about 8.4 times, and the price-to-sales ratio (TTM) is about 25.75 times.
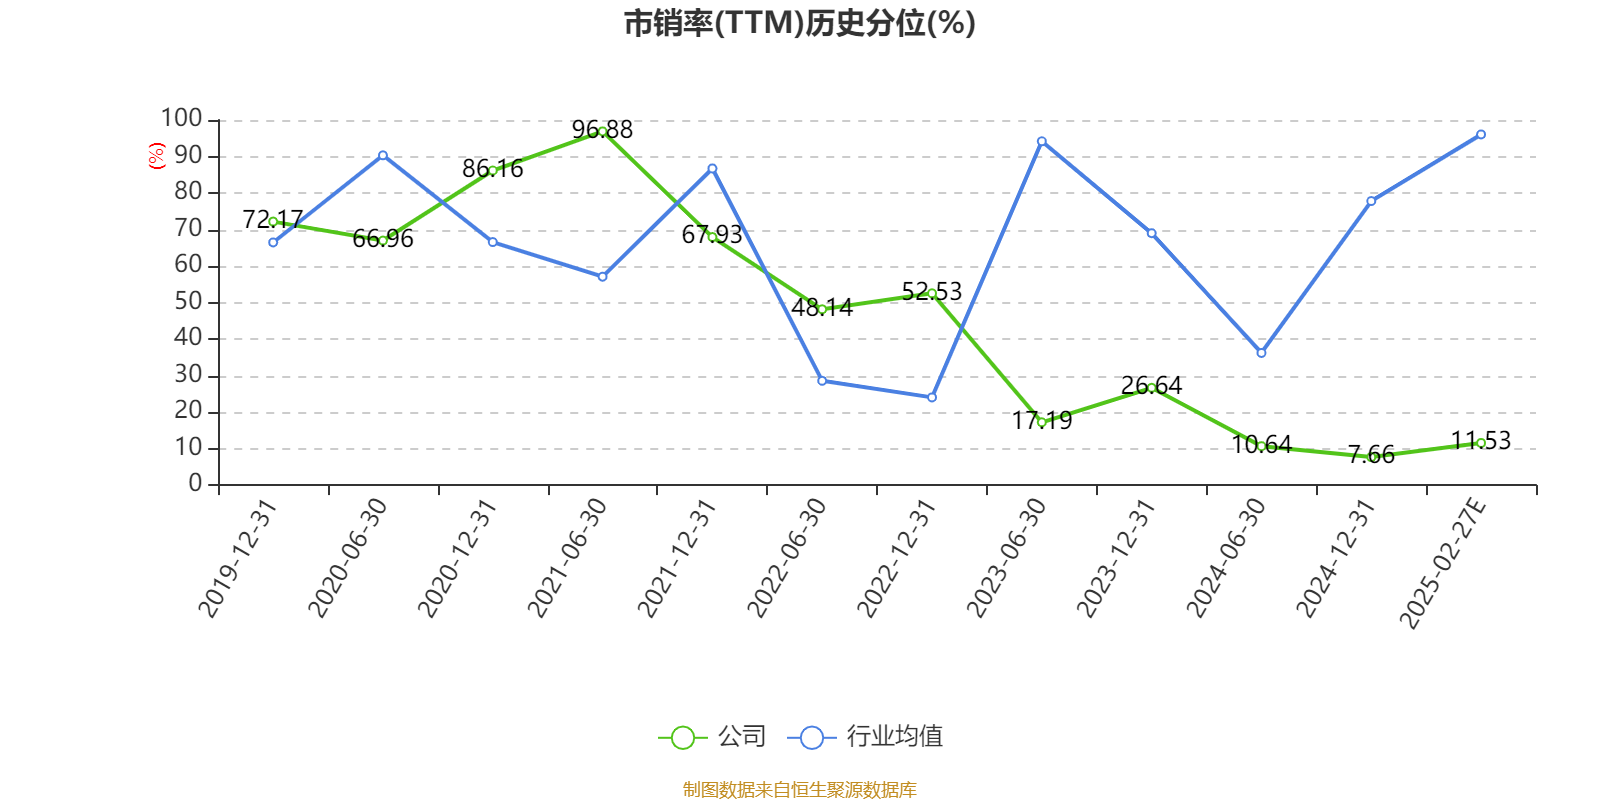
Based on the data of this disclosed performance report, the company's price-to-earnings ratio (TTM) chart in recent years is as follows:
According to the data, the company's main BCS100 follow-up control system, FSCUT1000-low-power board system, FSCUT2000-medium power board system, FSCUT3000-pipe cutting board system, FSCUT4000-full closed-loop board card system, FSCUT5000-pipe cutting bus system, FSCUT8000-ultra-high power bus system, high-precision visual positioning system, etc.
During the reporting period, the company continued to increase investment in technology research and development and market development, constantly explored new markets, and further optimized the product structure.
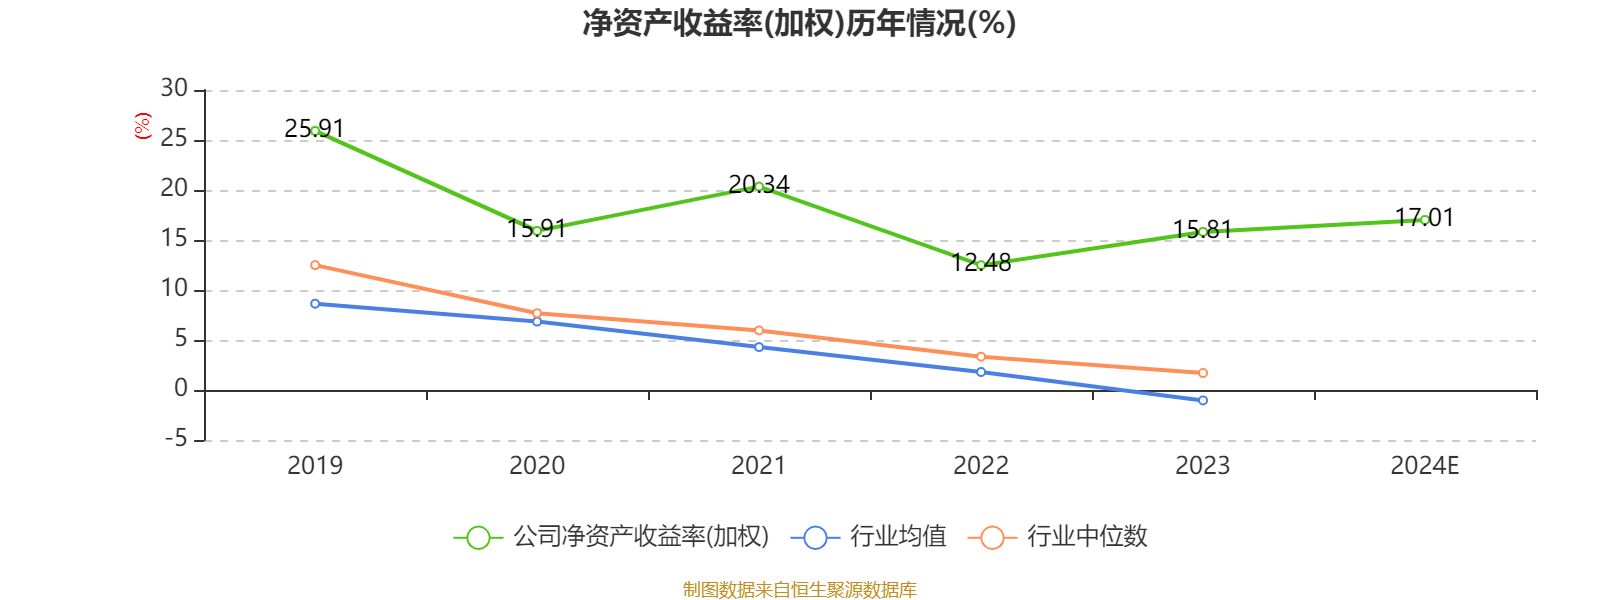
According to the data, the company's weighted average return on equity in 2024 will be 17.01%, an increase of 1.2 percentage points from the same period last year.
Proofreading: Shen Nan
Indicator Annotation:
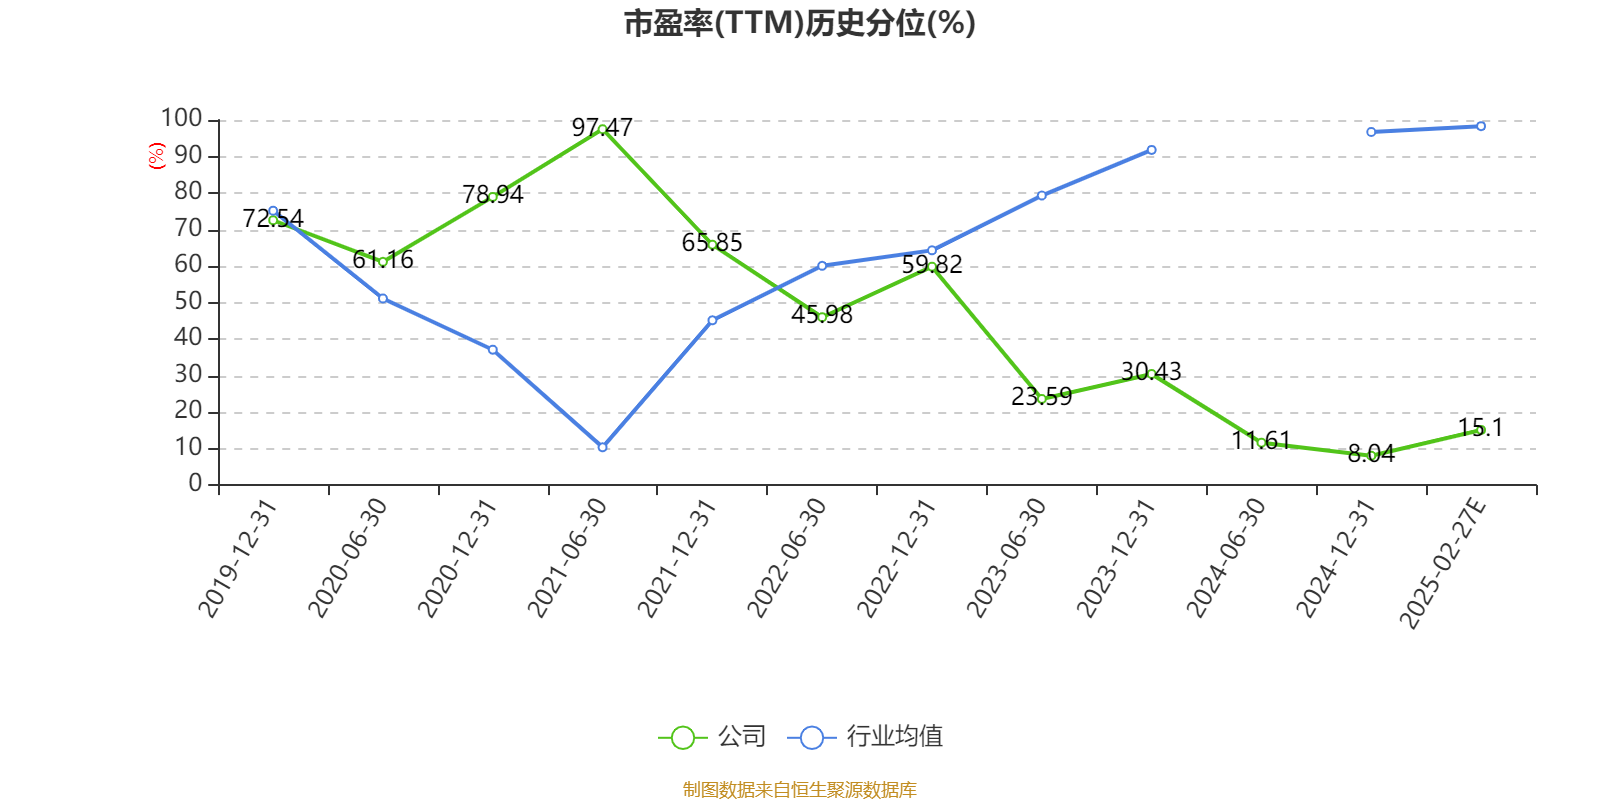
P/E ratio = total market capitalization / net profit. When the company loses money, the P/E ratio is negative, and it is not practical to use the P/E ratio for valuation, and the P/B ratio or P/B ratio is often used as a reference.
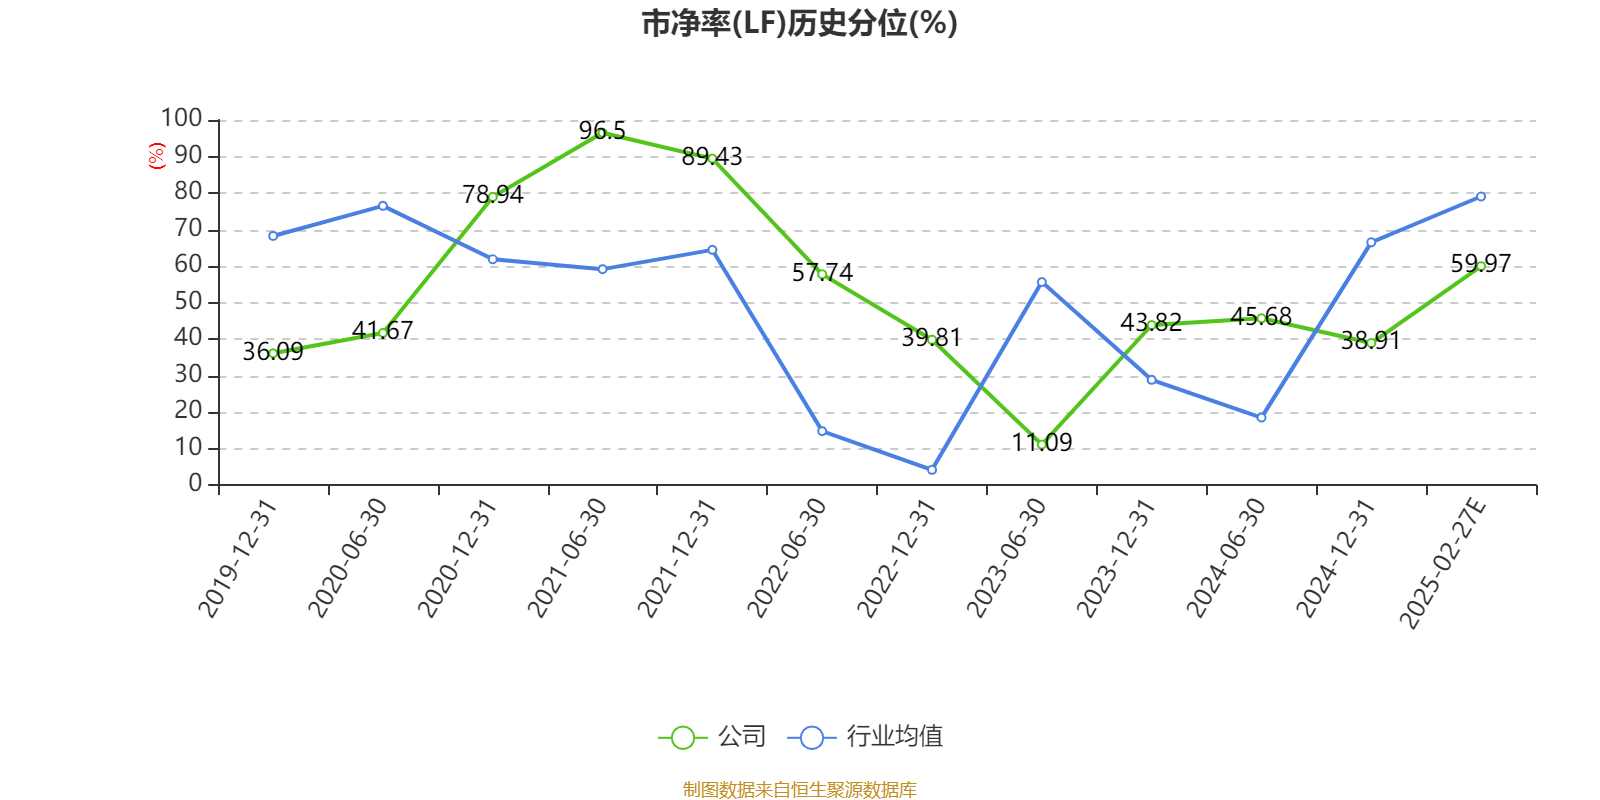
Price-to-book ratio = total market capitalization / net assets. The price-to-book ratio valuation method is mostly used for companies with large fluctuations in earnings and relatively stable net assets.
Price-to-sales ratio = total market capitalization / operating income. The price-to-sales ratio method is often used for growing companies that are losing money or making small profits.
The price-to-earnings ratio and price-to-sales ratio in this article are calculated using the TTM method, that is, the data for the 12 months up to the latest financial report (including forecast). The price-to-book ratio is calculated using the LF method, that is, based on the latest financial report data. The quantile calculation range of the three is from the company's listing to the latest announcement date.
When the P/E ratio and price-to-book ratio are negative, the current quantile is not displayed, which will cause the line chart to be interrupted.
Ticker Name
Percentage Change
Inclusion Date


