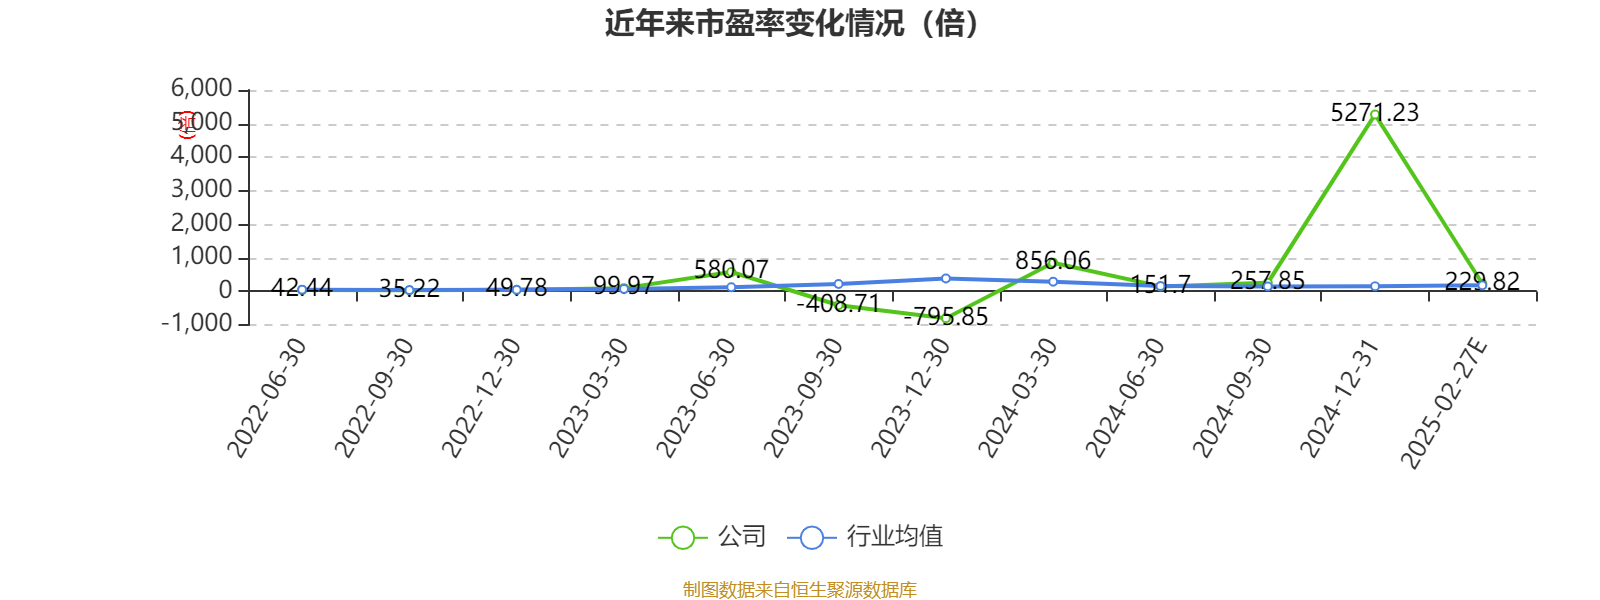
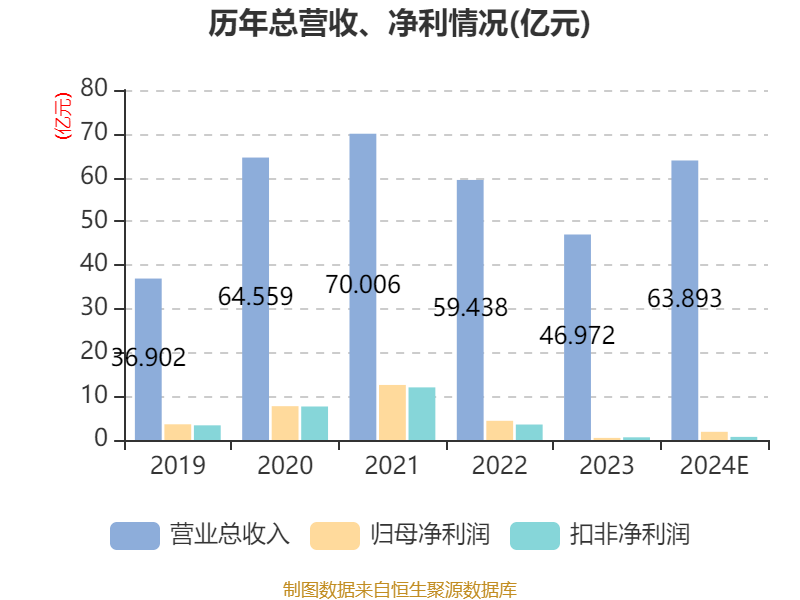
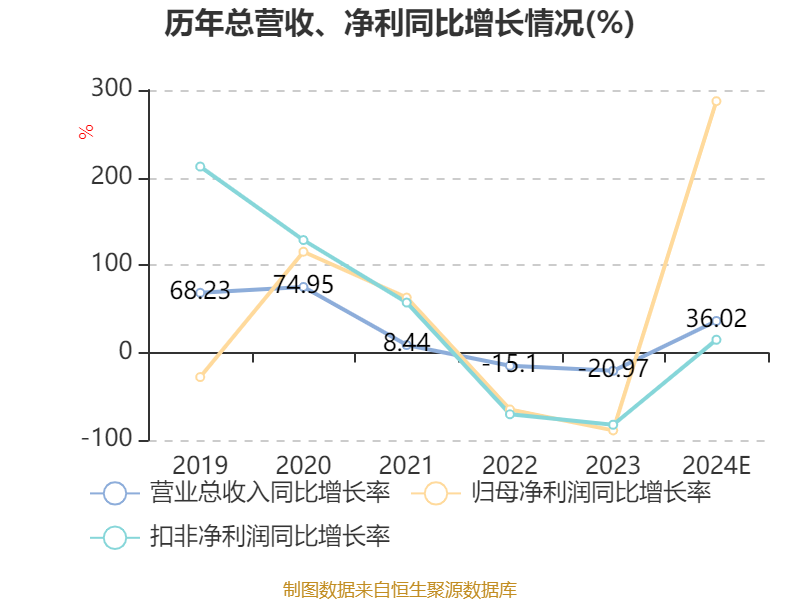
China Securities Intelligent Financial News Geke Micro (688728) disclosed its 2024 performance report on the evening of February 27, and the company achieved operating income of 6.389 billion yuan, a year-on-year increase of 36.02%; the net profit attributable to the parent company was 187 million yuan, a year-on-year increase of 287.24%; deducted non-net profit of 70.6749 million yuan, a year-on-year increase of 14.57%; The basic earnings per share was 0.07 yuan, and the weighted average return on equity was 2.39%. Based on the closing price on February 27, Geke Micro currently has a price-to-earnings ratio (TTM) of about 229.82 times, a price-to-book ratio (LF) of about 5.63 times, and a price-to-sales ratio (TTM) of about 7.15 times.
Based on the data of this disclosed performance report, the company's price-to-earnings ratio (TTM) chart in recent years is as follows:
According to the data, the company's main CMOS image sensors and display driver chips.
During the reporting period, the company's shipments of 13 million or more pixel products increased rapidly, and the operating income increased significantly. At the same time, the company's unique high-pixel single-chip integration technology was successfully implemented, and after the mass production of 32 million pixel products, 50 million pixel products were also mass-produced during the reporting period, and were recognized by many well-known consumer electronics brands at home and abroad.
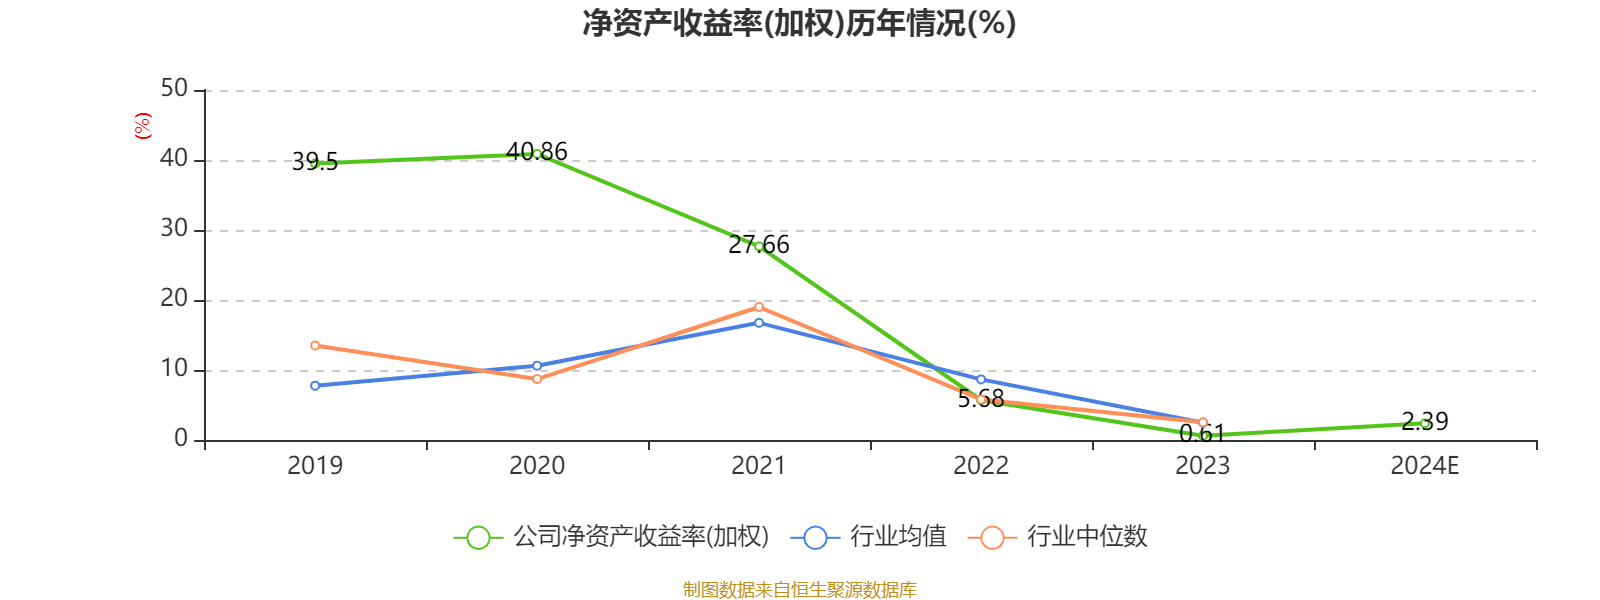
According to the data, the company's weighted average return on equity in 2024 will be 2.39%, an increase of 1.78 percentage points from the same period last year.
Indicator annotation:
P/E ratio = total market capitalization / net profit. When the company loses money, the P/E ratio is negative, and it is not practical to use the P/E ratio for valuation, and the P/B ratio or P/B ratio is often used as a reference.
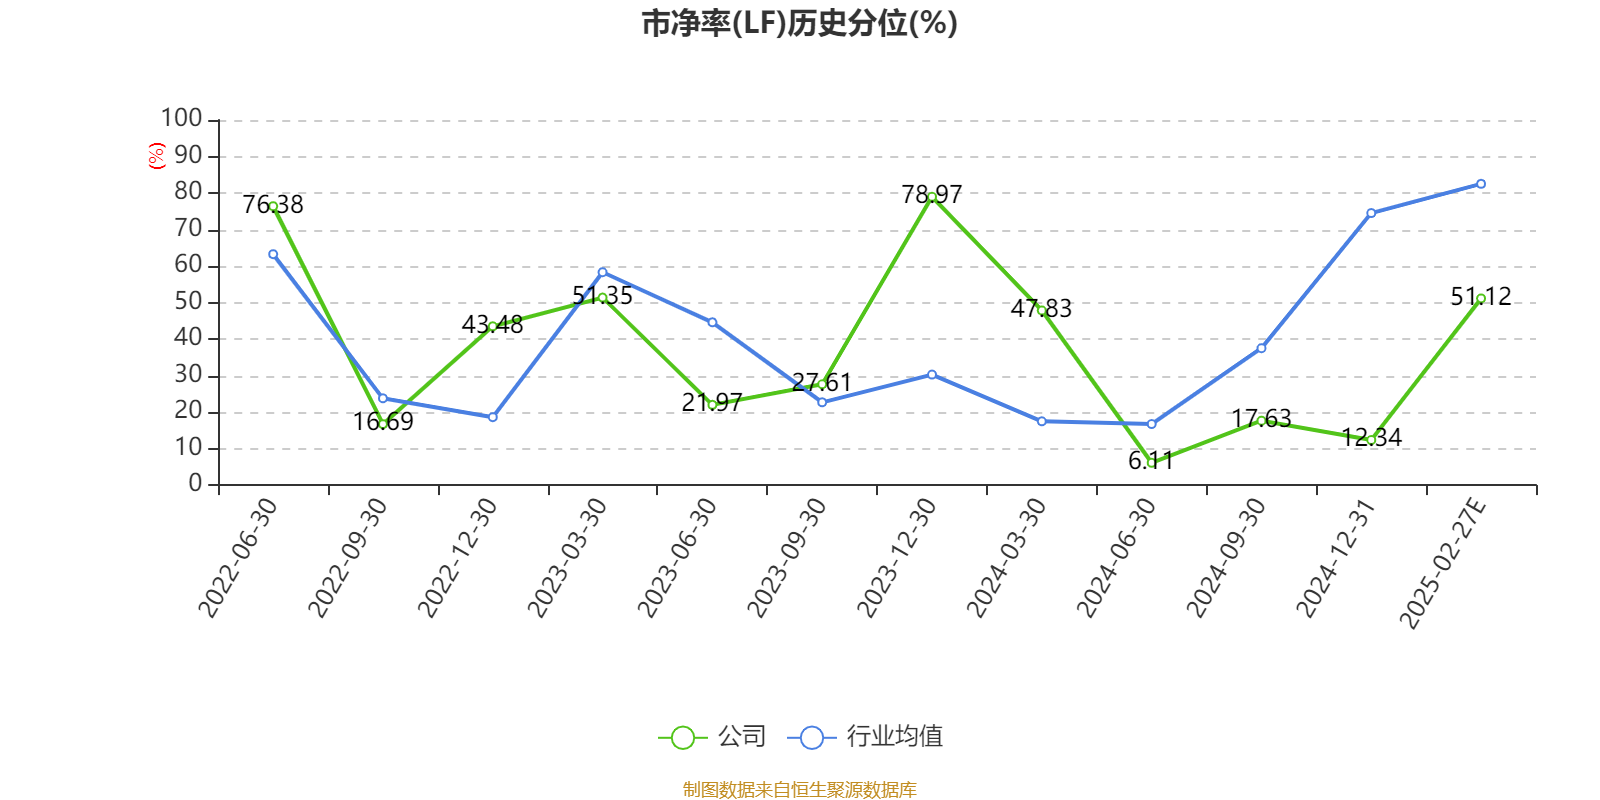
Price-to-book ratio = total market capitalization / net assets. The price-to-book ratio valuation method is mostly used for companies with large fluctuations in earnings and relatively stable net assets.
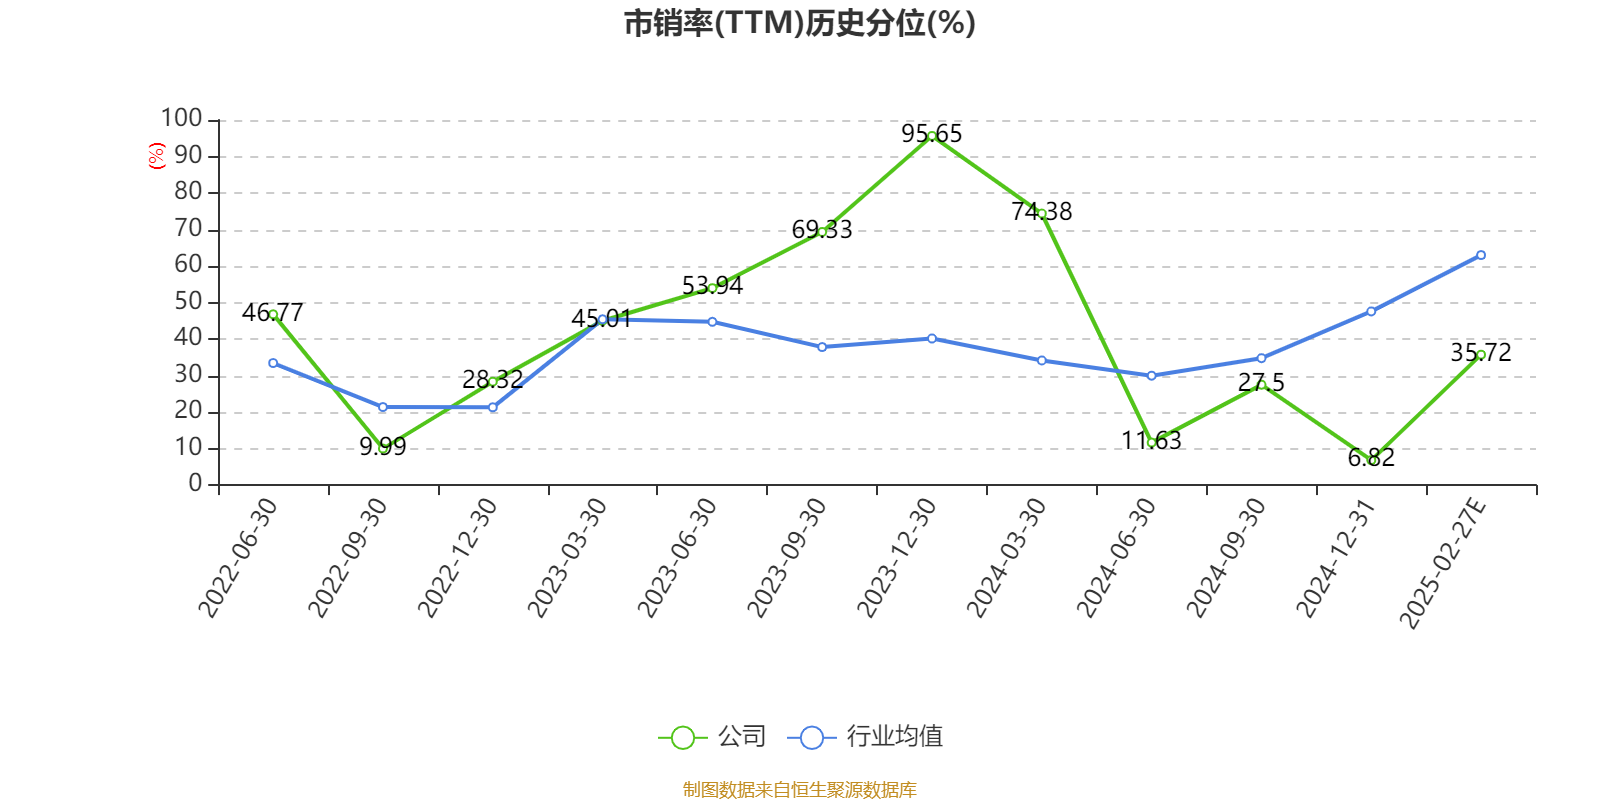
Price-to-sales ratio = total market capitalization / operating income. The price-to-sales ratio method is often used for growing companies that are losing money or making small profits.
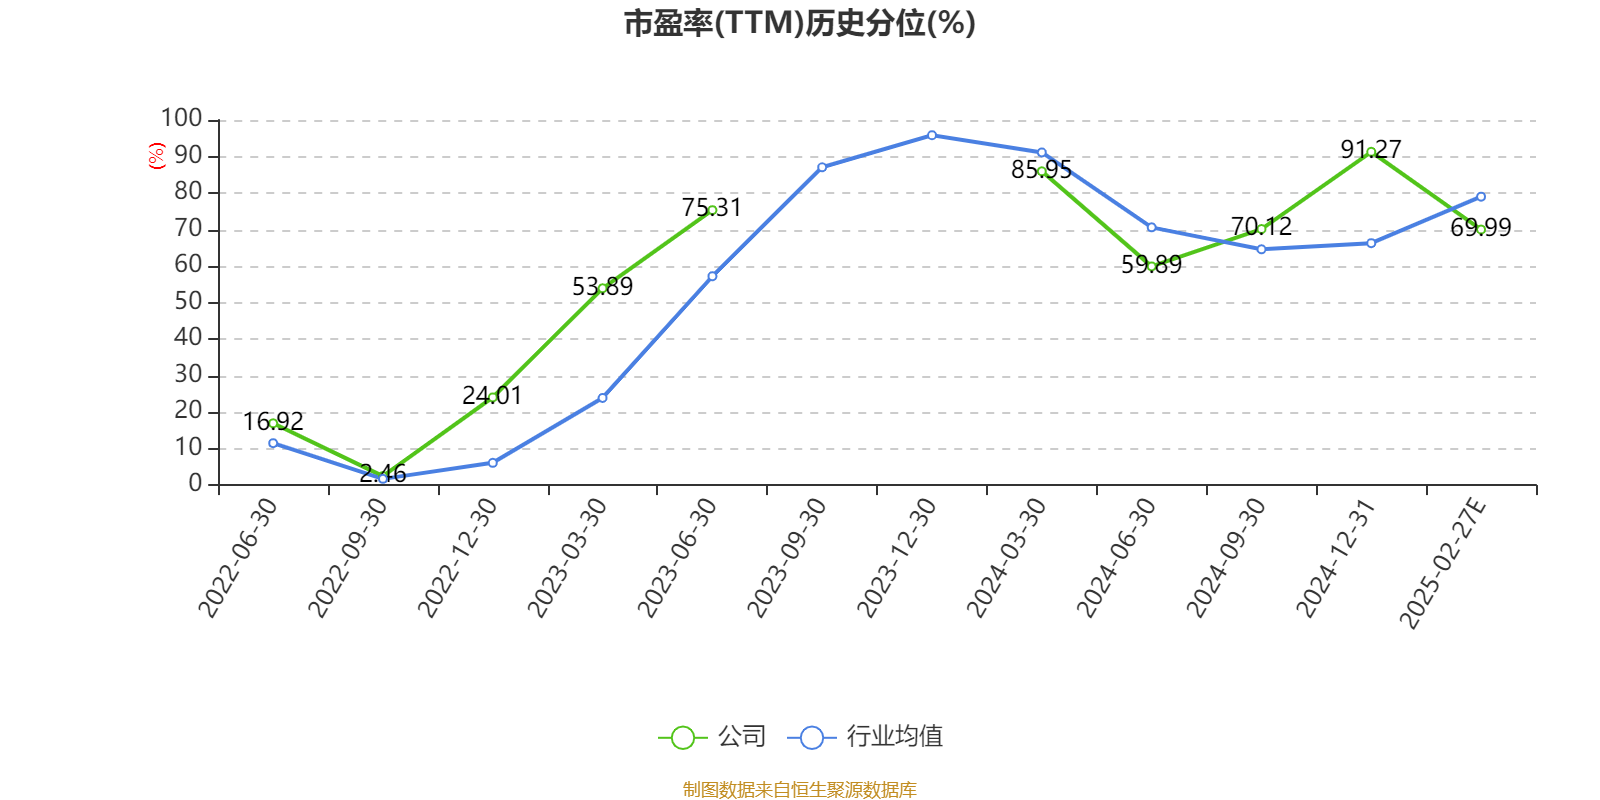
The price-to-earnings ratio and price-to-sales ratio in this article are calculated using the TTM method, that is, the data for the 12 months up to the latest financial report (including forecast). The price-to-book ratio is calculated using the LF method, that is, based on the latest financial report data. The quantile calculation range of the three is from the company's listing to the latest announcement date.
When the P/E ratio and price-to-book ratio are negative, the current quantile is not displayed, which will cause the line chart to be interrupted.
Ticker Name
Percentage Change
Inclusion Date


