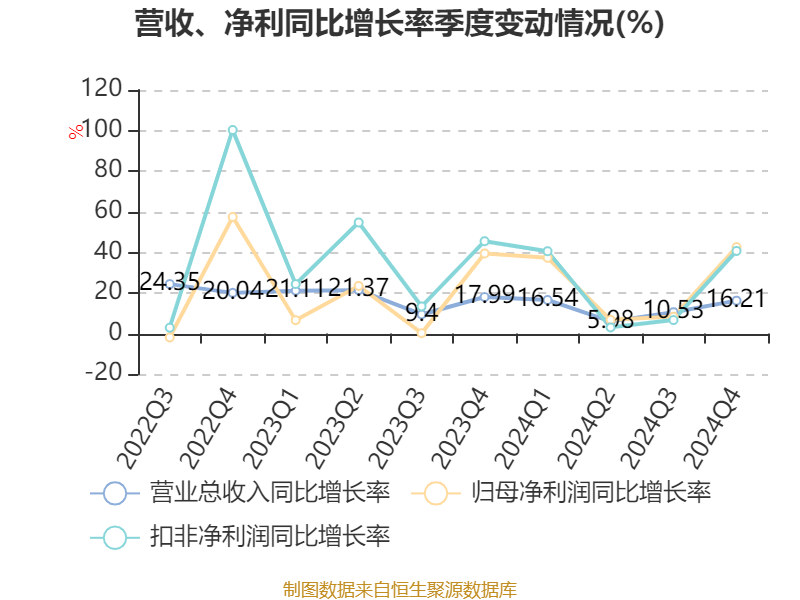
China Securities Intelligent Financial News Kingsoft Office (688111) disclosed its 2024 annual report on March 20. In 2024, the company will achieve a total operating income of 5.121 billion yuan, a year-on-year increase of 12.40%; the net profit attributable to the parent company was 1.645 billion yuan, a year-on-year increase of 24.84%; deducted non-net profit of 1.556 billion yuan, a year-on-year increase of 23.30%; the net cash flow from operating activities was 2.196 billion yuan, a year-on-year increase of 6.71%; During the reporting period, the basic earnings per share of Kingsoft Office was 3.56 yuan, and the weighted average return on equity was 15.51%. The company's 2024 annual distribution plan is: it intends to distribute 9 yuan (tax included) to all shareholders for every 10 shares.

Based on the closing price on March 19, the current price-to-earnings ratio (TTM) of Kingsoft Office is about 95.34 times, the price-to-book ratio (LF) is about 13.81 times, and the price-to-sales ratio (TTM) is about 30.63 times.


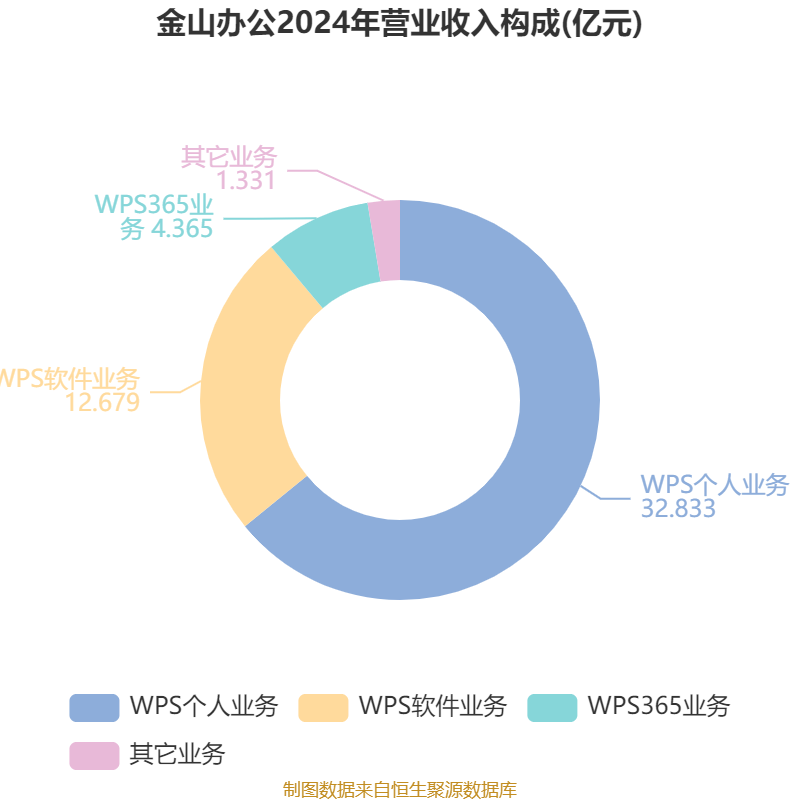
According to the data, the company's WPS personal version, Kingsoft Docs, WPSAI office assistant, WPS365, WPSAI enterprise version, WPSAI government edition.


According to the data, the company's weighted average return on equity in 2024 will be 15.51%, an increase of 1.33 percentage points from the same period last year. The company's return on invested capital in 2024 will be 15.14%, an increase of 2.28 percentage points from the same period last year.


As of 2024, the company's net cash flow from operating activities will be 2.196 billion yuan, a year-on-year increase of 6.71%; Net cash flow from financing activities decreased by 116 million yuan to RMB501 million, and net cash flow from investing activities was RMB4.274 billion, compared to RMB5.21 billion in the same period last year.


In terms of major changes in assets, as of the end of 2024, the company's other non-current assets increased by 279.62% from the end of the previous year, accounting for 32.48 percentage points of the company's total assets, monetary funds decreased by 74.18% from the end of the previous year, accounting for 19.25 percentage points of the company's total assets, the total trading financial assets decreased by 46.16% from the end of the previous year, accounting for 9.7 percentage points of the company's total assets, and the non-current assets maturing within one year decreased by 93.3% from the end of the previous year. The proportion of the company's total assets decreased by 7.78 percentage points.

In terms of major changes in liabilities, as of the end of 2024, the company's other non-current liabilities increased by 53.98% from the end of the previous year, accounting for 1.54 percentage points of the company's total assets, notes payable and accounts payable decreased by 1.68% from the end of the previous year, accounting for 0.44 percentage points of the company's total assets, the total long-term payables decreased by 100% from the end of the previous year, accounting for 0.41 percentage points of the company's total assets, and the compensation payable to employees increased by 3.77% from the end of the previous year. The proportion of the company's total assets decreased by 0.29 percentage points.

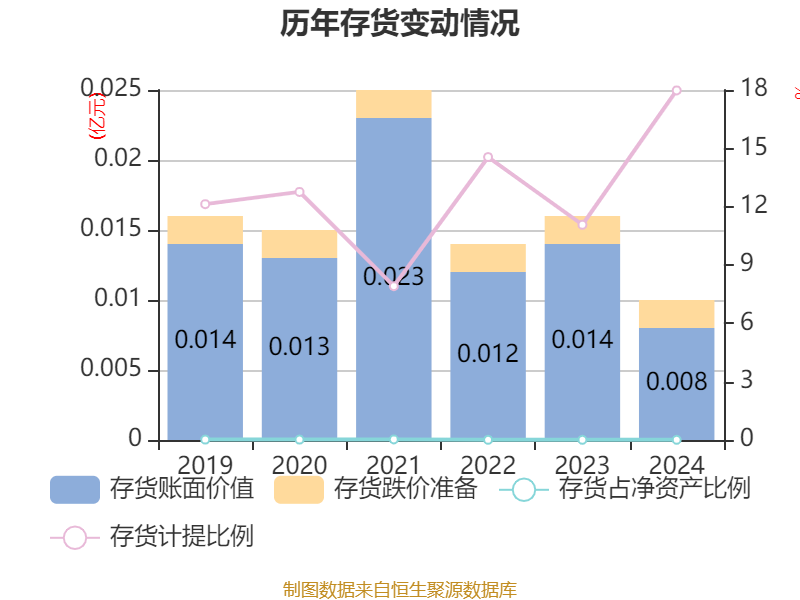
From the perspective of inventory changes, as of the end of 2024, the book value of the company's inventory was 802,000 yuan, accounting for 0.01% of net assets, a decrease of 610,800 yuan from the end of the previous year. Among them, the provision for inventory decline was 175,800 yuan, and the provision ratio was 17.98%.

In 2024, the company's R&D investment will be 1.696 billion yuan, a year-on-year increase of 15.16%; R&D investment accounted for 33.11% of operating income, an increase of 0.79 percentage points over the same period last year.


In 2024, the company has a current ratio of 1.76 and a quick ratio of 1.76.


According to the annual report, among the top ten circulating shareholders of the company at the end of 2024, the new shareholder is E Fund CSI 300 exchange-traded open-ended index initiated securities investment fund, replacing Chinese Life Insurance Co., Ltd. - traditional - general insurance product - 005L-CT001 Shanghai at the end of the third quarter. In terms of specific shareholding ratios, the holdings of Huatai Pinebridge CSI 300 Exchange-traded Open-ended Index Securities Investment Fund have increased, while the holdings of Hong Kong Securities Clearing Co., Ltd., ChinaAMC SSE Science and Technology Innovation Board 50 Component Exchange-traded Open-ended Index Securities Investment Fund, E Fund SSE Science and Technology Innovation Board 50 Component Exchange-traded Open-ended Index Securities Investment Fund, and SSE 50 Exchange-traded Open-ended Index Securities Investment Fund have decreased.
| name | The number of outstanding shares held (10,000 shares) | accounted for the proportion of total share capital (%) | , and the change ratio (percentage points) |
|---|---|---|---|
| Kingsoft WPS Corporation Limited | 23838.74 | 51.5403 | remained unchanged |
| Tianjin Qiwen Wuwei Enterprise Management Consulting Partnership (Limited Partnership) | 2196.37 | 4.7486 | unchanged |
| Hong Kong Securities Clearing Co., Ltd | .1524.98 | 3.297-0.858 | |
| ChinaAMC SSE STAR Market 50 Component Exchange-traded Open-ended Index Securities Investment Fund | 1511.09 | 3.267-0.615 | |
| E Fund SSE STAR Market 50 Component Exchange-traded Open-ended Index Securities Investment Fund | 967.8 | 2.0924-0.258 | |
| Tianjin Qiwen Siwei Enterprise Management Consulting Partnership (Limited Partnership) | 460.5 | 0.9956 | unchanged |
| SSE 50 ETF | 437 | 0.9448-0.014 | |
| Huatai Pineapple CSI 300 ETF Securities Investment Fund | 410.68 | 0.8879 | 0.043 |
| Tianjin Qiwen Qiwei Enterprise Management Consulting Partnership (Limited Partnership) | 364.28 | 0.7875 | unchanged |
| E Fund CSI 300 Exchange-Traded Open-ended Index Initiation Securities Investment Fund | 277.52 | 0.6 | New |

Indicator annotation:
P/E ratio = total market capitalization / net profit. When the company loses money, the P/E ratio is negative, and it is not practical to use the P/E ratio for valuation, and the P/B ratio or P/B ratio is often used as a reference.
Price-to-book ratio = total market capitalization / net assets. The price-to-book ratio valuation method is mostly used for companies with large fluctuations in earnings and relatively stable net assets.
Price-to-sales ratio = total market capitalization / operating income. The price-to-sales ratio method is often used for growing companies that are losing money or making small profits.
The price-to-earnings ratio and price-to-sales ratio in this article are calculated using the TTM method, that is, the data for the 12 months up to the latest financial report (including forecast). The price-to-book ratio is calculated using the LF method, that is, based on the latest financial report data. The quantile calculation range of the three is from the company's listing to the latest announcement date.
When the P/E ratio and price-to-book ratio are negative, the current quantile is not displayed, which will cause the line chart to be interrupted.
Ticker Name
Percentage Change
Inclusion Date


