
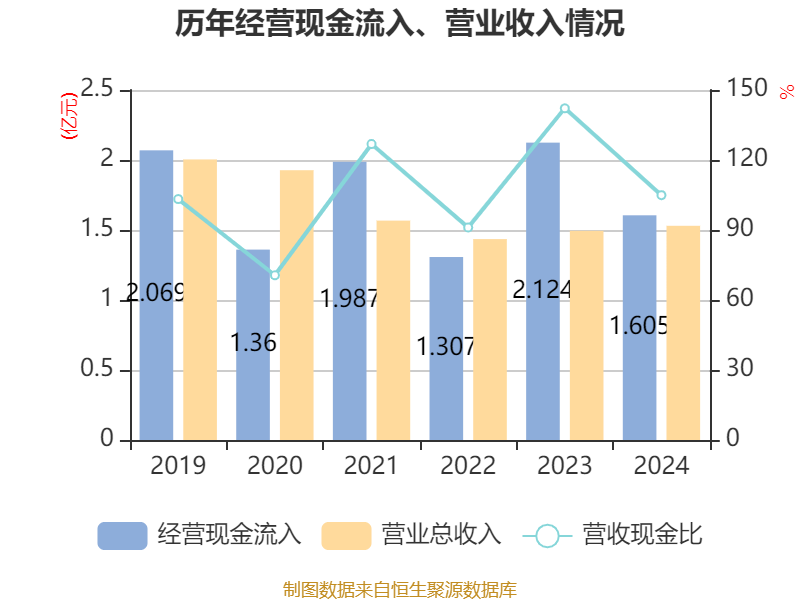
China Securities Intelligent Financial News Xingtu Xinke (688081) disclosed its 2024 annual report on March 29. In 2024, the company will achieve a total operating income of 153 million yuan, a year-on-year increase of 2.38%; The net profit loss attributable to the parent company was 80.6638 million yuan, compared with a loss of 67.936 million yuan in the same period last year, the non-net profit loss was 83.5527 million yuan, a loss of 69.8005 million yuan in the same period last year, the net cash flow from operating activities was -25.8897 million yuan, compared with -29.8814 million yuan in the same period last year, and the basic earnings per share of Xingtu Xinke was -0.79 yuan, and the weighted average return on equity was -16.88% during the reporting period.

Based on the closing price on March 28, Xingtu Xinke's current price-to-earnings ratio (TTM) is about -25.65 times, the price-to-book ratio (LF) is about 4.75 times, and the price-to-sales ratio (TTM) is about 13.52 times.


According to the data, the company's main business is cloud visual command, mobile equipment, cooperative operations, reconnaissance and perception, unmanned weapons, command center 6 categories of systems and equipment, information aggregation, network transmission, media storage, intelligent analysis, video services, and computing power distribution.


According to the data, the company's weighted average return on equity in 2024 will be -16.88%, down 4.76 percentage points from the same period last year. The company's return on invested capital in 2024 will be -16.37%, down 1.73 percentage points from the same period last year.


As of 2024, the company's net cash flow from operating activities was -25.8897 million yuan, an increase of 3.9917 million yuan year-on-year, net cash flow from financing activities was 36.9755 million yuan, an increase of 19.9511 million yuan year-on-year, and net cash flow from investment activities was 4.473 million yuan, compared with -20.8427 million yuan in the same period last year.


In terms of major changes in assets, as of the end of 2024, the company's notes receivable and accounts receivable increased by 1.39% from the end of the previous year, accounting for 2.62 percentage points of the company's total assets, monetary funds increased by 8.69% from the end of the previous year, accounting for 2.55 percentage points of the company's total assets, development expenditure decreased by 100% from the end of the previous year, accounting for 1.66 percentage points of the company's total assets, and the total trading financial assets decreased by 100% from the end of the previous year. The proportion of the company's total assets decreased by 1.6 percentage points.

In terms of major changes in liabilities, as of the end of 2024, the company's short-term borrowings increased by 249.93% from the end of the previous year, accounting for 8.59 percentage points of the company's total assets, notes payable and accounts payable increased by 10.61% from the end of the previous year, accounting for 1.67 percentage points of the company's total assets, taxes payable increased by 754% from the end of the previous year, accounting for 0.83 percentage points of the company's total assets, and contract liabilities decreased by 48.43% from the end of the previous year. The proportion of the company's total assets decreased by 0.77 percentage points.

From the perspective of inventory changes, as of the end of 2024, the book value of the company's inventory was 65.3931 million yuan, accounting for 15% of net assets, a decrease of 11.0376 million yuan from the end of the previous year. Among them, the provision for inventory decline was 19.3456 million yuan, and the provision ratio was 22.83%.


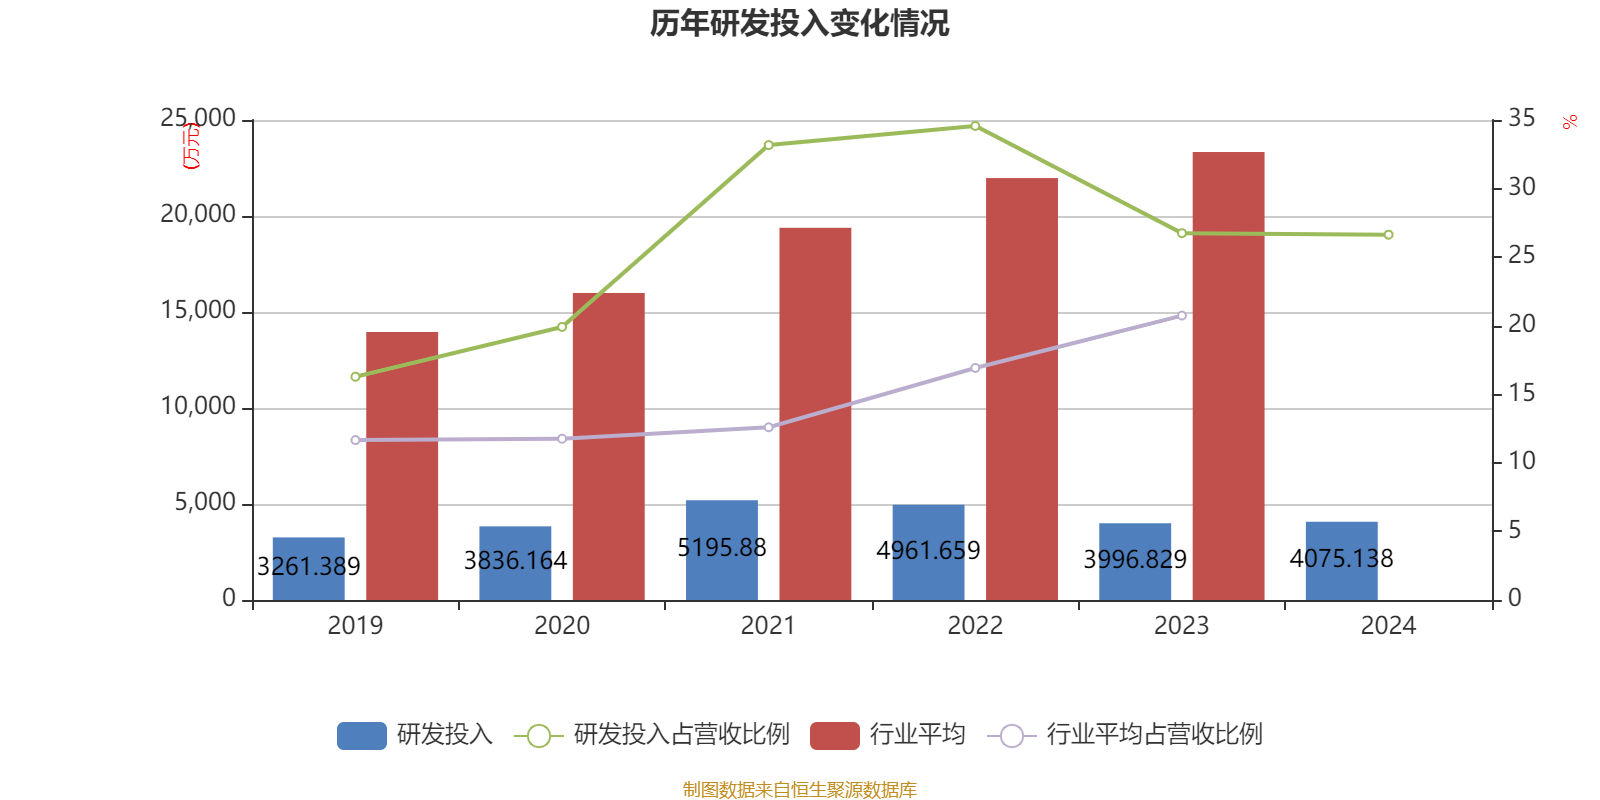
For the whole year of 2024, the company's R&D investment will be 40.7514 million yuan, a year-on-year increase of 1.96%; R&D investment accounted for 26.64% of operating income, down 0.11 percentage points from the same period last year. In addition, the capitalization rate of the company's R&D investment for the year was 12.55%.


In 2024, the company has a current ratio of 2.61 and a quick ratio of 2.2.


According to the annual report, among the top ten circulating shareholders of the company at the end of 2024, the new shareholders are Panyao New Power Private Securities Investment Fund, Jiangsu Fuhua Financial Advisory Services Co., Ltd., Chongqing Road and Bridge Co., Ltd., and Huijin Mingyue No. 1 Private Securities Investment Fund, replacing Shanghai Linxin Investment Management Co., Ltd., Zhang Wei, Yu Dengyu, and Xu Tianbing at the end of the third quarter. In terms of specific shareholding ratio, Wang Zhixing's shareholding has increased, and Wang Weijun's shareholding has decreased.
| shareholder name | number of shares outstanding(10,000 shares). | proportion of total share capital (%) | change ratio (percentage points) |
|---|---|---|---|
| Cheng Jiaming | 4040.81 | 39.2158 | unchanged |
| Wuhan Xingtu Investment Co., Ltd | .1181.83 | 11.4696 | |
| Unchanged Chen Aimin | 325.58 | 3.1597 | unchanged |
| Panyao New Power Private Placement Securities Investment Fund | 166.62 | 1.617 | New Jiangsu |
| Fuhua Financial Advisory Services Co., Ltd | .104.35 | 1.0126 | New Entrant |
| Chongqing Road and Bridge Co., Ltd.100 | 0.9704 | new | |
| Yu Yuming | 87.04 | 0.8447 | unchanged |
| Wang Zhixing | 81.49 | 0.7909 | 0.123 |
| Huijin Mingyue No. 1 Private Securities Investment Fund | 80.58 | 0.782 | Xinjin |
| Wang Weijun | 80.56 | 0.7818-0.024 |

Proofreading: Sun Ping
Indicator Annotation:
P/E ratio = total market capitalization / net profit. When the company loses money, the P/E ratio is negative, and it is not practical to use the P/E ratio for valuation, and the P/B ratio or P/B ratio is often used as a reference.
Price-to-book ratio = total market capitalization / net assets. The price-to-book ratio valuation method is mostly used for companies with large fluctuations in earnings and relatively stable net assets.
Price-to-sales ratio = total market capitalization / operating income. The price-to-sales ratio method is often used for growing companies that are losing money or making small profits.
The price-to-earnings ratio and price-to-sales ratio in this article are calculated using the TTM method, that is, the data for the 12 months up to the latest financial report (including forecast). The price-to-book ratio is calculated using the LF method, that is, based on the latest financial report data. The quantile calculation range of the three is from the company's listing to the latest announcement date.
When the P/E ratio and price-to-book ratio are negative, the current quantile is not displayed, which will cause the line chart to be interrupted.
Ticker Name
Percentage Change
Inclusion Date


