
China Securities Intelligent Financial News Jinling Pharmaceutical (000919) disclosed its 2024 annual report on March 29. In 2024, the company will achieve a total operating income of 3.281 billion yuan, a year-on-year increase of 2.74%; the net profit attributable to the parent company was 40.4098 million yuan, a year-on-year decrease of 61.95%; deducted non-net profit of 48.9222 million yuan, a year-on-year decrease of 40.44%; the net cash flow from operating activities was 154 million yuan, down 27.28% year-on-year; During the reporting period, Jinling Pharmaceutical's basic earnings per share was 0.0682 yuan, and the weighted average return on equity was 1.09%. The company's 2024 annual distribution plan is: it is planned to distribute 1 yuan (tax included) to all shareholders for every 10 shares.

Based on the closing price on March 28, Jinling Pharmaceutical's current price-to-earnings ratio (TTM) is about 105.26 times, the price-to-book ratio (LF) is about 1.12 times, and the price-to-sales ratio (TTM) is about 1.3 times.


According to the data, the company's main business is the manufacture of drugs and medical devices and medical care services.


According to the data, the company's weighted average return on equity in 2024 will be 1.09%, down 2.22 percentage points from the same period last year. The company's return on invested capital in 2024 will be 0.17%, down 2.17 percentage points from the same period last year.


As of 2024, the company's net cash flow from operating activities will be 154 million yuan, a year-on-year decrease of 27.28%; Net cash flow from financing activities was $806 million, an increase of $0.85 billion year-on-year, and net cash flow from investment activities was -$718 million, compared to -$450 million in the same period last year.


In terms of major changes in assets, as of the end of 2024, the total trading financial assets of the company increased by 201.91% from the end of the previous year, accounting for 7.34 percentage points of the company's total assets, fixed assets decreased by 1.42% from the end of the previous year, accounting for 2.86 percentage points of the company's total assets, non-current assets due within one year decreased by 42.23% from the end of the previous year, accounting for 2.49 percentage points of the company's total assets, and goodwill decreased by 58.03% from the end of the previous year. The proportion of the company's total assets decreased by 1.68 percentage points.

In terms of major changes in liabilities, as of the end of 2024, the company's long-term borrowings accounted for 2.47% of the company's total assets, compared with 0 at the end of the previous year; Other payables (including interest and dividends) decreased by 15.15% from the end of the previous year, accounting for 1.15 percentage points of the company's total assets, the remuneration payable to employees decreased by 8.63% from the end of the previous year, accounting for 0.41 percentage points of the company's total assets, and the contract liabilities increased by 101.75% from the end of the previous year, accounting for 0.26 percentage points of the company's total assets.

From the perspective of inventory changes, as of the end of 2024, the book value of the company's inventory was 272 million yuan, accounting for 7.16% of net assets, an increase of 3.5639 million yuan from the end of the previous year. Among them, the provision for inventory decline was 1.9957 million yuan, and the provision ratio was 0.73%.


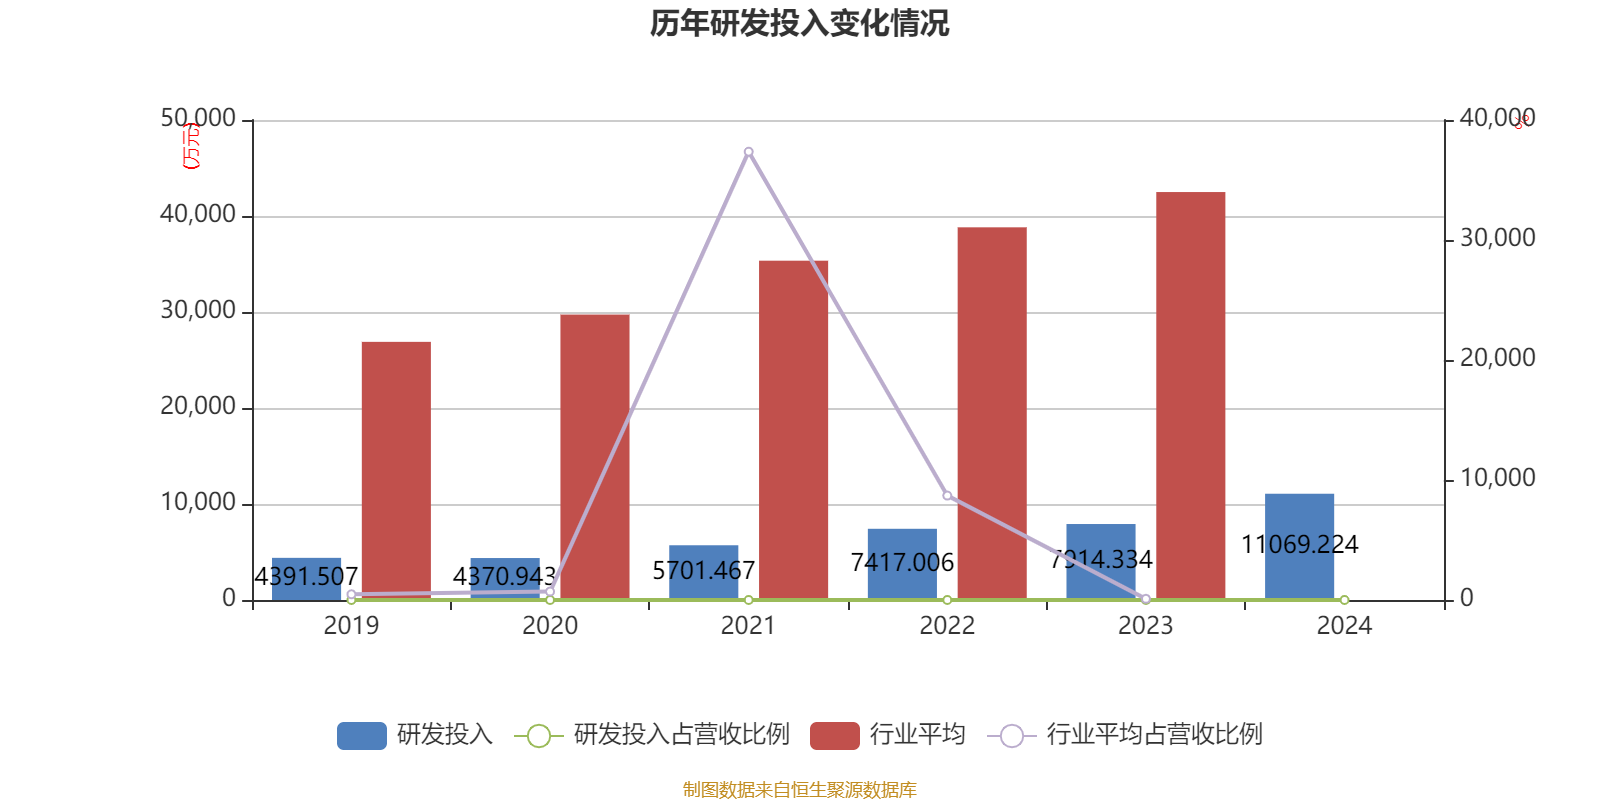
In 2024, the company's R&D investment will be 111 million yuan, a year-on-year increase of 39.86%; R&D investment accounted for 3.37% of operating income, an increase of 0.89 percentage points over the same period last year. In addition, the capitalization rate of the company's R&D investment for the whole year was 0%.


In 2024, the company has a current ratio of 3.52 and a quick ratio of 3.26.


The annual report shows that among the top ten circulating shareholders of the company at the end of 2024, the new shareholders are Liu Ping and Nanjing Xiechen Electronic Technology Co., Ltd., replacing Bai Xianchao and Chen Xuezhang at the end of the third quarter. In terms of specific shareholding ratios, Nanjing Xingong Investment Group Co., Ltd., Fuzhou Investment Management Co., Ltd., Hefei Industrial Investment Holding Co., Ltd., Zhejiang International Trade Group Co., Ltd., Si Youshan, Cheng Rong, and Chen Guomin have increased their shareholdings, while Nanjing Kecheng Software Technology Co., Ltd.'s shareholdings have decreased.
| shareholder name | number of shares outstanding(10,000 shares). | proportion of total share capital (%) | change ratio (percentage points) |
|---|---|---|---|
| Nanjing Xingong Investment Group Co., Ltd. | 22794.38 | 36.546528 | 0.311 |
| Fuzhou Investment Management Co., Ltd | .2300.37 | 3.688213 | 0.031 |
| Hefei Industrial Investment Holding Co., Ltd. | 971.13 | 1.55702 | 0.013 |
| Liu Ping | 778.87 | 1.248772 | New |
| Zhejiang International Trade Group Co., Ltd | .622.49 | 0.998041 | 0.008 |
| Siyoushan | 579.06 | 0.928414 | 0.091 |
| Nanjing Kecheng Software Technology Co., Ltd. | 547.52 | 0.877846-0.277 | |
| Nanjing Xiechen Electronic Technology Co., Ltd | .415.37 | 0.665962 | |
| Xinjin Chengrong | 380 | 0.609259 | 0.004 |
| Chen Guomin | 263.25 | 0.422072 | 0.073 |

Proofreading: Yang Ning
Indicator Annotation:
P/E ratio = total market capitalization / net profit. When the company loses money, the P/E ratio is negative, and it is not practical to use the P/E ratio for valuation, and the P/B ratio or P/B ratio is often used as a reference.
Price-to-book ratio = total market capitalization / net assets. The price-to-book ratio valuation method is mostly used for companies with large fluctuations in earnings and relatively stable net assets.
Price-to-sales ratio = total market capitalization / operating income. The price-to-sales ratio method is often used for growing companies that are losing money or making small profits.
The price-to-earnings ratio and price-to-sales ratio in this article are calculated using the TTM method, that is, the data for the 12 months up to the latest financial report (including forecast). The price-to-book ratio is calculated using the LF method, that is, based on the latest financial report data. The quantile calculation range of the three is from the company's listing to the latest announcement date.
When the P/E ratio and price-to-book ratio are negative, the current quantile is not displayed, which will cause the line chart to be interrupted.
Ticker Name
Percentage Change
Inclusion Date


