
China Securities Intelligent Financial News Xinmai Medical (688016) disclosed its 2024 annual report on March 29. In 2024, the company will achieve a total operating income of 1.206 billion yuan, a year-on-year increase of 1.61%; net profit attributable to the parent company was 502 million yuan, a year-on-year increase of 1.96%; deducted non-net profit of 395 million yuan, a year-on-year decrease of 14.43%; the net cash flow from operating activities was 374 million yuan, down 33.08% year-on-year; During the reporting period, the basic earnings per share of Xinmai Medical was 4.07 yuan, and the weighted average return on equity was 13.22%. The company's 2024 annual distribution plan is: it intends to distribute 3.5 yuan (tax included) to all shareholders for every 10 shares.

Based on the closing price on March 28, the current price-to-earnings ratio (TTM) of Xinmai Medical is about 22.66 times, the price-to-book ratio (LF) is about 3 times, and the price-to-sales ratio (TTM) is about 9.43 times.


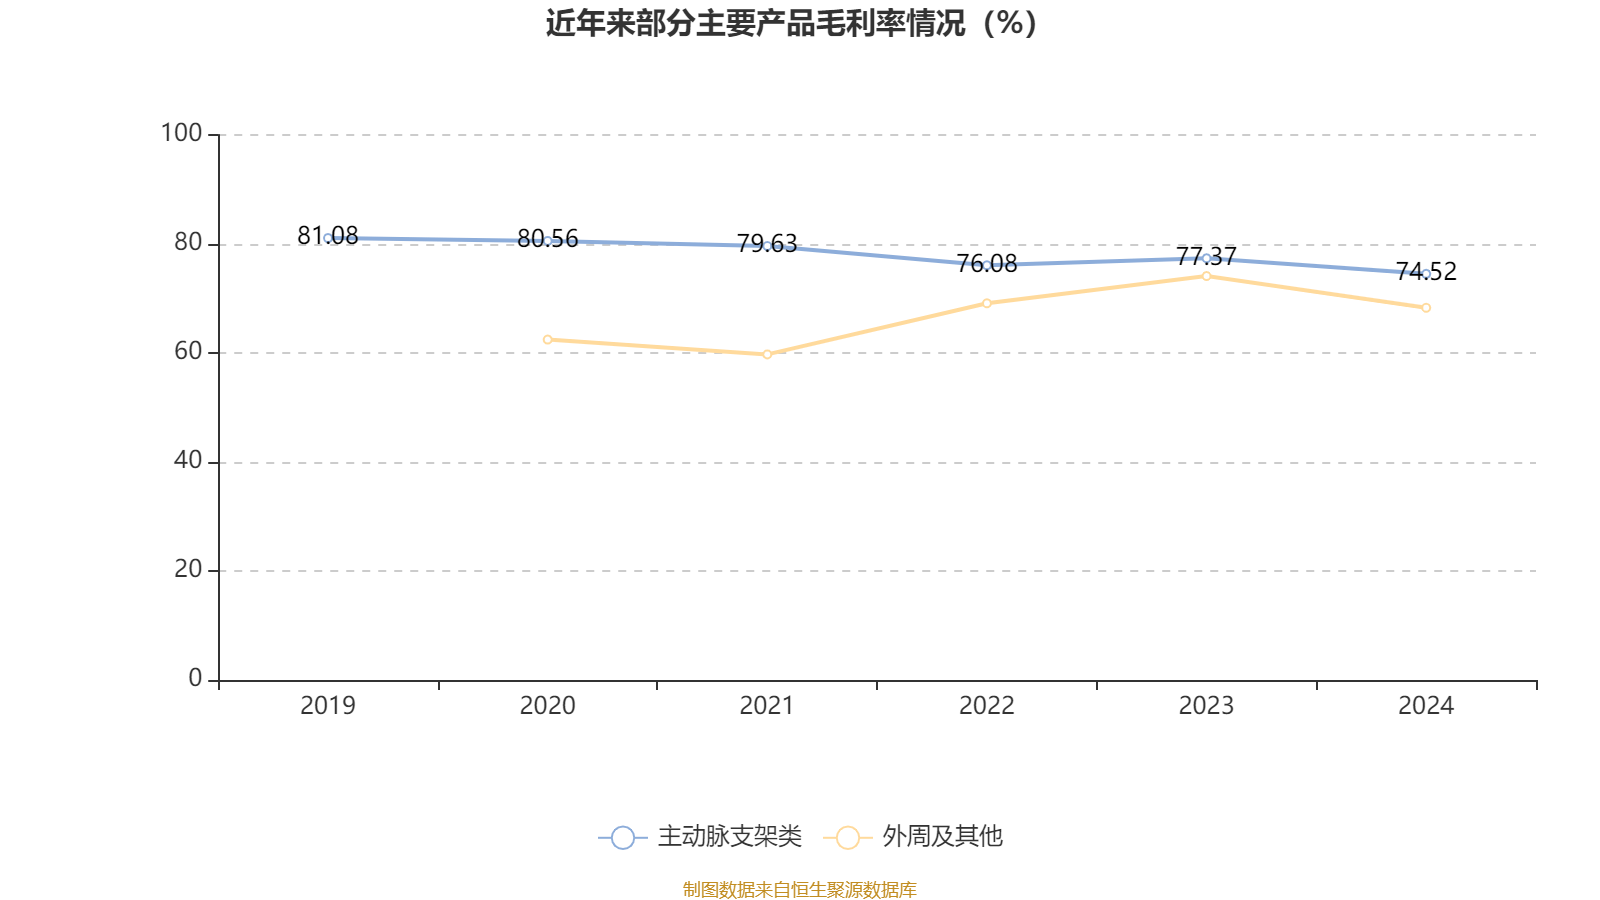
According to the data, the company is a leading enterprise in the field of aortic and peripheral vascular intervention in China, and in 2021, Tuomai Medical was established to engage in tumor intervention business through human peripheral vascular intervention.


According to the data, the company's weighted average return on equity in 2024 will be 13.22%, down 13.21 percentage points from the same period last year. The company's return on invested capital in 2024 will be 12.4%, down 4.52 percentage points from the same period last year.


As of 2024, the company's net cash flow from operating activities will be 374 million yuan, a year-on-year decrease of 33.08%; Net cash flow from financing activities decreased by 2.136 billion yuan to -535 million yuan, and net cash flow from investment activities decreased by -733 million yuan, compared to -177 million yuan in the same period last year.


In terms of major changes in assets, as of the end of 2024, the company's monetary funds decreased by 26.84% from the end of the previous year, accounting for 19.29 percentage points of the company's total assets, and goodwill accounted for 10.16% of the company's total assets, compared with 0 at the end of the previous year. Intangible assets increased by 112.04% from the end of the previous year, accounting for 5.37 percentage points of the company's total assets, and long-term equity investment decreased by 100% from the end of the previous year, accounting for 2.87 percentage points of the company's total assets.

In terms of major changes in liabilities, as of the end of 2024, the company's deferred income tax liabilities accounted for 1.15% of the company's total assets, compared with 0 at the end of the previous year; Other payables (including interest and dividends) increased by 15.67% from the end of the previous year, accounting for 0.49 percentage points of the company's total assets, long-term deferred income increased by 56.01% from the end of the previous year, accounting for 0.48 percentage points of the company's total assets, and taxes payable decreased by 43.47% from the end of the previous year, accounting for 0.34 percentage points of the company's total assets.

From the perspective of inventory changes, as of the end of 2024, the book value of the company's inventory was 266 million yuan, accounting for 7.03% of net assets, an increase of 55.5152 million yuan from the end of the previous year. Among them, the provision for inventory decline was 9.0918 million yuan, and the provision ratio was 3.3%.


For the whole year of 2024, the company's R&D investment will be 170 million yuan, a year-on-year decrease of 34.91%; R&D investment accounted for 14.05% of operating income, down 7.89 percentage points from the same period last year. In addition, the capitalization rate of the company's R&D investment for the whole year was 44.68%.


In 2024, the company has a current ratio of 8.08 and a quick ratio of 7.3.


According to the annual report, among the top ten circulating shareholders of the company at the end of 2024, the new shareholders are ICBC Credit Suisse Frontier Medical Equity Securities Investment Fund and GF High-end Manufacturing Equity Initiation Securities Investment Fund, replacing the Guizhou Railway PICC Phase I No. 1 Equity Investment Fund Center (Limited Partnership) and Southern CSI 1000 Exchange-traded Open-ended Index Securities Investment Fund at the end of the third quarter. In terms of specific shareholding ratios, the holdings of Huabao CSI Medical Exchange-traded Open-ended Index Securities Investment Fund and Bosera SSE Science and Technology Innovation Board 100 Exchange-traded Open-ended Index Securities Investment Fund have increased, while the holdings of the National Social Security Fund 413 Portfolio, Hong Kong Securities Clearing Co., Ltd., and Beijing New Power Equity Investment Fund (Limited Partnership) have decreased.
| shareholder name | number of shares outstanding(10,000 shares). | to total share capital (%) | change ratio (percentage points) |
|---|---|---|---|
| MicroPort Endovascular CHINA Corp. Limited | 4902.54 | 39.7732 | unchanged |
| Huabao CSI Medical Exchange-traded Open-ended Index Securities Investment Fund | 233.28 | 1.8925 | 0.274 |
| National Social Security Fund 413 Portfolio | 184.24 | 1.4946-0.806 | |
| ICBC Credit Suisse Frontier Medical Equity Securities Investment Fund | 113.11 | 0.9176 | New |
| Hong Kong Securities Clearing Co., Ltd | .85.27 | 0.6918-0.233 | |
| Bosera SSE Science and Technology Innovation Board 100 Exchange-traded Open-ended Index Securities Investment Fund | 73.62 | 0.5972 | 0.004 |
| Lin Jianxin | 68.64 | 0.5568 | unchanged |
| GF High-end Manufacturing Equity Initiated Securities Investment Fund | 68.08 | 0.5523 | Xinjin |
| Micro < span id="bk_90.BK0506"> venture capital Capital Holdings Co., Ltd | .67.05 | 0.5439 | unchanged |
| Beijing New Power Equity Investment Fund (Limited Partnership). | 65.89 | 0.5345 | -0.040 |

Proofreading: Yang Ning
Indicator Annotation:
P/E ratio = total market capitalization / net profit. When the company loses money, the P/E ratio is negative, and it is not practical to use the P/E ratio for valuation, and the P/B ratio or P/B ratio is often used as a reference.
Price-to-book ratio = total market capitalization / net assets. The price-to-book ratio valuation method is mostly used for companies with large fluctuations in earnings and relatively stable net assets.
Price-to-sales ratio = total market capitalization / operating income. The price-to-sales ratio method is often used for growing companies that are losing money or making small profits.
The price-to-earnings ratio and price-to-sales ratio in this article are calculated using the TTM method, that is, the data for the 12 months up to the latest financial report (including forecast). The price-to-book ratio is calculated using the LF method, that is, based on the latest financial report data. The quantile calculation range of the three is from the company's listing to the latest announcement date.
When the P/E ratio and price-to-book ratio are negative, the current quantile is not displayed, which will cause the line chart to be interrupted.
Ticker Name
Percentage Change
Inclusion Date


