
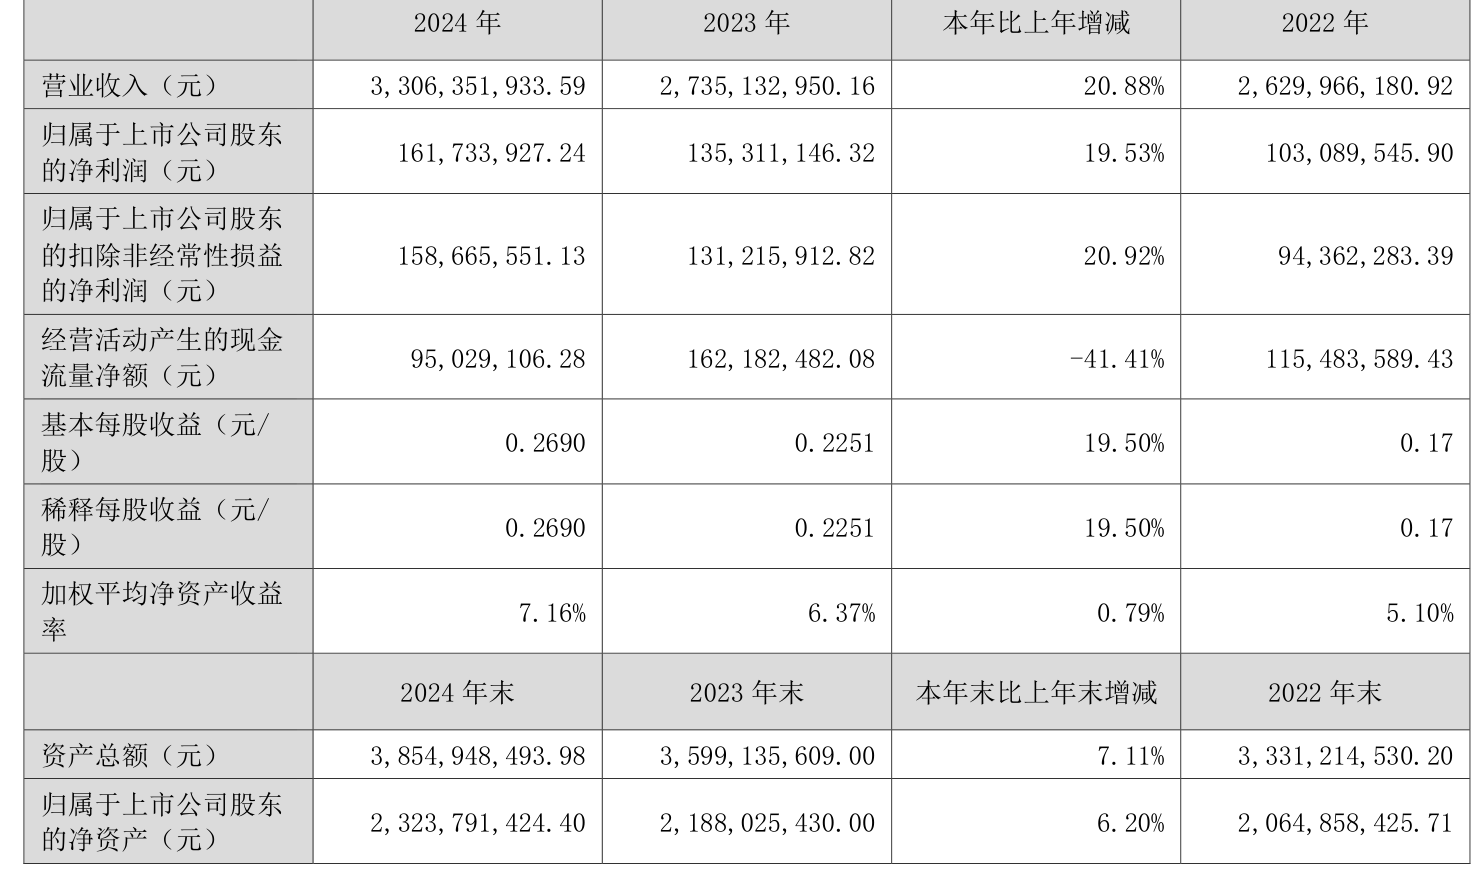
China Securities Intelligent Financial News Haida Co., Ltd. (300320) disclosed its 2024 annual report on March 29. In 2024, the company will achieve a total operating income of 3.306 billion yuan, a year-on-year increase of 20.88%; net profit attributable to the parent company was 162 million yuan, a year-on-year increase of 19.53%; deducted non-net profit of 159 million yuan, a year-on-year increase of 20.92%; the net cash flow from operating activities was 95.0291 million yuan, a year-on-year decrease of 41.41%; During the reporting period, Haida's basic earnings per share was 0.269 yuan, and the weighted average return on equity was 7.16%. The company's 2024 distribution plan is: it intends to distribute 0.2 yuan (tax included) to all shareholders for every 10 shares.
Based on the closing price on March 28, Haida shares currently have a price-to-earnings ratio (TTM) of about 43.9 times, a price-to-book ratio (LF) of about 3.06 times, and a price-to-sales ratio (TTM) of about 2.15 times.


According to the data, the company's main business is committed to the research and development, production and sales of rubber and plastic parts for high-end equipment, and provides global customers with sealing and vibration reduction system solutions.


According to the data, the company's weighted average return on equity in 2024 will be 7.16%, an increase of 0.79 percentage points from the same period last year. The company's return on invested capital in 2024 will be 6.66%, an increase of 0.76 percentage points from the same period last year.


As of 2024, the company's net cash flow from operating activities will be 95.0291 million yuan, a year-on-year decrease of 41.41%; The net cash flow from financing activities was 5.5727 million yuan, an increase of 31.4452 million yuan year-on-year, and the net cash flow from investment activities was -89.5025 million yuan, compared with -161 million yuan in the same period last year.


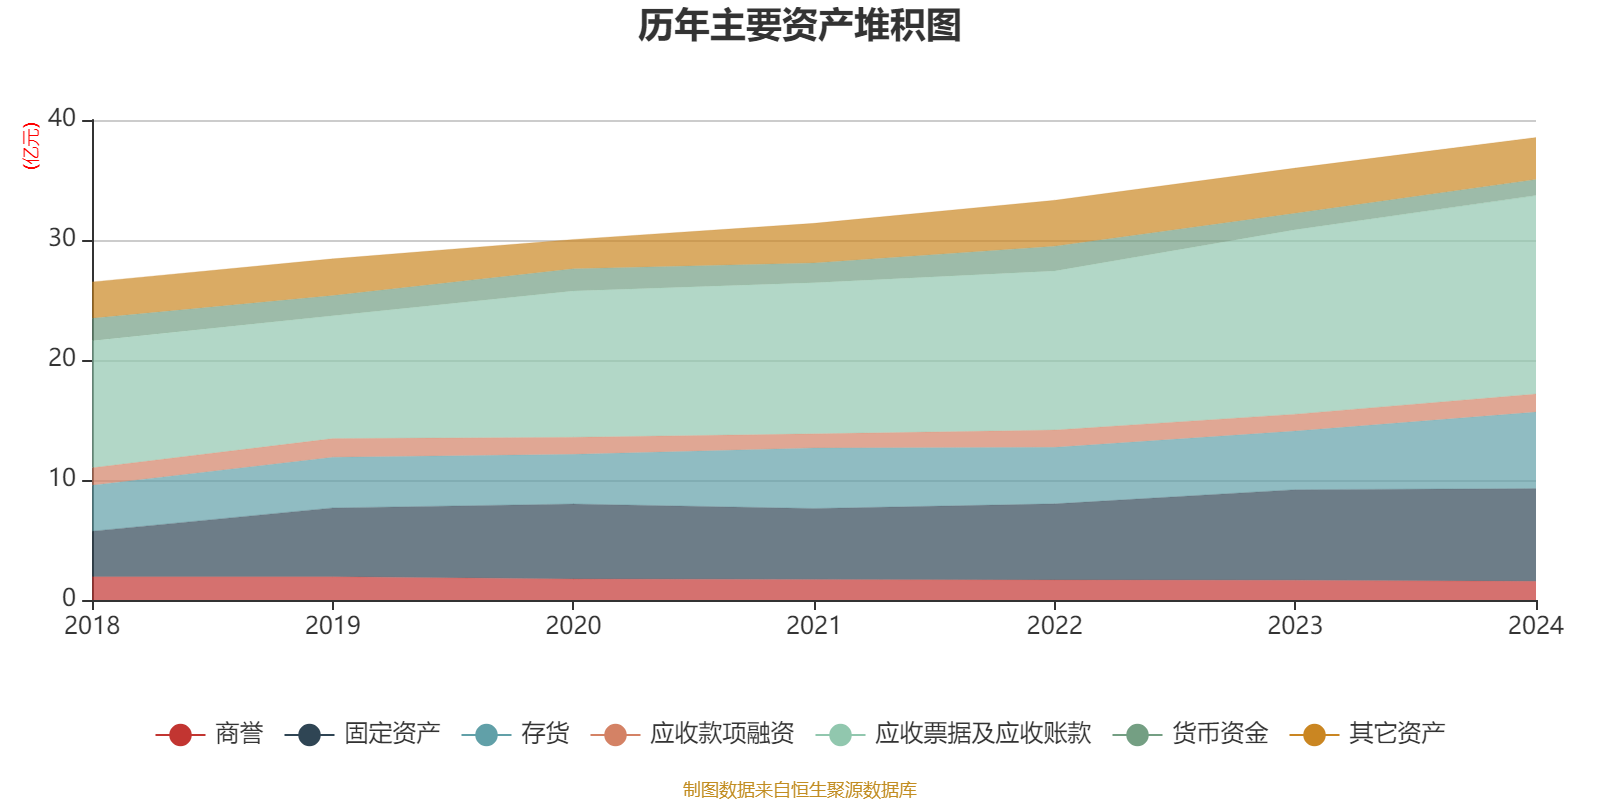
In terms of major changes in assets, as of the end of 2024, the company's inventory increased by 30.55% from the end of the previous year, accounting for 2.97 percentage points of the company's total assets, fixed assets increased by 2.47% from the end of the previous year, accounting for 0.91 percentage points of the company's total assets, contract assets decreased by 13.09% from the end of the previous year, accounting for 0.7 percentage points of the company's total assets, and the total number of projects under construction increased by 159.35% from the end of the previous year, accounting for 0.61 percentage points of the company's total assets.
In terms of major changes in liabilities, as of the end of 2024, the company's long-term borrowings increased by 52.92% from the end of the previous year, accounting for 0.57 percentage points of the company's total assets, non-current liabilities due within one year increased by 39.98% from the end of the previous year, accounting for 0.42 percentage points of the company's total assets, short-term borrowings increased by 2.68% from the end of the previous year, accounting for 0.29 percentage points of the company's total assets, and contract liabilities decreased by 31.05% from the end of the previous year. The proportion of the company's total assets decreased by 0.25 percentage points.

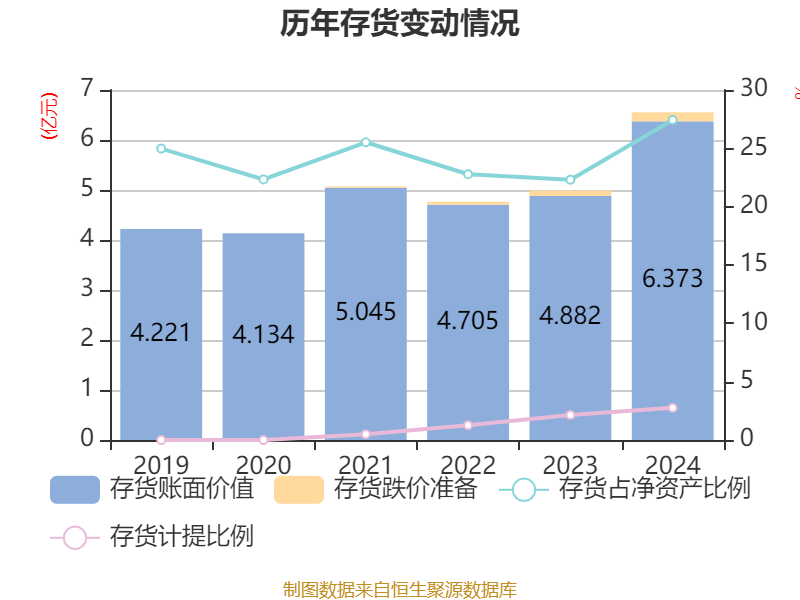
From the perspective of inventory changes, as of the end of 2024, the book value of the company's inventory was 637 million yuan, accounting for 27.43% of net assets, an increase of 149 million yuan from the end of the previous year. Among them, the provision for inventory decline was 18.0912 million yuan, and the provision ratio was 2.76%.

In 2024, the company's R&D investment will be 128 million yuan, a year-on-year increase of 22.25%; R&D investment accounted for 3.87% of operating income, an increase of 0.04 percentage points over the same period last year. In addition, the capitalization rate of the company's R&D investment for the whole year was 0%.


In 2024, the company has a current ratio of 1.97 and a quick ratio of 1.51.


According to the annual report, among the top ten circulating shareholders of the company at the end of 2024, the new shareholders are Zhao Xiafen, Hong Kong Securities Clearing Co., Ltd., Wang Yang, and Yu Wenbiao, replacing Shen Gang, CITIC Securities Co., Ltd., Caitong Asset Management Value Growth Hybrid Securities Investment Fund, and Gu Dongsheng at the end of the third quarter. In terms of specific shareholding ratios, Sun Minhua and Huaan Ankang flexible allocation hybrid securities investment fund holdings have declined.
| shareholder name | number of shares outstanding(10,000 shares). | Proportion of total share capital (%) | Change Ratio (percentage points) |
|---|---|---|---|
| Hu Hefang | 5191.64 | 8.634977 | unchanged |
| Sun Minhua | 2630 | 4.374335-0.012 | |
| Qian Zhenyu | 1757.03 | 2.922369 | unchanged |
| Qian Yanyun | 1442.94 | 2.399956 | unchanged |
| Wang Xincui | 1186.65 | 1.97369 | unchanged |
| Huaan Ankang flexible configuration hybrid Securities Investment | Fund572.28 | 0.951845-0.433 | |
| Zhao Xiafen | 420 | 0.698563 | New |
| Hong Kong Securities Clearing Co., Ltd | .413.71 | 0.688108 | New entrant |
| Wang Yang | 362.59 | 0.60307 | new Yu |
| Wenbiao | 323.91 | 0.538741 | new entrant |

Proofreading: Sun Ping
Indicator Annotation:
P/E ratio = total market capitalization / net profit. When the company loses money, the P/E ratio is negative, and it is not practical to use the P/E ratio for valuation, and the P/B ratio or P/B ratio is often used as a reference.
Price-to-book ratio = total market capitalization / net assets. The price-to-book ratio valuation method is mostly used for companies with large fluctuations in earnings and relatively stable net assets.
Price-to-sales ratio = total market capitalization / operating income. The price-to-sales ratio method is often used for growing companies that are losing money or making small profits.
The price-to-earnings ratio and price-to-sales ratio in this article are calculated using the TTM method, that is, the data for the 12 months up to the latest financial report (including forecast). The price-to-book ratio is calculated using the LF method, that is, based on the latest financial report data. The quantile calculation range of the three is from the company's listing to the latest announcement date.
When the P/E ratio and price-to-book ratio are negative, the current quantile is not displayed, which will cause the line chart to be interrupted.
Ticker Name
Percentage Change
Inclusion Date


