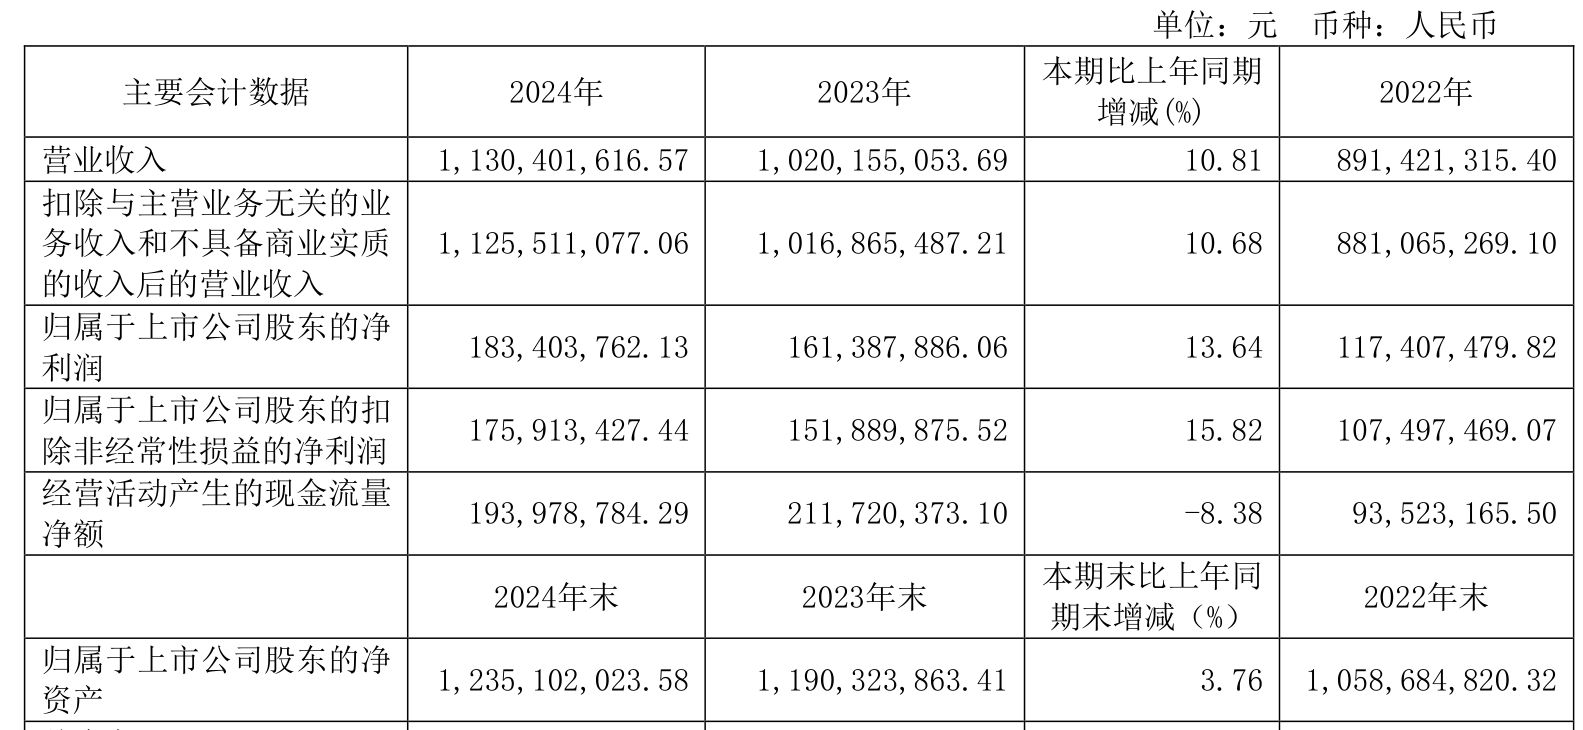
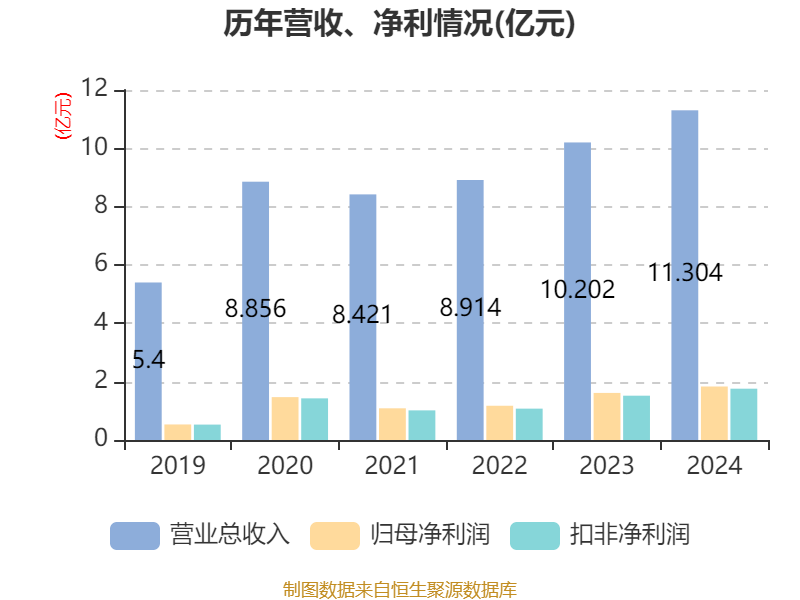
China Securities Intelligent Financial News Unilead (688628) disclosed its 2024 annual report on April 12. In 2024, the company will achieve a total operating income of 1.13 billion yuan, a year-on-year increase of 10.81%; net profit attributable to the parent company was 183 million yuan, a year-on-year increase of 13.64%; deducted non-net profit of 176 million yuan, a year-on-year increase of 15.82%; net cash flow from operating activities was 194 million yuan, down 8.38% year-on-year; During the reporting period, Unilead's basic earnings per share was 1.66 yuan, and the weighted average return on equity was 15.12%. The company's 2024 annual distribution plan is: it intends to distribute 10 yuan (tax included) to all shareholders for every 10 shares.
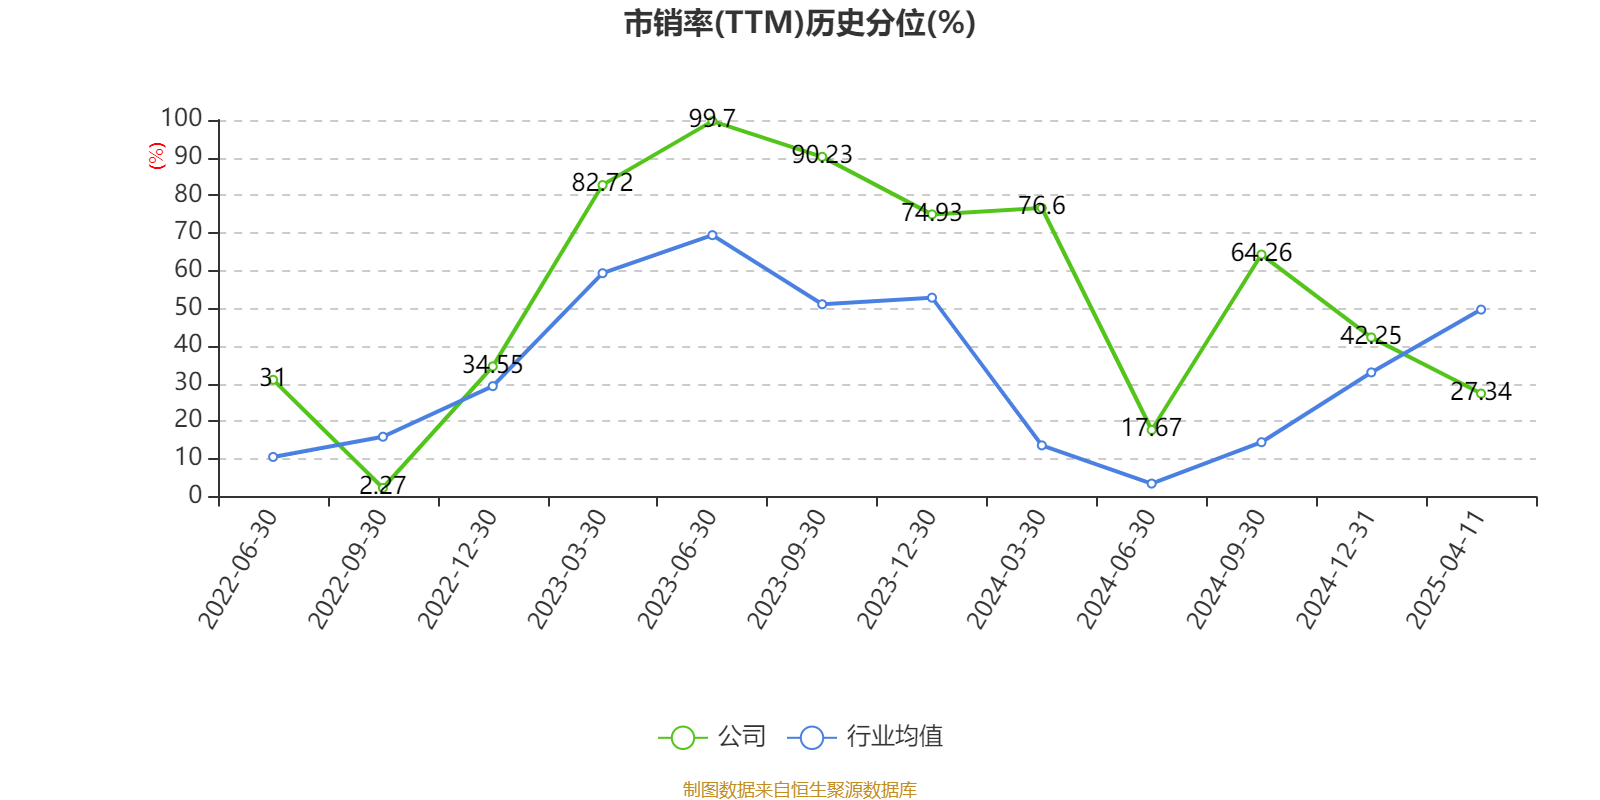
Based on the closing price on April 11, Unilead currently has a price-to-earnings ratio (TTM) of about 22.15 times, a price-to-book ratio (LF) of about 3.29 times, and a price-to-sales ratio (TTM) of about 3.59 times.


According to the data, the company's main products are general instruments, professional instruments, temperature and environmental test instruments, and test instruments.


According to the data, the company's weighted average return on equity in 2024 will be 15.12%, an increase of 0.77 percentage points from the same period last year. The company's return on invested capital in 2024 will be 13.29%, down 0.02 percentage points from the same period last year.


As of 2024, the company's net cash flow from operating activities will be 194 million yuan, a year-on-year decrease of 8.38%; The net cash flow from financing activities was -103 million yuan, a decrease of 105 million yuan year-on-year, and the net cash flow from investment activities was -211 million yuan, compared with 85.5057 million yuan in the same period last year.


In terms of major changes in assets, as of the end of 2024, the company's monetary funds decreased by 34.62% from the end of the previous year, accounting for 10.59 percentage points of the company's total assets, the total trading financial assets increased by 563.6% from the end of the previous year, accounting for 4.82 percentage points of the company's total assets, the total number of projects under construction increased by 66.74% from the end of the previous year, accounting for 2.48 percentage points of the company's total assets, and the right-of-use assets increased by 1214.83% from the end of the previous year. The proportion of the company's total assets increased by 1.69 percentage points.

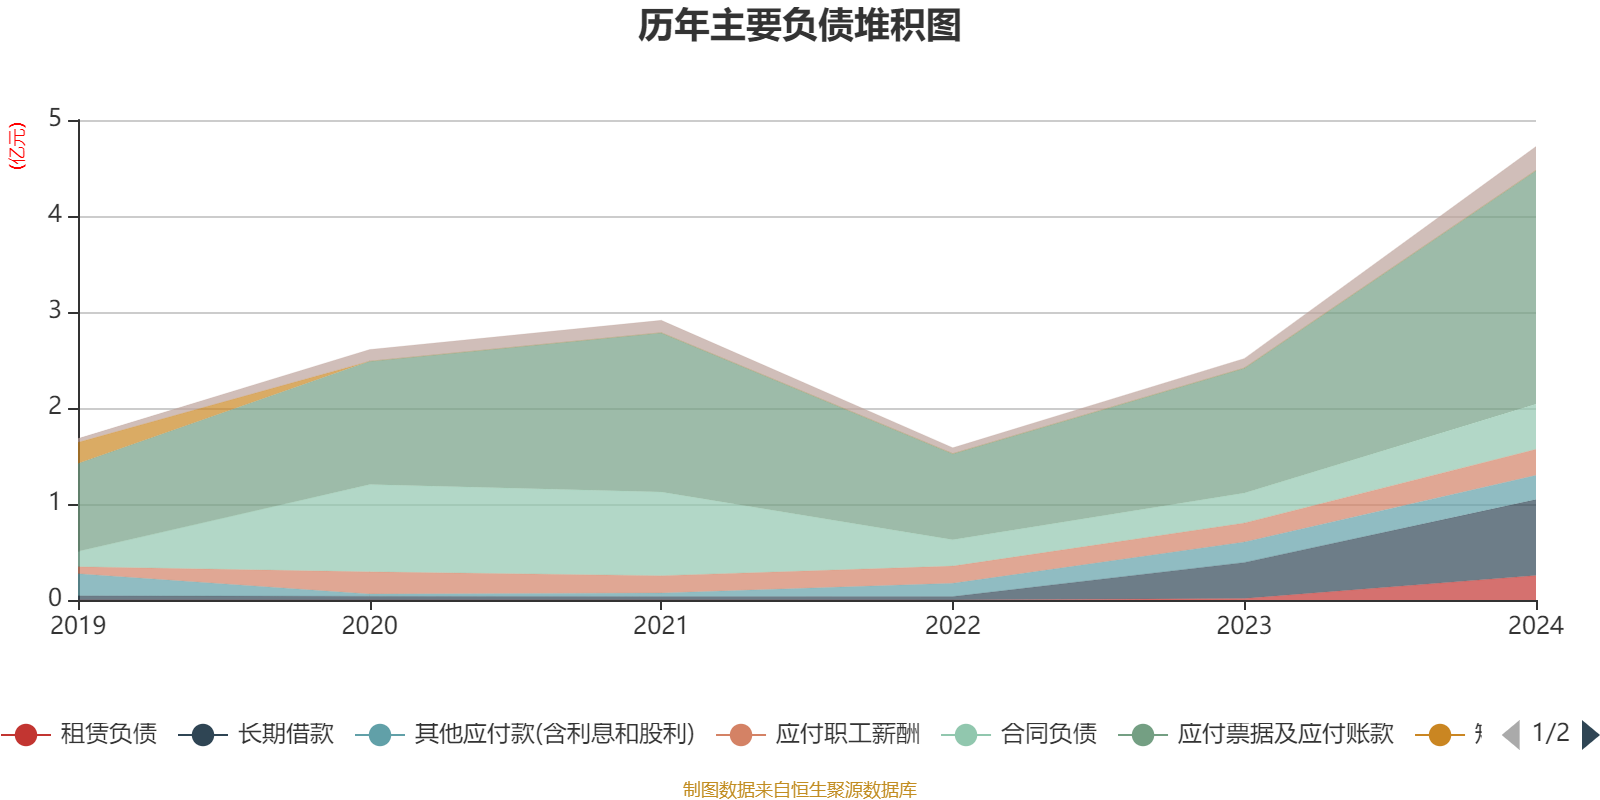
In terms of major changes in liabilities, as of the end of 2024, the company's notes payable and accounts payable increased by 86.7% from the end of the previous year, accounting for 5.22 percentage points of the company's total assets, long-term borrowings increased by 110.48% from the end of the previous year, accounting for 2.03 percentage points of the company's total assets, leasing liabilities increased by 1640.42% from the end of the previous year, accounting for 1.39 percentage points of the company's total assets, and contract liabilities increased by 51.15% from the end of the previous year. The proportion of the company's total assets increased by 0.6 percentage points.
From the perspective of inventory changes, as of the end of 2024, the book value of the company's inventory was 370 million yuan, accounting for 29.98% of net assets, an increase of 79.1368 million yuan from the end of the previous year. Among them, the provision for inventory decline was 13.4108 million yuan, and the provision ratio was 3.5%.


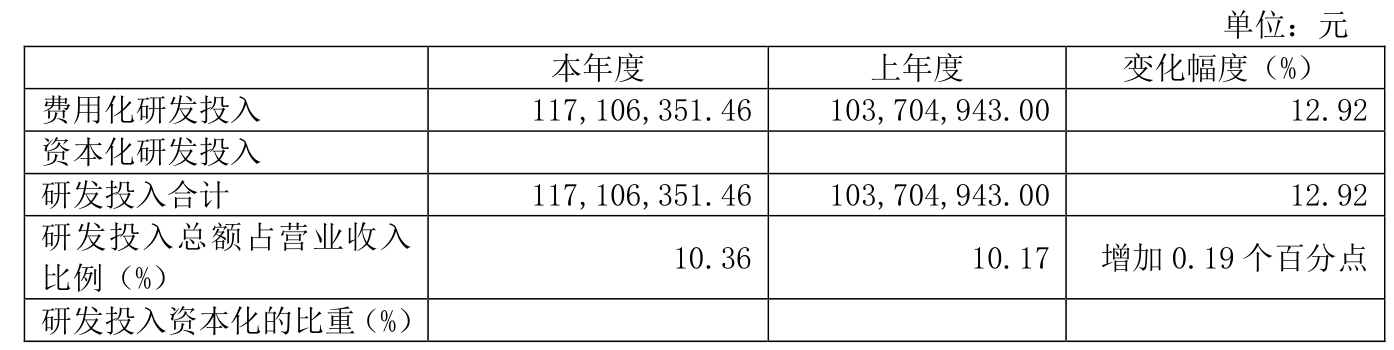
For the whole year of 2024, the company's R&D investment will be 117 million yuan, a year-on-year increase of 12.92%; R&D investment accounted for 10.36% of operating income, an increase of 0.19 percentage points over the same period last year.


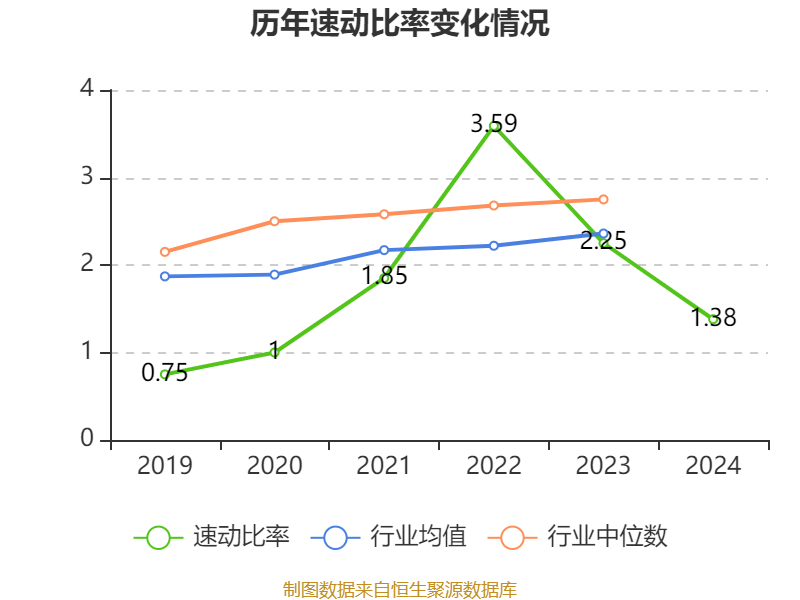
In 2024, the company has a current ratio of 2.39 and a quick ratio of 1.38.

According to the annual report, among the top ten circulating shareholders of the company at the end of 2024, the new shareholders are Tuolia Phase I Enterprise Management (Dongguan) Center (Limited Partnership) and Tuolia Phase III Enterprise Management (Dongguan) Center (Limited Partnership), replacing GF Wenxin Capital Guaranteed Hybrid Securities Investment Fund and GF Shengjin Mixed Securities Investment Fund at the end of the third quarter. In terms of specific shareholding ratios, the holdings of Bank of Communications Schroder Advanced Manufacturing Hybrid Securities Investment Fund, Bank of Communications Schroder Balanced Growth One-year Holding Period Hybrid Securities Investment Fund, and Huatai Berry Fuli Flexible Allocation Hybrid Securities Investment Fund have increased, while the holdings of China Universal Science and Technology Innovation Board 2-year regular open hybrid securities investment fund and Bank of Communications Schroder Qiming Hybrid Securities Investment Fund have decreased.
| name | Number of outstanding shares held (10,000 shares) | Proportion of total share capital (%) | Change ratio (percentage points) |
|---|---|---|---|
| Unilead Group Co., Ltd | .6022.22 | 54.1167 | unchanged |
| Bank of Communications Schroder Advanced Manufacturing Hybrid Securities Investment Fund | 338.02 | 3.0374 | 0.154 |
| Guangdong Jiahong Equity Investment Management Co., Ltd. | 180.81 | 1.6248 | unchanged |
| Tuolia Phase II Enterprise Management (Dongguan) Center (Limited Partnership) | 177.46 | 1.5946 | unchanged |
| Bank of Communications Schroder Balanced Growth 1-year holding period hybrid securities investment fund | 166.54 | 1.4965 | 0.005 |
| CUAM Science and Technology Innovation Board 2-year regular open hybrid securities investment fund | 157.77 | 1.4177-0.252 | |
| Huatai Berry Fuli Flexible Allocation Hybrid Securities Investment Fund | 119.79 | 1.0764 | 0.034 |
| Bank of Communications Schroder Qiming Hybrid Securities Investment Fund | 112.19 | 1.0081 | -0.387 |
| Tolia Phase I Enterprise Management (Dongguan) Center (Limited Partnership) | 80.85 | 0.7264 | New |
| Tolia Phase III Enterprise Management (Dongguan) Center (Limited Partnership) | 72.04 | 0.6473 | New |

Proofreading: Yang Peng
Indicator Annotation:
P/E ratio = total market capitalization / net profit. When the company loses money, the P/E ratio is negative, and it is not practical to use the P/E ratio for valuation, and the P/B ratio or P/B ratio is often used as a reference.
Price-to-book ratio = total market capitalization / net assets. The price-to-book ratio valuation method is mostly used for companies with large fluctuations in earnings and relatively stable net assets.
Price-to-sales ratio = total market capitalization / operating income. The price-to-sales ratio method is often used for growing companies that are losing money or making small profits.
The price-to-earnings ratio and price-to-sales ratio in this article are calculated using the TTM method, that is, the data for the 12 months up to the latest financial report (including forecast). The price-to-book ratio is calculated using the LF method, that is, based on the latest financial report data. The quantile calculation range of the three is from the company's listing to the latest announcement date.
When the P/E ratio and price-to-book ratio are negative, the current quantile is not displayed, which will cause the line chart to be interrupted.
Ticker Name
Percentage Change
Inclusion Date


