
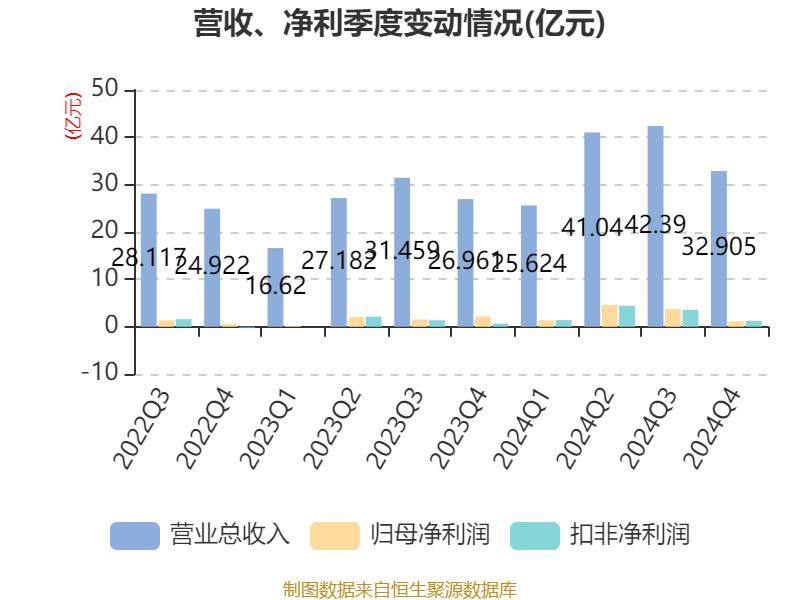
China Securities Intelligent Financial News No. 9 Company (689009) disclosed its 2024 annual report on April 12. In 2024, the company will achieve a total operating income of 14.196 billion yuan, a year-on-year increase of 38.87%; the net profit attributable to the parent company was 1.084 billion yuan, a year-on-year increase of 81.29%; deducted non-net profit of 1.062 billion yuan, a year-on-year increase of 157.24%; the net cash flow from operating activities was 3.354 billion yuan, a year-on-year increase of 44.59%; During the reporting period, the basic earnings per share of Nine Company was 15.32 yuan, and the weighted average return on equity was 19.10%. The company's 2024 distribution plan is: it intends to distribute 11.31 yuan (tax included) to all shareholders for every 10 shares.

Based on the closing price on April 11, Nine currently has a price-to-earnings (TTM) ratio of about 37.65 times, a price-to-book ratio (LF) of about 6.63 times, and a price-to-sales ratio (TTM) of about 2.88 times.


According to the data, the company's main products are electric balance vehicles, electric scooters, electric two-wheeled vehicles, all-terrain vehicles and service robots, E-bikes, etc.


According to the data, the company's weighted average return on equity in 2024 will be 19.1%, an increase of 7.6 percentage points from the same period last year. The company's return on invested capital in 2024 will be 16.83%, an increase of 6.7 percentage points from the same period last year.


As of 2024, the company's net cash flow from operating activities will be 3.354 billion yuan, a year-on-year increase of 44.59%; Net cash flow from financing activities decreased by $366 million to RMB513 million, and net cash flow from investing activities was RMB2,462 million, compared to RMB454 million in the same period last year.


In terms of major changes in assets, as of the end of 2024, the total trading financial assets of the company increased by 452.54% from the end of the previous year, accounting for 5.94 percentage points of the company's total assets, other non-current financial assets decreased by 50.02% from the end of the previous year, accounting for 3.68 percentage points of the company's total assets, fixed assets increased by 10.51% from the end of the previous year, accounting for 2.32 percentage points of the company's total assets, and notes receivable and accounts receivable increased by 10.21% from the end of the previous year. The proportion of the company's total assets decreased by 2.18 percentage points.

In terms of major changes in liabilities, as of the end of 2024, the company's notes payable and accounts payable increased by 68.65% from the end of the previous year, accounting for 5.65 percentage points of the company's total assets, contract liabilities increased by 175.56% from the end of the previous year, accounting for 4.03 percentage points of the company's total assets, other current liabilities increased by 194.06% from the end of the previous year, accounting for 0.84 percentage points of the company's total assets, and the estimated liabilities increased by 725.59% from the end of the previous year. The proportion of the company's total assets increased by 0.6 percentage points.

For the whole year of 2024, the company's R&D investment will be 826 million yuan, a year-on-year increase of 34.13%; R&D investment accounted for 5.82% of operating income, down 0.21 percentage points from the same period last year.


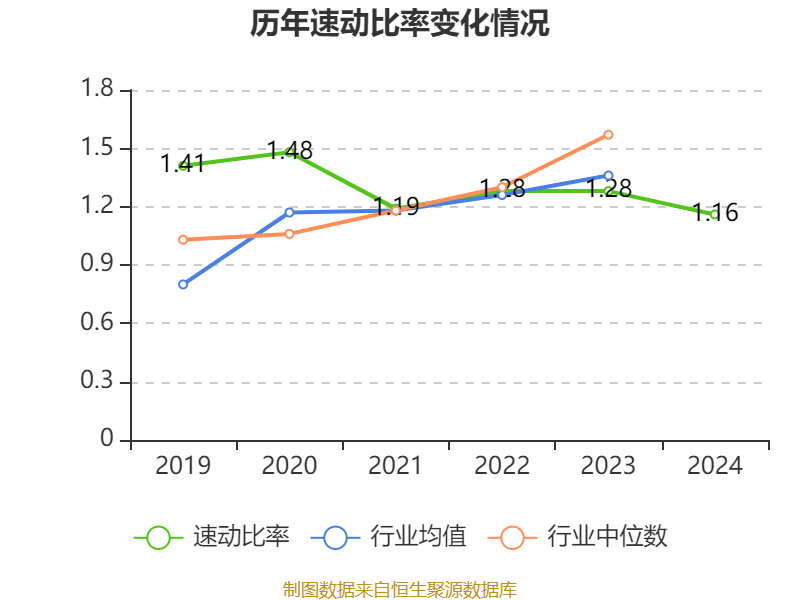
In 2024, the company has a current ratio of 1.36 and a quick ratio of 1.16.

According to the annual report, among the top ten circulating shareholders of the company at the end of 2024, the new shareholder is Invesco Great Wall New Energy Industry Equity Securities Investment Fund, replacing Megacity Industrial (Cayman) Co., Limited at the end of the third quarter. In terms of specific shareholding ratios, the holdings of ChinaAMC SSE STAR Market 50 Component Exchange-traded Open-ended Index Securities Investment Fund have increased, and People Better Limited, HSG GF Holdco III-A, Ltd., E Fund SSE STAR Market 50 Component Exchange-traded Open-ended Index Securities Investment Fund, Wtmtech Limited, Future Industry Investment (Cayman) Co., ., Ltd., Limited, ZhongTouYuanQuan Group Limited, WestSummit Global Technology Fund, L.P., Bumblebee Investment (Cayman) Co., Limited decreased their shareholdings.
| shareholder name | number of shares outstanding (10,000 shares). | Ratio of total share capital (%) | Change Ratio (percentage points) |
|---|---|---|---|
| People Better Limited | 358.41 | 4.9978-0.498 | |
| ChinaAMC SSE Science and Technology Innovation Board 50 Component Exchange-traded Open-ended Index Securities Investment Fund | 319.95 | 4.4616 | 0.148 |
| HSG GF Holdco III-A, Ltd. | 272.2 | 3.7957-1.001 | |
| E Fund SSE STAR Market 50 Component Exchange-traded Open-ended Index Securities Investment Fund | 210.06 | 2.9292-0.358 | |
| Wtmtech Limited | 144.76 | 2.0186 | -0.023 |
| Future Industry Investment(Cayman) Co., Limited | 137.74 | 1.9207 | -0.298 |
| ZhongTouYuanQuan Group Limited | 114.03 | 1.5901 | -0.083 |
| WestSummit Global Technology Fund, L.P. | 112.48 | 1.5685 | -0.001 |
| Invesco Great Wall New Energy Industry Equity Securities Investment Fund | 107.83 | 1.5036 | New |
| Bumblebee Investment (Cayman) Co., Limited | 106.41 | 1.4837-0.217 |

Proofreading: Yang Peng
Indicator Annotation:
P/E ratio = total market capitalization / net profit. When the company loses money, the P/E ratio is negative, and it is not practical to use the P/E ratio for valuation, and the P/B ratio or P/B ratio is often used as a reference.
Price-to-book ratio = total market capitalization / net assets. The price-to-book ratio valuation method is mostly used for companies with large fluctuations in earnings and relatively stable net assets.
Price-to-sales ratio = total market capitalization / operating income. The price-to-sales ratio method is often used for growing companies that are losing money or making small profits.
The price-to-earnings ratio and price-to-sales ratio in this article are calculated using the TTM method, that is, the data for the 12 months up to the latest financial report (including forecast). The price-to-book ratio is calculated using the LF method, that is, based on the latest financial report data. The quantile calculation range of the three is from the company's listing to the latest announcement date.
When the P/E ratio and price-to-book ratio are negative, the current quantile is not displayed, which will cause the line chart to be interrupted.
Ticker Name
Percentage Change
Inclusion Date


