
China Securities Intelligent Financial News Ruida (688800) disclosed its 2024 annual report on April 15. In 2024, the company will achieve a total operating income of 2.415 billion yuan, a year-on-year increase of 55.29%; net profit attributable to the parent company was 175 million yuan, a year-on-year increase of 28.11%; deducted non-net profit of 163 million yuan, a year-on-year increase of 32.21%; the net cash flow from operating activities was 57.1618 million yuan, a year-on-year decrease of 65.18%; During the reporting period, the basic earnings per share of Ruida was 1.11 yuan, and the weighted average return on equity was 8.68%. The company's 2024 distribution plan is: it is planned to transfer 3 shares for every 10 shares to all shareholders, and distribute 3.5 yuan (tax included).

Based on the closing price on April 14, the current price-to-earnings ratio (TTM) is about 39.92 times, the price-to-book ratio (LF) is about 3.34 times, and the price-to-sales ratio (TTM) is about 2.9 times.


According to the data, the company's main connectors, connector components and modules.


According to the data, the company's weighted average return on equity in 2024 will be 8.68%, an increase of 1.58 percentage points from the same period last year. The company's return on invested capital in 2024 will be 6.94%, an increase of 0.71 percentage points from the same period last year.


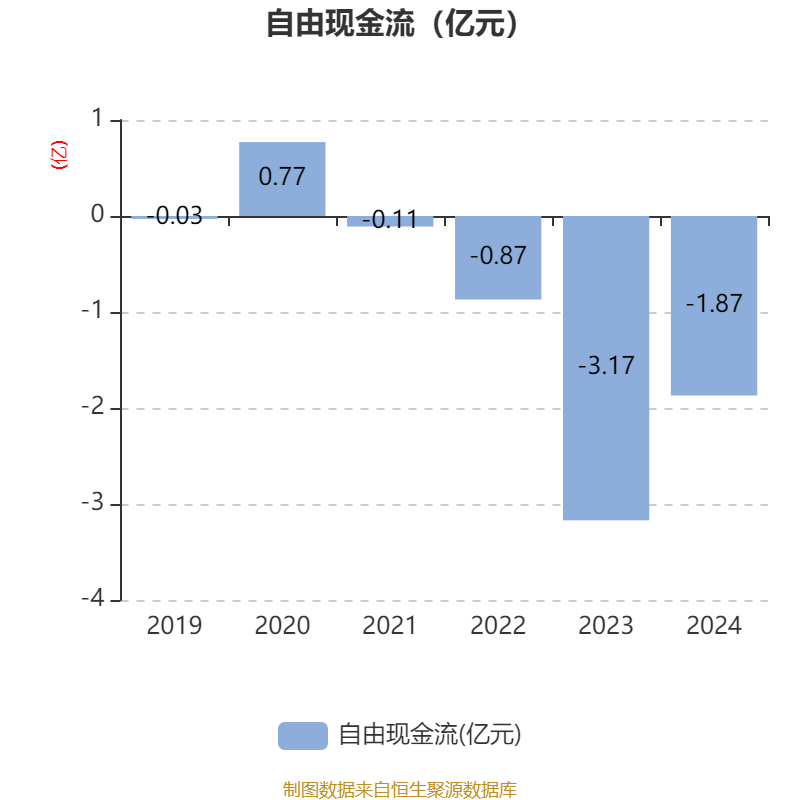
As of 2024, the company's net cash flow from operating activities will be 57.1618 million yuan, a year-on-year decrease of 65.18%; The net cash flow from financing activities was 266 million yuan, an increase of 81.0458 million yuan year-on-year, and the net cash flow from investment activities was -274 million yuan, compared with -480 million yuan in the same period last year.


In terms of major changes in assets, as of the end of 2024, the company's monetary funds increased by 5.4% from the end of the previous year, accounting for 4.72 percentage points of the company's total assets, notes receivable and accounts receivable increased by 43.44% from the end of the previous year, accounting for 2.78 percentage points of the company's total assets, inventory increased by 50.07% from the end of the previous year, accounting for 2.2 percentage points of the company's total assets, and the total number of projects under construction increased by 48.44% from the end of the previous year. The proportion of the company's total assets increased by 1.02 percentage points.

In terms of major changes in liabilities, as of the end of 2024, the company's notes payable and accounts payable increased by 53.23% from the end of the previous year, accounting for 5.11 percentage points of the company's total assets, long-term borrowings increased by 484.83% from the end of the previous year, accounting for 2.57 percentage points of the company's total assets, short-term borrowings increased by 37.02% from the end of the previous year, accounting for 0.82 percentage points of the company's total assets, and contract liabilities decreased by 33.82% from the end of the previous year. The proportion of the company's total assets decreased by 0.78 percentage points.

From the perspective of inventory changes, as of the end of 2024, the book value of the company's inventory was 607 million yuan, accounting for 28.98% of net assets, an increase of 203 million yuan from the end of the previous year. Among them, the provision for inventory decline was 36.3236 million yuan, and the provision ratio was 5.64%.


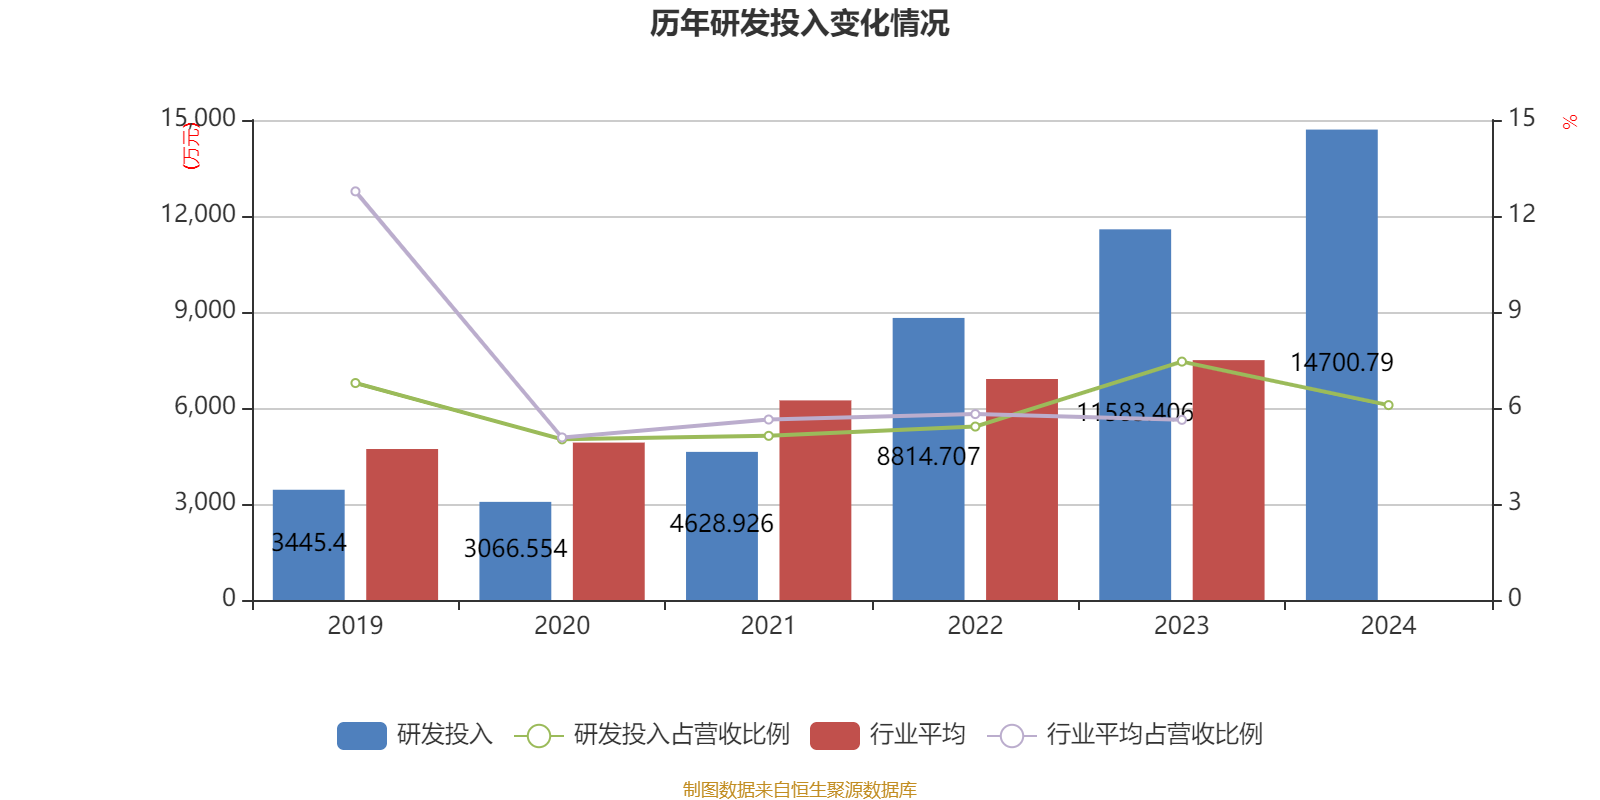
In 2024, the company's R&D investment will be 147 million yuan, a year-on-year increase of 26.91%; R&D investment accounted for 6.09% of operating income, down 1.36 percentage points from the same period last year.


In 2024, the company has a current ratio of 1.56 and a quick ratio of 1.25.


According to the annual report, among the top ten circulating shareholders of the company at the end of 2024, the new shareholders are Manulife Transformation Opportunity Equity Securities Investment Fund, 2024 Employee Stock Ownership Plan, and Hong Kong Securities Clearing Co., Ltd., replacing Beijing Guoke Ruihua Strategic Emerging Industry Investment Fund (Limited Partnership) at the end of the third quarter, Suzhou Industrial Park Oriza Chongyuan No. 2 Equity Investment Fund Partnership (Limited Partnership), and Soochow Securities Ruida Employees Participate in the Strategic Placement Collective Asset Management Plan of the Science and Technology Innovation Board. In terms of specific shareholding ratios, Shou Zugang and Ruizhong Life Insurance Co., Ltd. - their own capital holdings have declined.
| name | The number of outstanding shares held (10,000 shares) | accounted for the proportion of total share capital (%) | , and the change ratio (percentage points) |
|---|---|---|---|
| Wu Shijun | 4515 | 28.5002 | unchanged |
| Huang Bo | 999.6 | 6.3098 | unchanged |
| Suzhou Lianrui Investment Management Center (Limited Partnership) | 560 | 3.5349 | unchanged |
| Ma Jian | 277.2 | 1.7497 | |
| unchanged Soochow Innovation Capital Management Co., Ltd | 189 | 1.193 | unchanged |
| Shou Zu Gang | 173.87 | 1.0975-0.617 | |
| Ruizhong Life Insurance LLC - Own funds | 155.45 | 0.9812-0.253 | |
| Manulife Transformation Opportunities Equity Securities Investment Fund | 155.21 | 0.9797 | New |
| 2024 Employee Stock Ownership Plan | 148.4 | 0.9367 | New |
| Hong Kong Securities Clearing Company Limited | 142.4 | 0.8989 | New Entry |

Proofreading: Yang Peng
Indicator Annotation:
P/E ratio = total market capitalization / net profit. When the company loses money, the P/E ratio is negative, and it is not practical to use the P/E ratio for valuation, and the P/B ratio or P/B ratio is often used as a reference.
Price-to-book ratio = total market capitalization / net assets. The price-to-book ratio valuation method is mostly used for companies with large fluctuations in earnings and relatively stable net assets.
Price-to-sales ratio = total market capitalization / operating income. The price-to-sales ratio method is often used for growing companies that are losing money or making small profits.
The price-to-earnings ratio and price-to-sales ratio in this article are calculated using the TTM method, that is, the data for the 12 months up to the latest financial report (including forecast). The price-to-book ratio is calculated using the LF method, that is, based on the latest financial report data. The quantile calculation range of the three is from the company's listing to the latest announcement date.
When the P/E ratio and price-to-book ratio are negative, the current quantile is not displayed, which will cause the line chart to be interrupted.
Ticker Name
Percentage Change
Inclusion Date


