
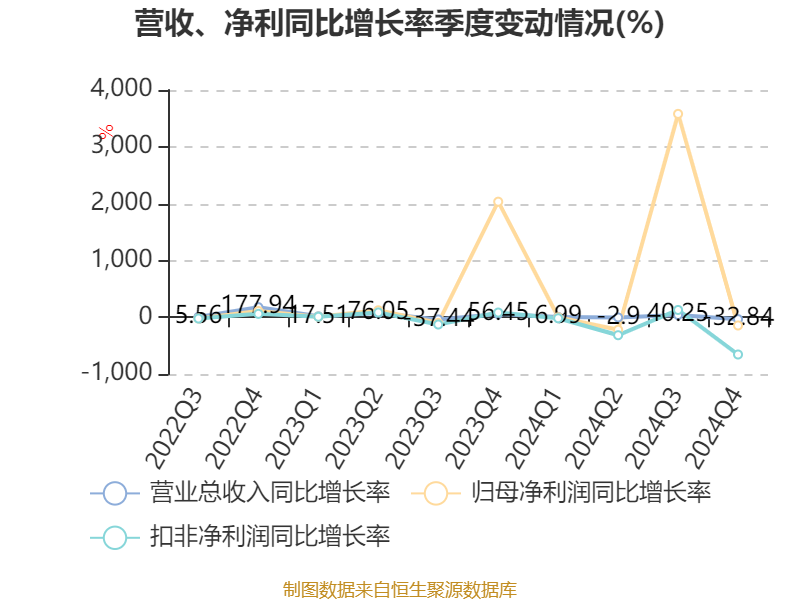
China Securities Intelligent Financial News Olaide (688378) disclosed its 2024 annual report on April 17. In 2024, the company will achieve a total operating income of 533 million yuan, a year-on-year increase of 3.00%; the net profit attributable to the parent company was 90.4328 million yuan, a year-on-year decrease of 26.04%; deducted non-net profit of 45.2701 million yuan, a year-on-year decrease of 40.05%; the net cash flow from operating activities was 64.3779 million yuan, a year-on-year increase of 161.82%; During the reporting period, the basic earnings per share of Olaide was 0.43 yuan, and the weighted average return on equity was 5.15%. The company's 2024 annual distribution plan is: it is planned to transfer 2 shares for every 10 shares to all shareholders, and distribute 2.5 yuan (tax included).
During the reporting period, the company's total non-recurring profit and loss was 45.1627 million yuan, of which the government subsidy included in the current profit and loss was 44.1923 million yuan, the profit and loss on the disposal of non-current assets was 12.5299 million yuan, and the income tax impact was -7.0098 million yuan.

Based on the closing price on April 16, Olaide's current price-to-earnings ratio (TTM) is about 41.13 times, the price-to-book ratio (LF) is about 2.14 times, and the price-to-sales ratio (TTM) is about 6.98 times.


According to the data, the company's main products are organic luminescent materials, PSPI materials, thin film packaging materials, evaporation source equipment, MicroOLED evaporation machines, and perovskite evaporation machines.


According to the data, the company's weighted average return on equity in 2024 will be 5.15%, down 2.05 percentage points from the same period last year. The company's return on invested capital in 2024 will be 4.53%, down 1.7 percentage points from the same period last year.


As of 2024, the company's net cash flow from operating activities will be 64.3779 million yuan, a year-on-year increase of 161.82%; The net cash flow from financing activities was -98.7887 million yuan, a year-on-year decrease of 88.5796 million yuan, and the net cash flow from investment activities was -113 million yuan, compared with -173 million yuan in the same period last year.


In terms of major changes in assets, as of the end of 2024, the company's fixed assets increased by 20.22% from the end of the previous year, accounting for 6.96 percentage points of the company's total assets, monetary funds decreased by 32.84% from the end of the previous year, accounting for 6.85 percentage points of the company's total assets, the total number of projects under construction decreased by 21.36% from the end of the previous year, accounting for 1.59 percentage points of the company's total assets, and development expenditure increased by 201.12% from the end of the previous year. The proportion of the company's total assets increased by 1.28 percentage points.

In terms of major changes in liabilities, as of the end of 2024, the company's contractual liabilities decreased by 65.26% from the end of the previous year, accounting for 2.04 percentage points of the company's total assets, notes payable and accounts payable increased by 28.16% from the end of the previous year, accounting for 1.63 percentage points of the company's total assets, and long-term borrowings accounted for 1.38% of the company's total assets, compared with 0 at the end of the previous year. Long-term deferred income increased by 3.79% from the end of the previous year, accounting for 0.39 percentage points of the company's total assets.

From the perspective of inventory changes, as of the end of 2024, the book value of the company's inventory was 240 million yuan, accounting for 13.83% of net assets, an increase of 1.4571 million yuan from the end of the previous year. Among them, the provision for inventory decline was 13.7178 million yuan, and the provision ratio was 5.4%.


In 2024, the company's R&D investment will be 150 million yuan, a year-on-year increase of 22.73%; R&D investment accounted for 28.15% of operating income, an increase of 4.52 percentage points over the same period last year. In addition, the capitalization rate of the company's R&D investment for the year was 18.4%.


In 2024, the company has a current ratio of 3.33 and a quick ratio of 2.36.


According to the annual report, among the top ten circulating shareholders of the company at the end of 2024, the new shareholders are Xinhua Asset Management - Industrial Bank - Xinhua Asset Management - Minghui No. 2 Asset Management Products, Lu Yuan, Xinhua Asset Management - Shanghai Pudong Development Bank - Xinhua Assets - Preferred Asset Management Products for Science and Technology Innovation Industry, Changchun Juhai Investment Partnership (Limited Partnership), Xinhua Life Insurance Co., Ltd. - Traditional - General Insurance Products - 018L-CT001 Shanghai, It replaced the Invesco Great Wall Electronic Information Industry Equity Securities Investment Fund, Invesco Great Wall Growth Leading One-Year Holding Period Hybrid Securities Investment Fund, Invesco Great Wall Fund China Life Growth Equity Portfolio Single Asset Management Plan (available for sale), Hong Kong Securities Clearing Company Limited, and Invesco Great Wall Preferred Hybrid Securities Investment Fund at the end of the third quarter. In terms of specific shareholding ratio, the shareholding of Dacheng Internet Thinking Hybrid Securities Investment Fund has increased, and the shareholding of Dayang Nissoso (China) Investment Co., Ltd. has decreased.
| shareholder name | number of shares outstanding (10,000 shares). | Proportion of total share capital (%) | Change Ratio (percentage points) |
|---|---|---|---|
| Xuanjingquan | 4052.19 | 19.4678 | unchanged |
| Xuanlingyi | 1788.05 | 8.5902 | unchanged |
| Dacheng Internet Thinking Mixed Securities Investment Fund | 823.21 | 3.9549 | 2.178 |
| Dayang Nippon Sanso (China) Investment Co., Ltd | .664.64 | 3.1931-1.000 | |
| Gansu Guofang Industry & Trade (Group) Co., Ltd. | 252.22 | 1.2117 | unchanged |
| Xinhua Asset Management- Industrial Bank-Xinhua Asset-Minghui No.2 Asset Management Product | 240.86 | 1.1571 | New |
| Lu Yuan | 237.91 | 1.143 | New |
| Xinhua Asset Management- Shanghai Pudong Development Bank-Xinhua Assets-Science and Technology Innovation preferred asset management products for new industries | 223.05 | 1.0716 | New |
| Changchun Juhai Investment Partnership (Limited Partnership) | 210.44 | 1.0109 | New |
| China Life insuranceCo., Ltd. - Traditional - General Insurance Products - 018L-CT001 Shanghai | 206.72 | 0.9931 | New |

Proofreading: Yang Ning
Indicator Annotation:
P/E ratio = total market capitalization / net profit. When the company loses money, the P/E ratio is negative, and it is not practical to use the P/E ratio for valuation, and the P/B ratio or P/B ratio is often used as a reference.
Price-to-book ratio = total market capitalization / net assets. The price-to-book ratio valuation method is mostly used for companies with large fluctuations in earnings and relatively stable net assets.
Price-to-sales ratio = total market capitalization / operating income. The price-to-sales ratio method is often used for growing companies that are losing money or making small profits.
The price-to-earnings ratio and price-to-sales ratio in this article are calculated using the TTM method, that is, the data for the 12 months up to the latest financial report (including forecast). The price-to-book ratio is calculated using the LF method, that is, based on the latest financial report data. The quantile calculation range of the three is from the company's listing to the latest announcement date.
When the P/E ratio and price-to-book ratio are negative, the current quantile is not displayed, which will cause the line chart to be interrupted.
Ticker Name
Percentage Change
Inclusion Date


