
China Securities Intelligent Financial News Smartway (688213) disclosed its first quarter report for 2025 on April 19. The company achieved a total operating income of 1.75 billion yuan, a year-on-year increase of 108.94%; the net profit attributable to the parent company was 191 million yuan, a year-on-year increase of 1264.97%; deducted non-net profit of 189 million yuan, a year-on-year increase of 864.99%; Net cash flow from operating activities was -490 million yuan, compared to -381 million yuan in the same period last year, and the basic earnings per share of SmartSens was 0.48 yuan, and the weighted average return on equity was 4.43% during the reporting period.

Based on the closing price on April 18, SmartSens currently has a price-to-earnings ratio (TTM) of about 67.38 times, a price-to-book ratio (LF) of about 8.62 times, and a price-to-sales ratio (TTM) of about 5.58 times.


According to the data, the company's main business is high-performance CMOS image sensors.


In terms of profitability, the company's weighted average return on equity in the first quarter of 2025 was 4.43%, an increase of 4.06 percentage points year-on-year. The company's return on invested capital in the first quarter of 2025 was 2.87%, an increase of 2.44 percentage points from the same period last year.


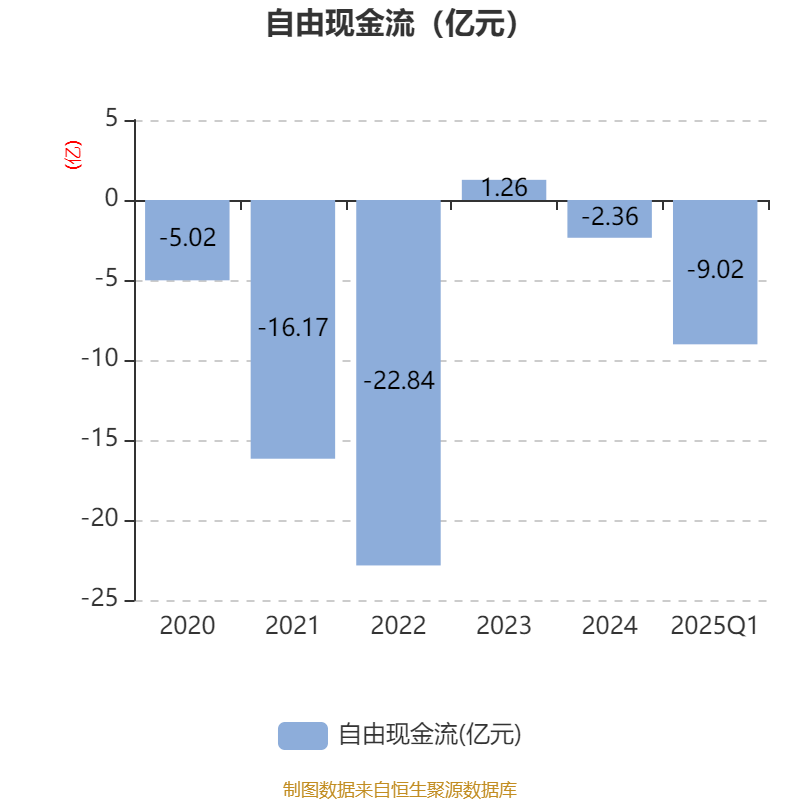
As of the end of the first quarter of 2025, the company's net cash flow from operating activities was -490 million yuan, a year-on-year decrease of 109 million yuan, net cash flow from financing activities was 496 million yuan, a year-on-year decrease of 154 million yuan, and net cash flow from investment activities was -168 million yuan, compared with -176 million yuan in the same period last year.


In terms of major changes in assets, as of the end of the first quarter of 2025, the company's prepayment increased by 245.48% from the end of the previous year, accounting for 5.57 percentage points of the company's total assets, inventory decreased by 3.67% from the end of the previous year, accounting for 4.15 percentage points of the company's total assets, monetary funds decreased by 12.88% from the end of the previous year, accounting for 2.77 percentage points of the company's total assets, and notes receivable and accounts receivable increased by 40.63% from the end of the previous year. The proportion of the company's total assets increased by 2.56 percentage points.

In terms of major changes in liabilities, as of the end of the first quarter of 2025, the company's short-term borrowings increased by 42% from the end of the previous year, accounting for 7.08 percentage points of the company's total assets, contract liabilities decreased by 85.56% from the end of the previous year, accounting for 2.91 percentage points of the company's total assets, other payables (including interest and dividends) decreased by 62.17% from the end of the previous year, accounting for 1.88 percentage points of the company's total assets, and other current liabilities increased by 69.11% from the end of the previous year. The proportion of the company's total assets increased by 1.04 percentage points.


For the first quarter of 2025, the company had a current ratio of 2.02 and a quick ratio of 0.93.


According to the first quarterly report, among the top ten circulating shareholders of the company at the end of the first quarter of 2025, the new shareholders are Brizan China Holdings Limited, ChinaAMC SSE Science and Technology Innovation Board 50 Component Exchange-traded Open-ended Index Securities Investment Fund, Forebright Smart Eyes Technology Limited, E Fund SSE Science and Technology Innovation Board 50 Component Exchange-traded Open-ended Index Securities Investment Fund, Hong Kong Securities Clearing Company Limited, It replaced the Invesco Great Wall Fund China Life Growth Equity Portfolio Single Asset Management Plan (available for sale) and Invesco Great Wall Electronic Information Industry Equity Securities Investment Fund at the end of the previous year. In terms of specific shareholding ratios, the holdings of Invesco Great Wall Research Select Equity Securities Investment Fund have increased, and the holdings of Huaxin Investment Management Co., Ltd. - National Integrated Circuit Industry Investment Fund Phase II Co., Ltd., Gongqingcheng Sizhiwei Technology Industry Investment Partnership (Limited Partnership), Ma Weijian, and Harvest SSE Science and Technology Innovation Board Chip Exchange-based Open-ended Index Securities Investment Fund have declined.
| shareholder name | number of shares outstanding (10,000 shares). | Proportion of total share capital (%) | Change Ratio (percentage points) |
|---|---|---|---|
| Huaxin Investment Management Co., Ltd. - National Integrated Circuit Industry Investment Fund II Co., Ltd | .2954.36 | 7.352-0.039 | |
| Brizan China Holdings Limited | 2340.22 | 5.8237 | New |
| Gongqingcheng Sizhiwei Technology Industry Investment Partnership (Limited Partnership) | 1714.86 | 4.2674-0.028 | |
| Ma Weijian | 1640.48 | 4.0824-0.022 | |
| ChinaAMC SSE STAR Market 50 Component Exchange-traded Open-ended Index Securities Investment Fund | 1394.77 | 3.4709 | New |
| Forebright Smart Eyes Technology Limited | 1202.73 | 2.993 | New entrant |
| E Fund SSE Science and Technology Innovation Board 50 Component Exchange-traded Open-ended Index Securities Investment Fund | 1125.56 | 2.801 | New |
| entrant Invesco Great Wall Research Select Equity Securities Investment Fund | 646.26 | 1.6082 | 0.391 |
| Harvest SSE Science and Technology Innovation Board Chip Exchange-traded Open-ended Index Securities Investment Fund | 603.3 | 1.5013-0.007 | |
| Hong Kong Securities Clearing Company Limited | 582.78 | 1.4502 | new |

Proofreading: Yang Ning
Indicator Annotation:
P/E ratio = total market capitalization / net profit. When the company loses money, the P/E ratio is negative, and it is not practical to use the P/E ratio for valuation, and the P/B ratio or P/B ratio is often used as a reference.
Price-to-book ratio = total market capitalization / net assets. The price-to-book ratio valuation method is mostly used for companies with large fluctuations in earnings and relatively stable net assets.
Price-to-sales ratio = total market capitalization / operating income. The price-to-sales ratio method is often used for growing companies that are losing money or making small profits.
The price-to-earnings ratio and price-to-sales ratio in this article are calculated using the TTM method, that is, the data for the 12 months up to the latest financial report (including forecast). The price-to-book ratio is calculated using the LF method, that is, based on the latest financial report data. The quantile calculation range of the three is from the company's listing to the latest announcement date.
When the P/E ratio and price-to-book ratio are negative, the current quantile is not displayed, which will cause the line chart to be interrupted.
Ticker Name
Percentage Change
Inclusion Date


