 China’s Surprising Industrial Recovery
(Yicai Global) June 16 -- Friedrich Nietzsche said that whatever didn’t kill him made him stronger. The German philosopher’s aphorism can be aptly applied to China’s industrial sector, whose enterprises have emerged from the pandemic larger, more profitable and less levered.
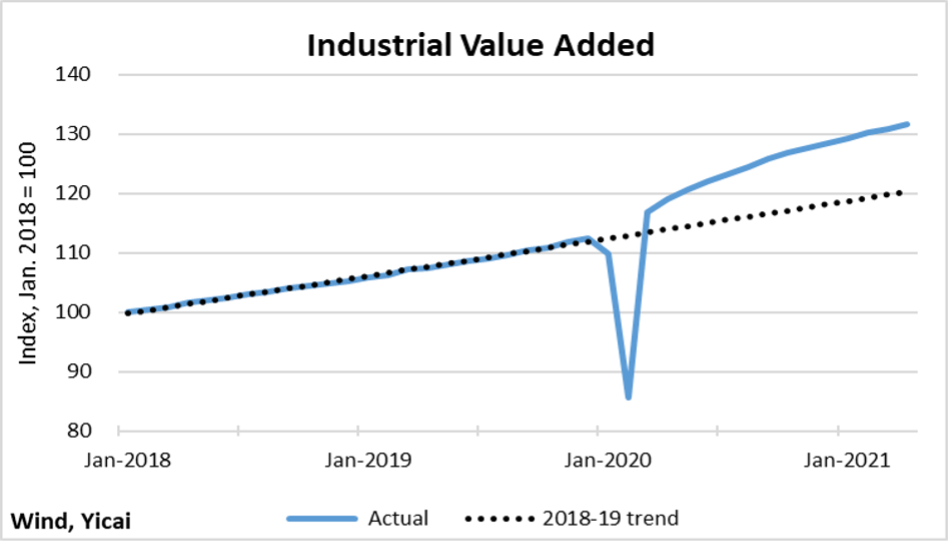
Wild swings in the data and large price movements make it difficult to assess just how much more output has emerged from Chinese factories this year. Thankfully, the National Bureau of Statistics provides the monthly percent increase in industrial value added. From these changes, we can construct an index, which is free of problematic year-over-year comparisons and the run up in industrial prices.
We start the index at 100 in January 2018 and run it out to April 2021. We also calculate the trend value of the index over 2018-19 – the pre-pandemic period – and extend it as well. Figure 1 shows that actual industrial value added fell 24 percent between December 2019 and February 2020. Subsequently, its recovery has been nothing short of dramatic. By April 2021, industrial value added was 9 percent above the pre-pandemic trend. With trend growth at 6.4 percent, that means that actual industrial value added is about 17 months ahead of where we might have forecast on the eve of the pandemic.
Figure 1
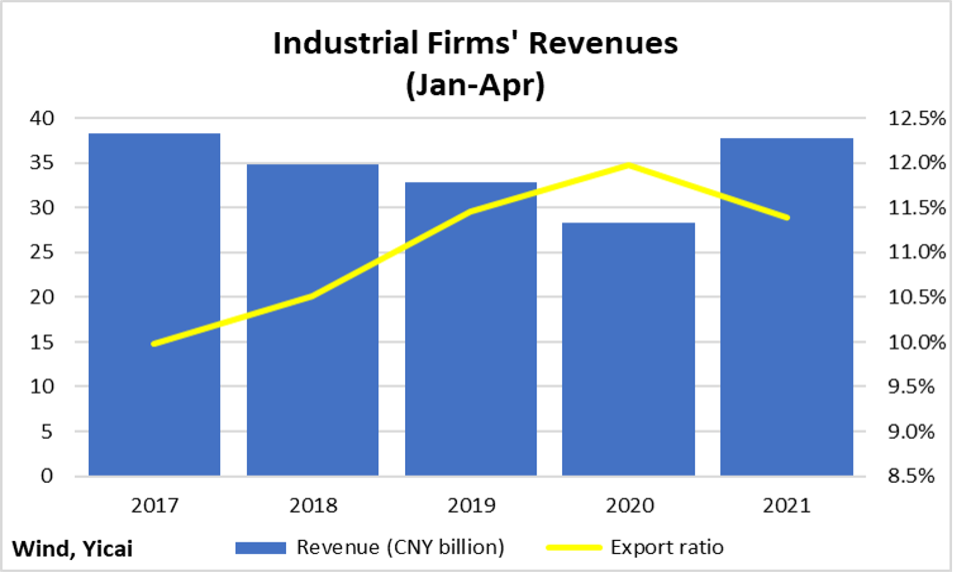
As you might expect, with output soaring and prices rising, industrial firms’ revenues spiked this year. You may not have realized that this year’s increase breaks a trend of falling revenues that pre-dates the pandemic.
Figure 2 shows industrial firms’ revenues for the January–April period over the recent past. This year, revenues were up by 33 percent from 2020 and by 15 percent from 2019. Figure 2 also shows that strong domestic demand has been the major driver of revenue growth this year. The share of sales that came from exports declined from 2020. At 11.4 percent, it is also a touch below the export ratio in 2019.
Figure 2
China is a major consumer of industrial inputs such as crude oil, iron ore and copper. As a result of the global rebound in demand and ongoing constraints on supply, the prices of these inputs have increased sharply this year. Surprisingly, Chinese industrial firms have been able to manage this rise in costs and have actually increased their profitability.
Figure 3 shows that industrial firms’ profit margins (profits divided by revenue) rose sharply in the first four months of the year from the same period in recent years. So far this year, margins are close to 7 percent, up from 5 ½ to 6 percent in the pre-pandemic period.
Figure 3
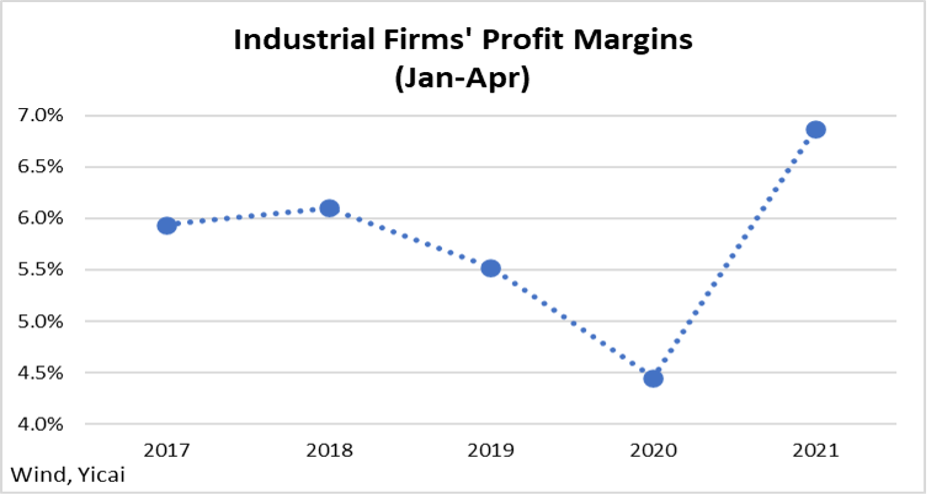
Table 1 presents the change in profit margins between 2019 and 2021 for the three major industrial sectors. With the rise in global commodity prices, it is no surprise that margins increased the most in the mining sector (which includes crude oil and natural gas extraction). What is, perhaps, more surprising is that the manufacturing sector, which uses these higher-priced inputs, was also able to increase its margin by a significant amount.
The price increases appear to dissipate as they move through the industrial chain, with only a limited amount passed on to the end consumer. China’s producer price index rose by 9 percent year-over-year in May. This was its most rapid rate of increase in close to 13 years. However, the rise in the consumer-good sub-component was much more muted: ½ a percent. The ability of the manufacturing sector to both absorb the cost increase and raise profitability is really quite surprising!
Table 1:
Profit Margin by Industrial Sector
| Jan- Apr | Jan- Apr | Change | |
| Mining | 15.0% | 12.4% | 2.6% |
| Manufacturing | 6.6% | 5.1% | 1.4% |
| Utilities | 6.3% | 6.3% | 0.0% |
| Total | 6.9% | 5.5% | 1.3% |
Table 2 takes a more granular look at profitability in some of the key manufacturing sub-sectors. The pharmaceuticals sub-sector’s jump in profitability occurred even though the prices of medicines were stable. In contrast, higher pump prices for gasoline are likely boosting profitability in the fuel processing (oil refining) sub-sector. The last three sub-sectors in Table 2 are among the economically most important. They are all downstream industries which use higher-priced industrial materials. With the exception of ferrous metals, it does not appear that they are passing the increase in their costs on.
Table 2:
Profit Margin by Manufacturing Sub-Sector
| Jan- Apr | Jan- Apr | Change | |
| Pharmaceuticals | 18.4% | 12.5% | 5.9% |
| Fuel processing | 7.2% | 2.7% | 4.5% |
| Computer and telecom. | 4.8% | 2.9% | 1.8% |
| Ferrous metals | 5.2% | 3.5% | 1.7% |
| Other machinery | 6.6% | 5.5% | 1.1% |
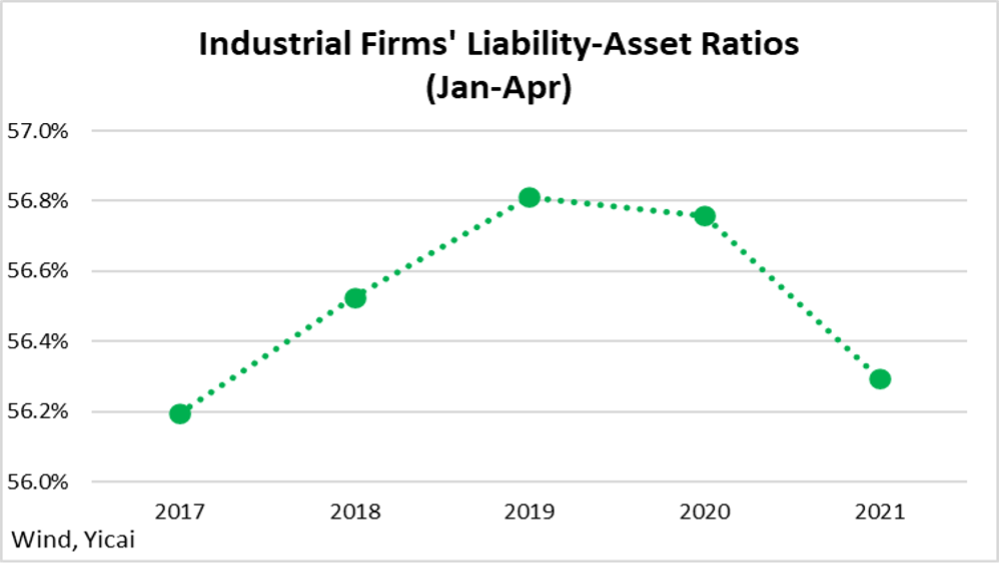
So far this year, leverage has fallen below pre-pandemic levels. Figure 4 shows the trend in aggregate leverage, as measured by the liability-asset ratio. Perhaps, China’s industrial firms are reducing their leverage because they believe that the good times are unlikely to last long. Perhaps, financial policy’s re-emphasis on deleveraging is having an effect on firms’ ability to borrow.
Figure 4
Looking at the disaggregated sector-level, we see that leverage has risen in the mining sector (Table 3). Here firms may believe that the global supply constraints will persist for some time and that raising leverage will pay off. In manufacturing and utilities, it appears that firms are happy to reinforce their financial strength.
Table 3:
Liability-Asset Ratio by Industrial Sector
| Jan- Apr | Jan- Apr | Change | |
| Mining | 60.3% | 59.9% | 0.4% |
| Manufacturing | 55.3% | 55.8% | -0.6% |
| Utilities | 59.0% | 59.7% | -0.7% |
| Total | 56.3% | 56.8% | -0.5% |
Looking to the rest of the year, I think that further above-trend growth is unlikely. The coming month-over-month increases in industrial value added could well fall below the ½ a percent that underlay the 2018-19 trend. Firms will continue to explore efficiencies that increase profitability. And, as financial policy remains tight, they will look for opportunities to reduce leverage.


