 The Macroeconomic Takeaways From China’s Two Sessions
(Yicai) March 15 -- At the recently concluded , the government outlined a wide range of policies for the coming year. In terms of the macroeconomy, the target for GDP growth attracts the most attention. As in 2023, the government set the target at “around 5 percent” (Figure 1). The target is just below the 5.2 percent realized last year and it is in line with the expectations of the Chief Economists by the Yicai Research Institute.
Figure 1
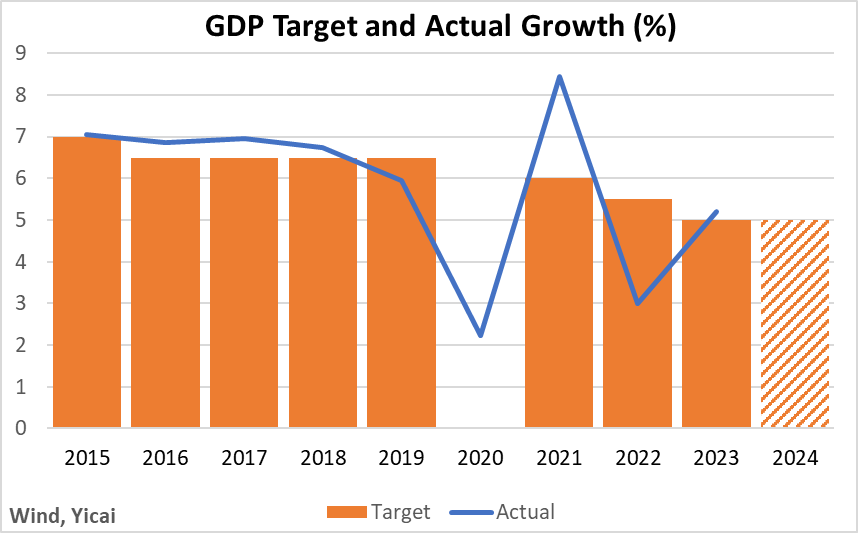
A 5 percent target represents a marked deceleration from the 6.5 percent the government targeted over 2016-19. The key macroeconomic question is whether this points to a slowdown in aggregate supply as well as aggregate demand (which is typically taken to be actual GDP growth). If the slowdown is confined to aggregate demand, then it would be cyclical and the policy prescription would be to stimulate demand via more accommodative fiscal and monetary policy. If aggregate demand and aggregate supply have both slowed, then the deceleration would be structural. In this case, stimulative macro policies would not boost GDP growth. They would only lead to higher inflation.
Aggregate supply is unobserved and is challenging to estimate. As China makes progress in catching up to the productive frontier, it is reasonable to expect a structural slowdown in GDP growth. Indeed, growth has slowed – from 8.2 percent in 2011-14 to 6.9 percent in 2015-19. The question is how much of the weakness in GDP growth since 2019 is structural and how much reflects insufficient demand.
One way to address this question is to compare actual GDP growth with the forecast the IMF made before the pandemic hit in October 2019. The Fund assumed that China’s GDP growth would average 5.8 percent over 2020-24, a deceleration of just over 1 percentage point from the previous four-year period. It forecast 5.5 percent for 2024.
Figure 2 compares the level of GDP implicit in the Funds’ 2019 forecast to realized GDP and the government’s 2024 target. If the Fund’s 2019 forecast does represent China’s aggregate supply, then there has been significant excess supply (insufficient demand) in recent years. The excess supply gap will reach 4.4 percent of the forecast level if the economy grows by 5 percent this year.
Figure 2
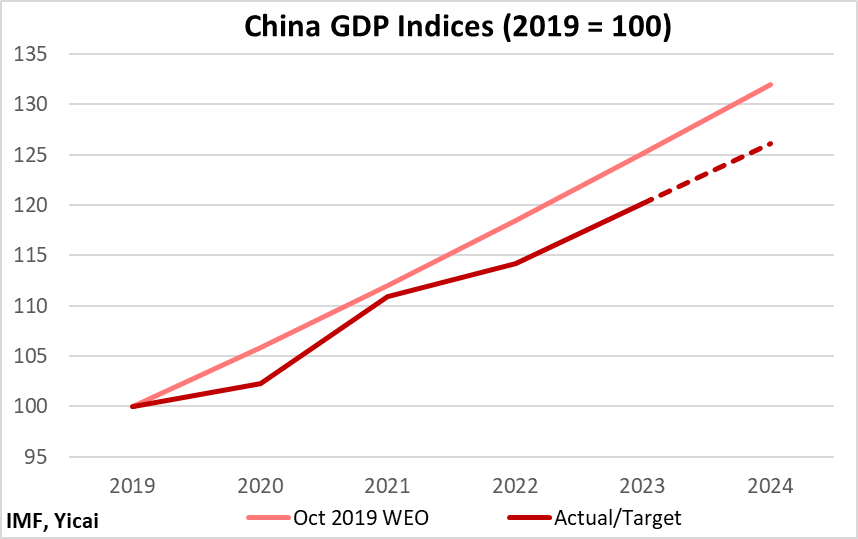
Of course, China’s aggregate supply could be lower than the 2019 forecast. The IMF may have been too optimistic about China’s growth prospects. Or the pandemic may have permanently lowered the level and growth rate of aggregate supply. In fact, the IMF has turned bearish on China, it now forecasts just 4.6 percent growth this year.
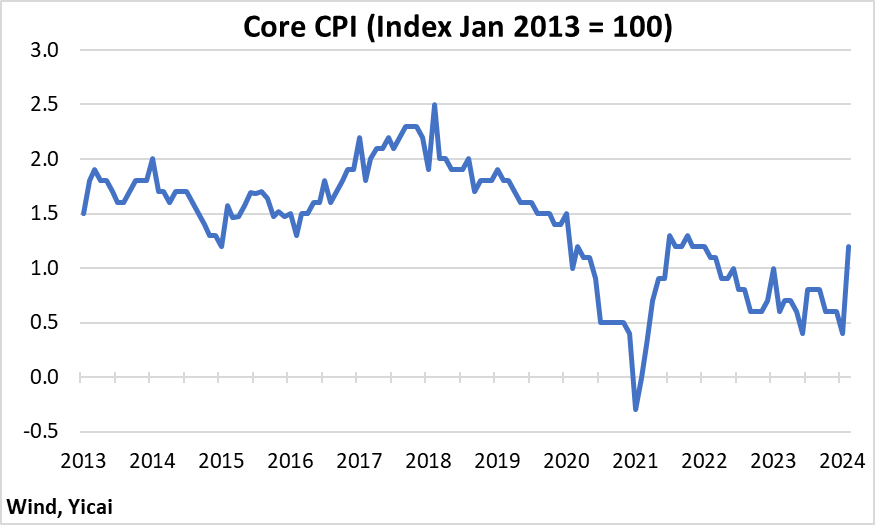
Still, the excess supply gap depicted in Figure 2 is consistent with the fall we have observed in core CPI inflation (Figure 3). Core inflation dropped precipitously in 2020 as the excess supply gap opened. It rose in 2021 as the gap narrowed and it declined once more as the gap widened again. Note that core inflation rose to 1.2 percent in February, its highest rate in two years. Much of this spike in prices came from higher travel services, as households spent record amounts during the Lunar New Year.
Figure 3
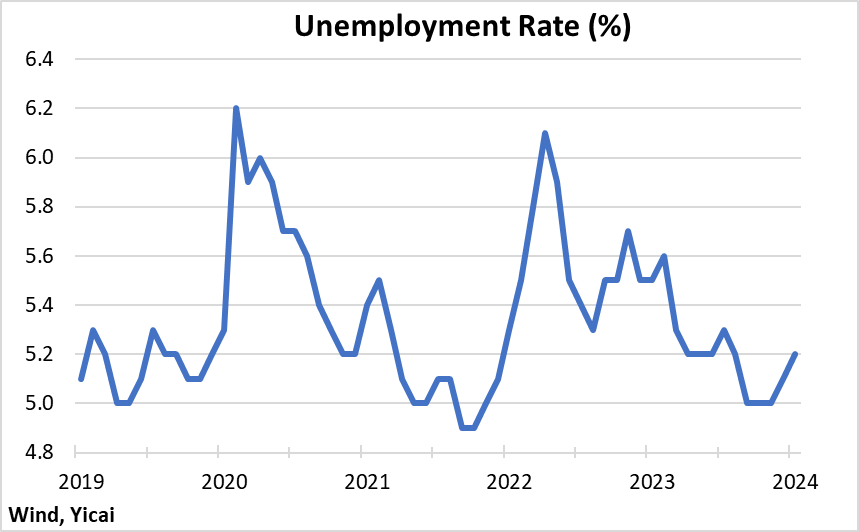
While it is hard to be sure what the extent of the excess supply gap is, it is clear that the government is not pushing to close it this year. There are two reasons for this. First, since the working-age population is shrinking, the labour market appears to be in rough balance even if aggregate demand is well below aggregate supply. Since the second quarter of last year, the surveyed urban unemployment rate has been at its pre-pandemic level (Figure 4). The government is targeting an unemployment rate of 5.5 percent but I take this to be a ceiling rather than a forecast. We could expect additional stimulative policy if the unemployment rate were to exceed 5.5 percent.
Figure 4
Second, the government understands that excessive policy stimulus entails risks that could undermine the sustainability of the economy’s growth over the medium term. In his , Premier Li speaks of defusing risks in real estate, local governments and small- and medium-sized financial institutions to “safeguard overall economic and financial stability.”
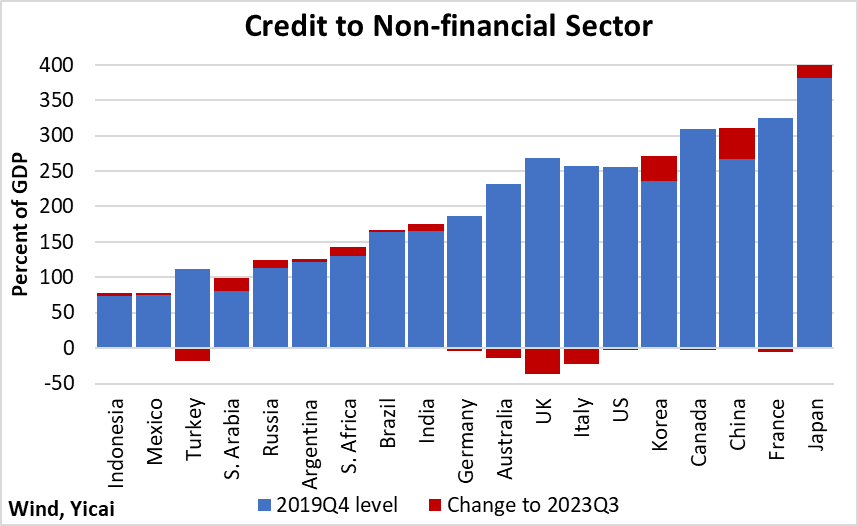
These risks are best illustrated by economy-wide leverage, measured as credit to the non-financial sector as a percent of GDP. These data are by the Bank for International Settlements and sum up the debt of households, non-financial corporations and governments. China’s leverage is just over three times its GDP (Figure 5). This is high for a G20 country but it is not off of the charts – China fits snugly between Canada and France.
It is the recent trend in China’s leverage that is more of a concern. Between 2019Q4 and 2023Q3, China’s leverage rose by 44 percent of GDP. This was the largest increase among the G20 countries, ahead of Korea (+36 percent of GDP), Japan and Saudi Arabia (both at +18 percent of GDP).
Figure 5
While rising leverage argues for prudence in policy support, the government is not standing by idly. Premier Li said the government would “… Appropriately enhance the intensity of our proactive fiscal policy and improve its quality and effectiveness.” My reading of the suggests that the government will provide fiscal stimulus equivalent to 1 percent of GDP in 2024, compared to a minor fiscal drag in 2023.
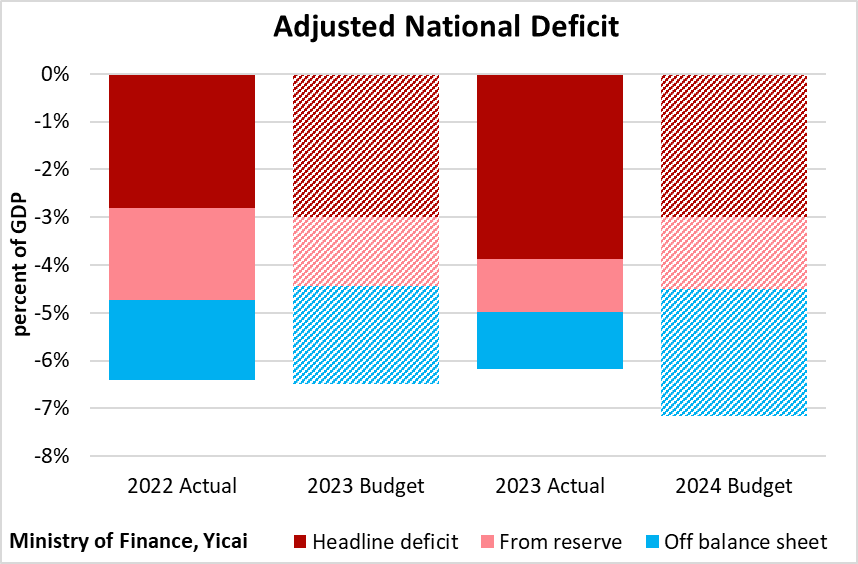
It is not easy to decipher China’s fiscal accounts. The government reports on an accrual basis. In recent years, it has drawn on its fiscal reserve and it has accounted for these drawings as revenue. When the government finances its expenditures through taxes, it essentially sucks some spending power out of the private economy. When it uses the money in its reserve to pay, the negative effect on private spending is much more modest. From a macroeconomic point of view, it’s best to look at the government balance on a cash, rather than an accrual, basis.
The budget document also reports the accounts of three classes of off-balance sheet funds: the social security fund, the capital budget of state-owned firms and other government-managed funds. On a cash basis, the first two of these run surpluses while the third runs a deficit. Their overall deficit is dominated by local government-managed funds, which account for real estate-related revenues and expenditures.
To assess the stimulative impact of general government-related activity, I add the funds drawn from the fiscal reserve and the deficit of the off-balance sheet funds to the headline deficit (Figure 6). Adjusted in this way, the national deficit is budgeted to reach 7.2 percent of GDP this year. This compares to actual adjusted national deficits of 6.2 percent of GDP in 2023 and 6.4 percent in 2022.
Figure 6
With respect to monetary policy, Premier Li said that the government would “… Improve the monetary policy transmission mechanism to prevent funds from sitting idle or simply circulating within the financial sector.”
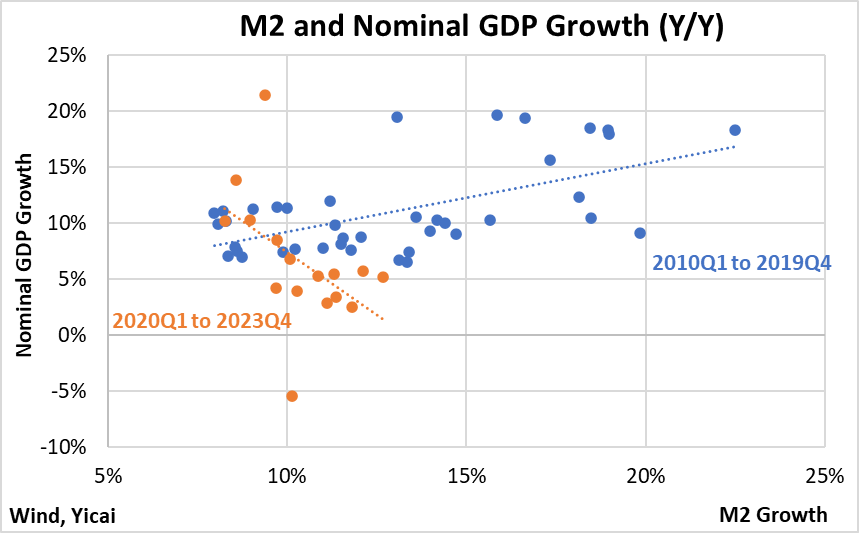
It does appear that the monetary policy transmission mechanism lost some effectiveness in recent years. Between 2010Q1 and 2019Q4, a 1 percentage point increase in M2 growth was associated with a 0.6 percentage point increase in the growth of nominal GDP (Figure 7). Between 2020Q1 and 2023Q4, the average year-over-year increase in M2 was 10 percent. But this increase in the money supply had no apparent effect on nominal GDP growth.
Figure 7
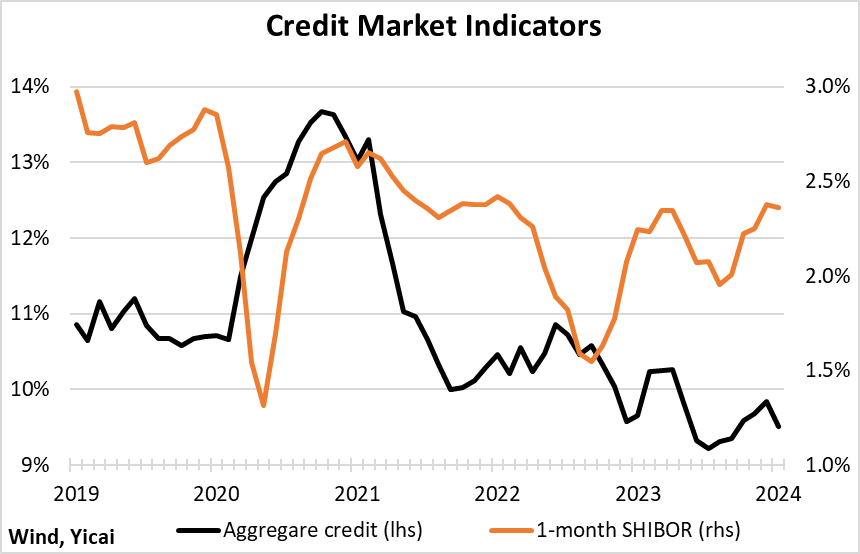
Credit demand continues to weaken. Despite lower nominal interest rates, its growth rate has fallen to 9½ percent from close to 11 percent in 2019 (Figure 8). Part of the problem is that the drop in inflation has been greater than the reduction in nominal rates such that real (PPI-deflated) interest rates are about 2 percent higher now than they averaged in 2019.
Figure 8
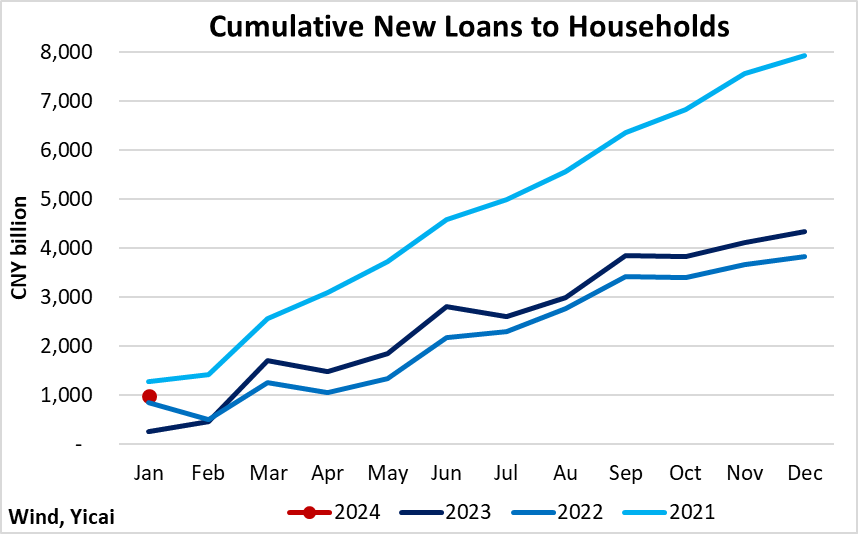
While high real rates are likely suppressing firms’ demand for loans, there are emerging signs that consumers are ready to resume borrowing. Close to CNY 1 trillion in new loans were issued to households in January. This is up from CNY 257 billion last January and CNY 843 billion in January 2022 (Figure 9).
Figure 9
In the face of modest economic stimulus, some observers doubt that 5 percent growth can be achieved. The headline of a recent Financial Times reads, “China lacks a credible policy to meet its own growth target”.
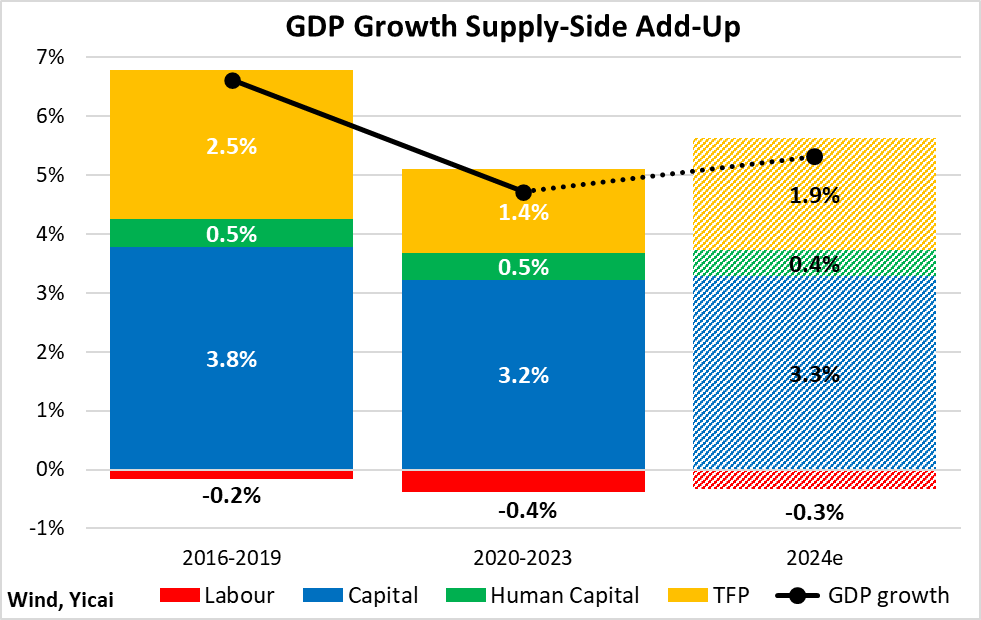
To see where growth is likely to come from, it is useful to look at a analysis of the supply side of the economy.
Let’s begin with the evolution of China’s labour supply. The economically active population is shrinking, and overall employment began to fall in 2018. In line with the UN’s projections for China’s working-age population, we forecast that this decline will take 0.3 percentage points off of growth in 2024 (Figure 10).
We construct the “productive” capital stock, using the perpetual inventory method, from real gross capital formation excluding residential real estate investment. Real productive capital stock growth should add 3.3 percentage points to GDP growth, a bit more than over 2020-23 but much less than in 2016-19.
We assume that human capital will continue to grow in line with the average worker’s years of schooling. It should add 0.4 percentage points to growth in 2024.
Total factor productivity (TFP) is a measure of economic efficiency. It is the most volatile component of the supply-side add-up and the most difficult to forecast. I assume that it will add 1.9 percentage points to growth in 2024. This is about mid-way between the 2016-19 and 2020-23 period averages.
In sum, I expect that the supply side of the economy could grow by 5.3 percent this year.
Figure 10
First among the major tasks for 2024 in Premier Li’s Work Report was modernizing the industrial system and accelerating the development of “new quality productive forces”. The government explicitly wants to raise the rate of TFP growth by encouraging innovation.
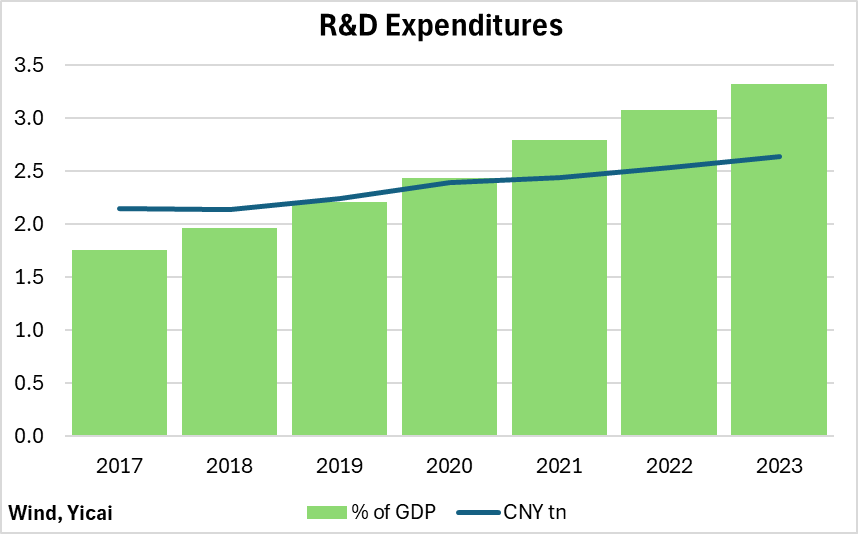
One of the tools for unleashing the new quality productive forces is investment in research and development. Since 2017, research and development expenditures have risen by close to 90 percent. As a share of GDP, they increased from 2.15 to 2.64 percent (Figure 11).
Looking ahead, the government wants to orient its research and development spending to AI and big data, health and elderly care and green technologies.
Figure 11
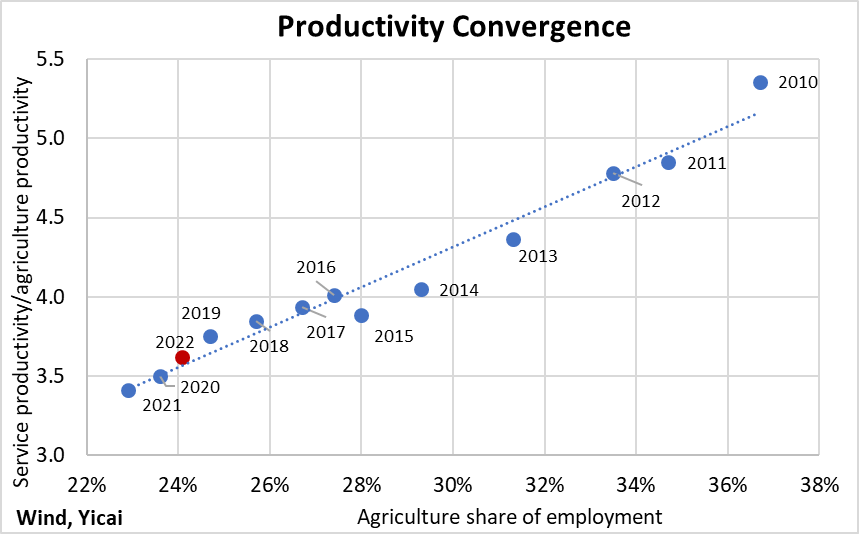
Another way to increase TFP growth is to optimize the deployment of the labour force. Just over 24 percent of the labour force was employed in agriculture in 2022. This is down from 37 percent in 2010. Over the same time, the share of workers in services rose from 35 to 47 percent. This reallocation of labour has led to a convergence in the productivity of the two sectors (Figure 12) and it has been an important source of TFP growth.
The process of optimizing the labour force is far from complete. Service sector workers are still some 3.6 times as productive as those in agriculture. Moreover, employment in agriculture increased in 2022, reversing a multiyear trend.
The government is keen to make sure that labour is sufficiently mobile. Premier Li’s Work Report speaks of the need to reform the urban registration system. It will make “a matter of priority” of expediting urban residency for those who have moved to cities from rural areas. It will also give urban residents without local household registration equal access to basic public services.
Figure 12
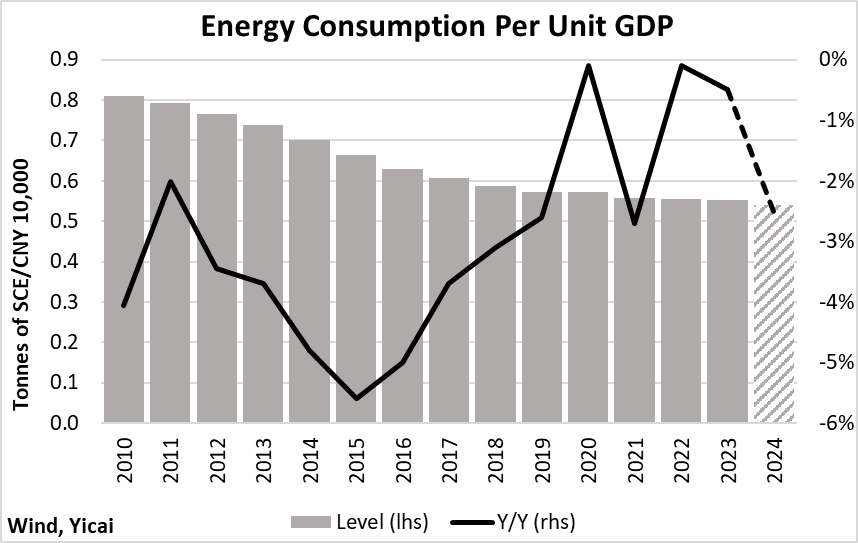
Among the government’s quantitative targets for 2024 is a 2.5 percent reduction in energy consumption per unit GDP. Gains in energy efficiency slowed during the pandemic period, with energy consumption per unit GDP only falling by 3.4 percent between 2019 and 2023 (Figure 13). The government’s renewed focus on energy efficiency is a sign of its confidence in the economy.
The Work Report re-commits to peaking carbon emissions and achieving carbon neutrality. It envisions continued building of large-scale wind and photovoltaic power bases and energy transmission systems.
Experts believe that, on the basis of large investments in wind and solar power last year, China’s emissions may have already peaked. Nevertheless, the World Bank that it will take between $14-17 trillion in investments for China to achieve carbon neutrality by 2060. This is the equivalent of 78 to 94 percent of GDP and suggests that there are many useful investments still to be made.
Figure 13
The policies announced during the Two Sessions represent a difficult balancing act between economic development, financial stability and environmental remediation. Some may have been disappointed that the government did not present a plan to close the excess supply gap through more aggressive stimulative measures. While such a short-term approach may be effective in boosting the stock market, it would do little to ensure sustainable macroeconomic development.
 Mark KrugerBased in Shanghai, Mark Kruger holds Senior Fellow appointments at the Yicai Research Institute, the Centre for International Governance Innovation and University of Alberta’s China Institute. Between 2020 and 2023, Mark was the Opinion Editor at Yicai Global. Previously, he had a 30-year career with the Bank of Canada in the course of which he served as a Senior Advisor to the Canadian Executive Director at the IMF and the head of the Economic and Financial Section of the Canadian Embassy in Beijing.


