 How Big an International Investor is China?
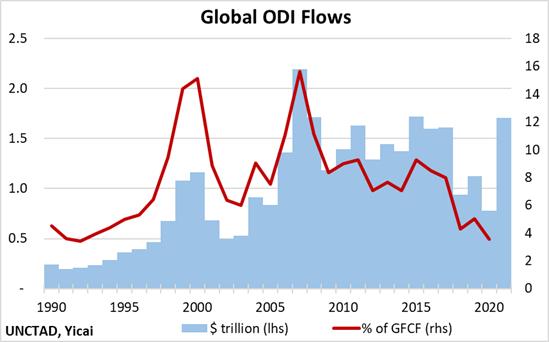
 (Yicai Global) Sept. 17 -- Global overseas direct investment (ODI) rose nine-fold – from $243 billion to $2.2 trillion – between 1990 and 2007, as firms left home and built new plants, or purchased existing ones, in other countries (Figure 1).
ODI is defined as a foreign investor acquiring a minimum 10 percent interest in a domestic enterprise. It establishes a long-term relationship between the foreign investor and the domestic enterprise and is generally seen as a stable form of cross-border capital flows. Certainly, it is easier for investors to sell their holdings of foreign stocks and bonds than it is to divest of a physical asset, like a factory. The stable, long-term relationships that ODI creates build global supply chains, lower production costs and raise living standards. They help knit the world together.
ODI averaged $1.5 trillion between 2010 and 2017 or 8 percent of global gross fixed capital formation (GFCF). With the rise of protectionism and a backlash against globalization, ODI slumped to $1.0 trillion, on average, in 2018-19, or the equivalent of 5 percent of GFCF. After the outbreak of the pandemic in 2020, ODI slipped again before rebounding last year. Even with last year’s strong performance, ODI over 2018-21 remained 24 percent below the 2010-17 average.
Figure 1
In addition, the sources of ODI have evolved. Many smaller European countries, like the Netherlands, Switzerland and Ireland, became less important sources of ODI over the last four years, while larger ones like Germany and France invested relatively more overseas. Asian countries, including China, Japan and Korea, all increased their shares of global direct investment outflows.
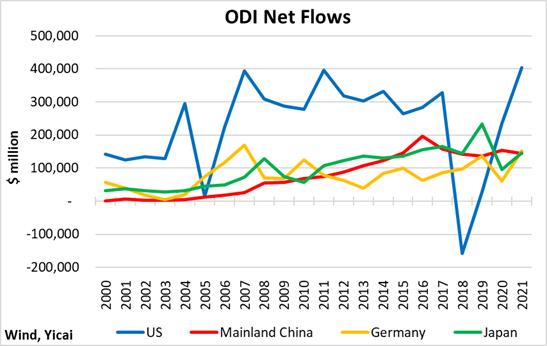
The US has been, by far, the dominant global direct investor (Figure 2). Still, Mainland China’s rise has been striking. It accounted for less than 1 percent of global ODI between 2000 and 2007. Its share rose to just under 14 percent, on average, over the last four years. In 2021, it ranked fourth, behind the US Germany and Japan, although the gap between 2nd and 4th place was very small.
Figure 2
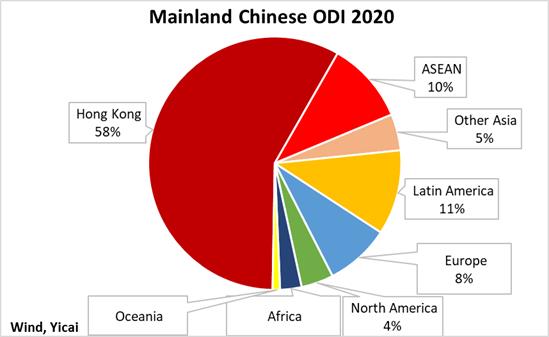
Close to three-quarters of Mainland China’s direct investment remains in Asia, with the lion’s share going to Hong Kong (Figure 3). Outside of Hong Kong, the ASEAN countries are an important destination for the Mainland’s foreign investment. Even here, however, the Mainland has ranked fourth – behind the US, the EU and Japan – in terms of its importance as a source of foreign investment.
In recent years, 80-90 percent of Mainland China’s ODI flows to Latin America went to Grand Cayman and the British Virgin Islands, which are well-known jurisdictions for offshore companies and it is unclear where these investment flows ultimately end up.
Figure 3
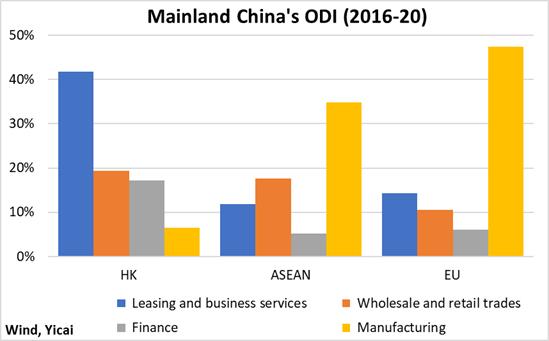
The nature of the Mainland’s investments in Hong Kong appears to be quite different from those made in other countries (Figure 4). For example, leasing and business services attract the largest share of the Mainland’s ODI in Hong Kong. In contrast, manufacturing is a more important destination for its investments in ASEAN and EU countries.
Figure 4
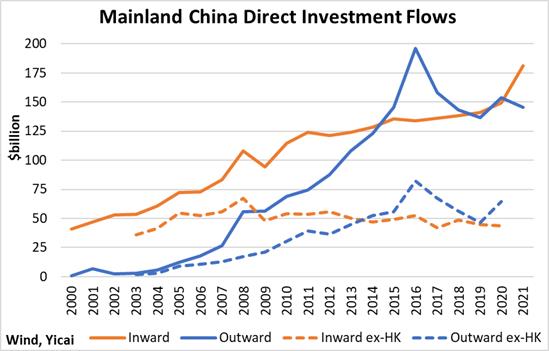
The Hong Kong and Mainland economies are tightly linked and large volumes of direct investment cross the border in both directions. Direct investment flows from the Mainland to Hong Kong account for close to 60 percent of its overall ODI. And Hong Kong supplies about two-thirds of the foreign direct investment received by the Mainland.
Figure 5 shows investment flows out of and into the Mainland with and without Hong Kong. Taking out the Hong Kong flows, we see the turning point in 2014, when the Mainland clearly became a net supplier of direct investment flows to the rest of the world.
Figure 5
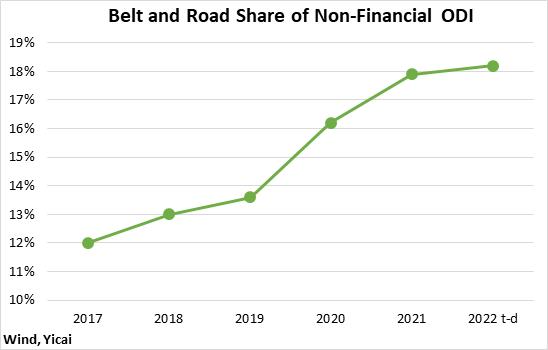
Much of Mainland China’s ODI flows to countries participating in the , a series of projects designed to enhance regional connectivity. In 2021, countries along the Belt and Road received $20 billion in Mainland Chinese ODI. This represented 18 percent of its overall non-financial ODI. The share of ODI received by countries along the Belt and Road has risen in recent years and it continued to edge up in the first seven months of this year (Figure 6). Investments in Singapore, Indonesia, Pakistan, Malaysia, the United Arab Emirates, Thailand, Vietnam, Cambodia, Laos and Bangladesh grew .
Figure 6
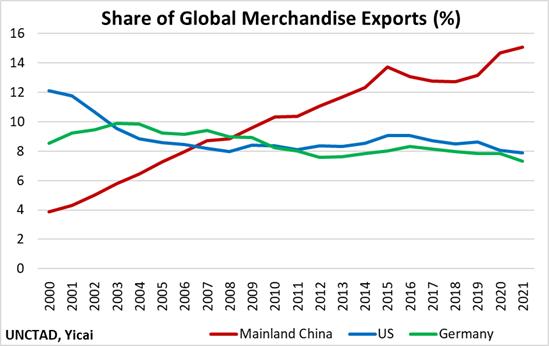
While the Mainland’s ODI flows have increased significantly in recent years, it remains a regional, rather than a global investor. Moreover, the Mainland’s rather modest role as a global investor contrasts sharply with its position in global merchandise trade. It is the world’s largest exporter, well ahead of the US and Germany, which rank second and third, respectively (Figure 7).
Figure 7
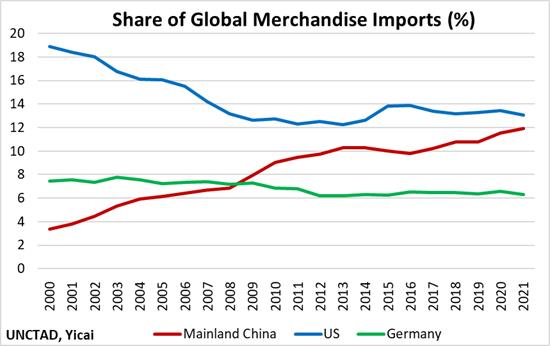
The Mainland ranks second globally in merchandise import share, behind the US and well ahead of Germany, which is in third place (Figure 8). A look at the trajectories suggests that the Mainland could become the world’s biggest importer of merchandise goods before the end of the decade.
Figure 8
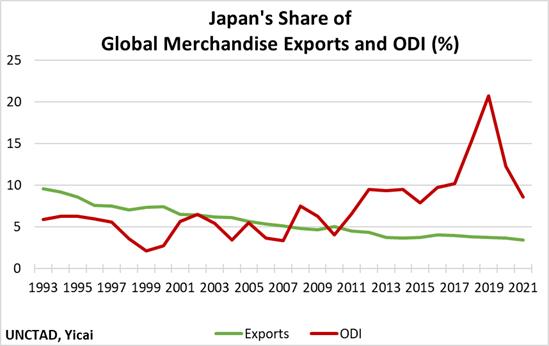
Over time, demographic pressures could lead China to pursue a Japanese-style strategy of substituting ODI for exports (Figure 9).
Japan’s share of global merchandise exports peaked at 9.6 percent in 1993 and fell to 3.4 percent in 2021, in part because the Japanese workforce got smaller and older. Japan’s share of global ODI rose from 6 in the early 1990s to 14 percent over 2019-21, as Japanese firms offshored some of their production to take advantage of more abundant labour in overseas countries.
Thus, it is not unreasonable to expect China to become a much more important source of global ODI in the years to come, as labour supply issues press on its productive capacity.
Figure 9