 2021Q2 GDP: Back on Track
(Yicai Global) July 19 -- On July 15, China’s National Bureau of Statistics (NBS) released its for the second quarter of 2021. Year-over-year growth in the quarter slowed to 7.9 percent from 18.3 percent in 2021Q1.
The year-over-year growth rates are still heavily distorted by the pandemic, which depressed GDP in 2020. A more reliable picture emerges from the quarter-over-quarter increases. As expected, the economy rebounded from 0.4 percent growth in Q1 to 1.3 percent in Q2 (the Q1 number was revised down from an originally reported 0.6 percent).
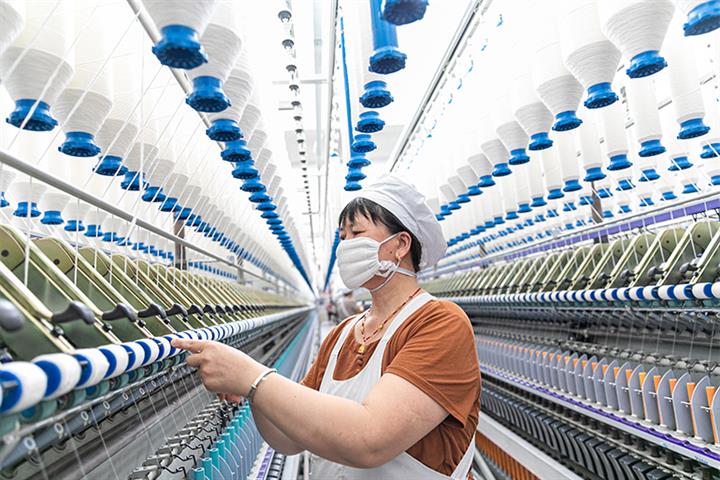
Consumption in the first quarter had been restrained by a spike in Covid infections, which dampened Chinese New Year celebrations. New Year-related travel and entertainment are important elements of the first quarter’s GDP, so the virus had a major impact on Q1’s National Accounts.
Despite a minor outbreak in Guangdong Province, the virus was well-controlled in Q2 (Figure 1). This allowed consumption to rebound and the economy to return to pre-pandemic rates of quarterly GDP growth.
Figure 1
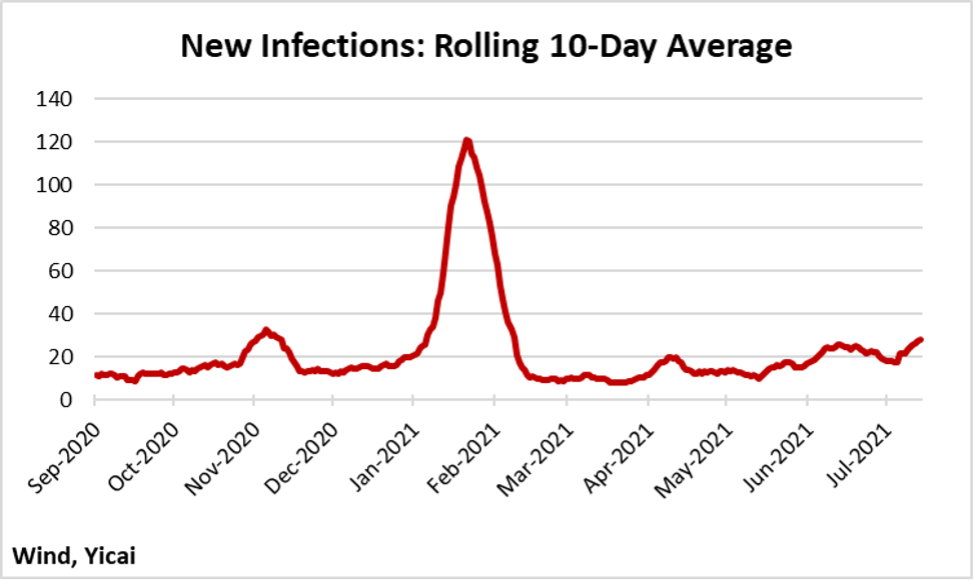 Foreign demand provided a strong boost to the economy in the second quarter. China exported USD809 billion in the April to June period, up over 30 percent from a year earlier (Figure 2). Sales to all major regions increased significantly, with those to the smaller countries contained in the “Other” category rising the most rapidly. As a result, China’s trade is becoming somewhat more diversified, which provides a kind of insurance against setbacks in a particular market.
Figure 2
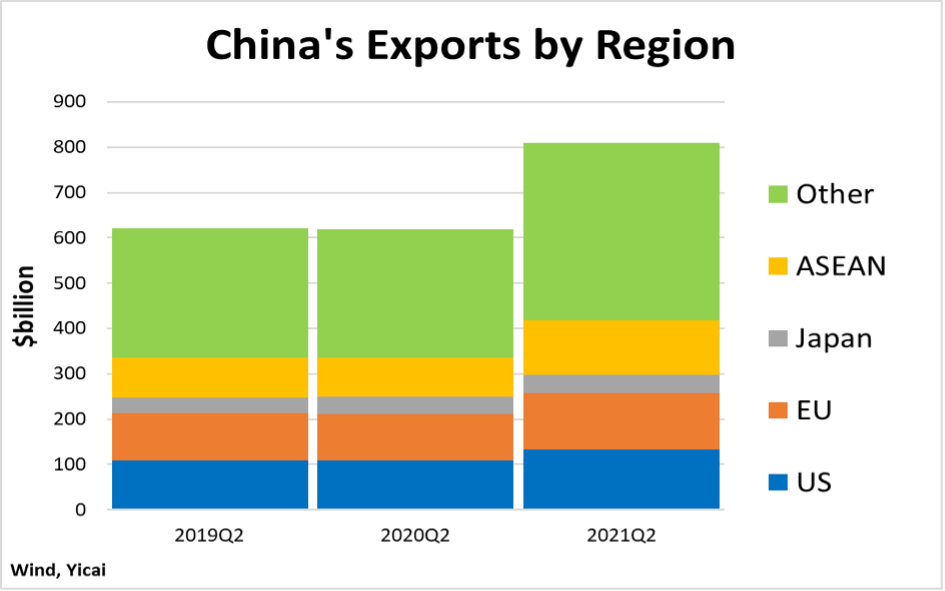
Real estate was another important growth driver. Sales of newly constructed residential floorspace were up 29 percent year-over-year in the first half, while the volume of starts was up 5 percent (Figure 3). Looking through last year’s weakness, sales were up 9 percent, on average, since the first half of 2019, while starts were down 2 percent. The weakness in starts over the two-year period is the result of a build up of inventories.
Figure 3
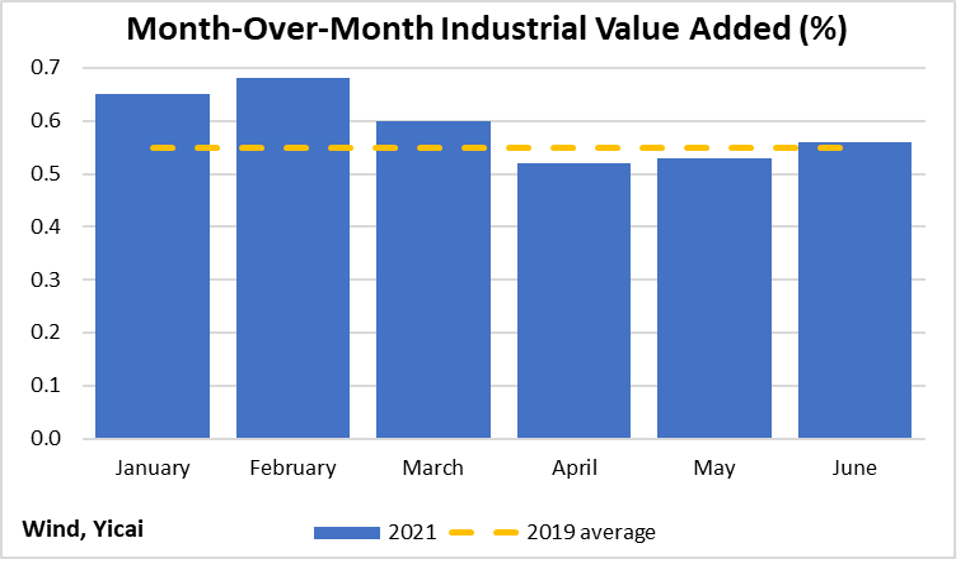
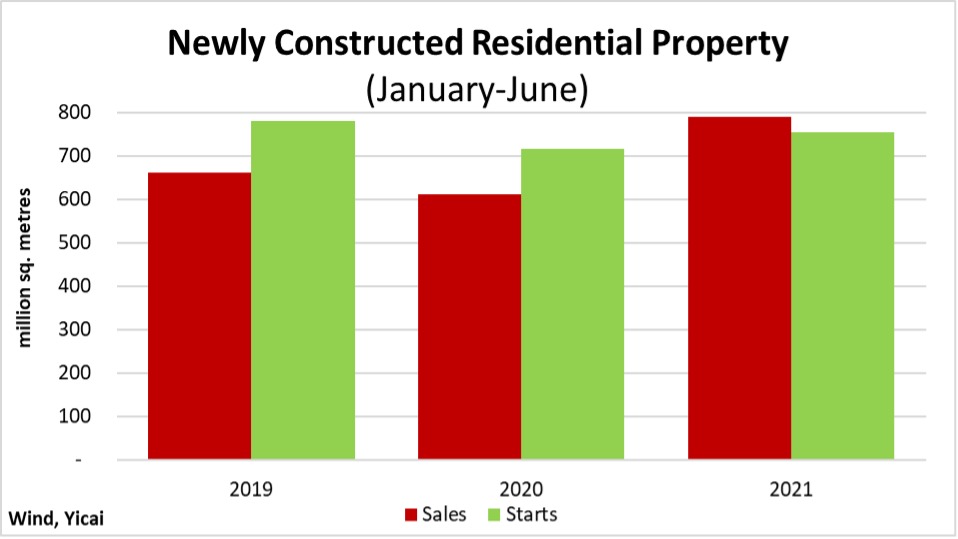 Robust foreign and domestic demand have kept China’s factories producing at their pre-pandemic pace. The monthly increases in industrial value added, which are not distorted by year-over-year comparisons, are in line with those seen in 2019 (Figure 4).
Figure 4
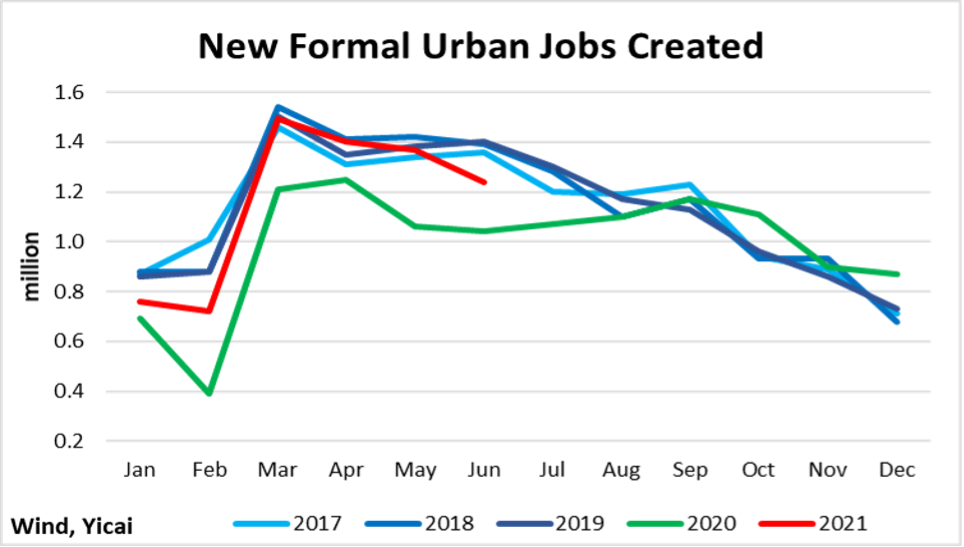
 Overall labour market conditions have tightened. New formal urban jobs created has been well above last year’s level and broadly returned to the 2017-2019 trend (Figure 5).
Figure 5
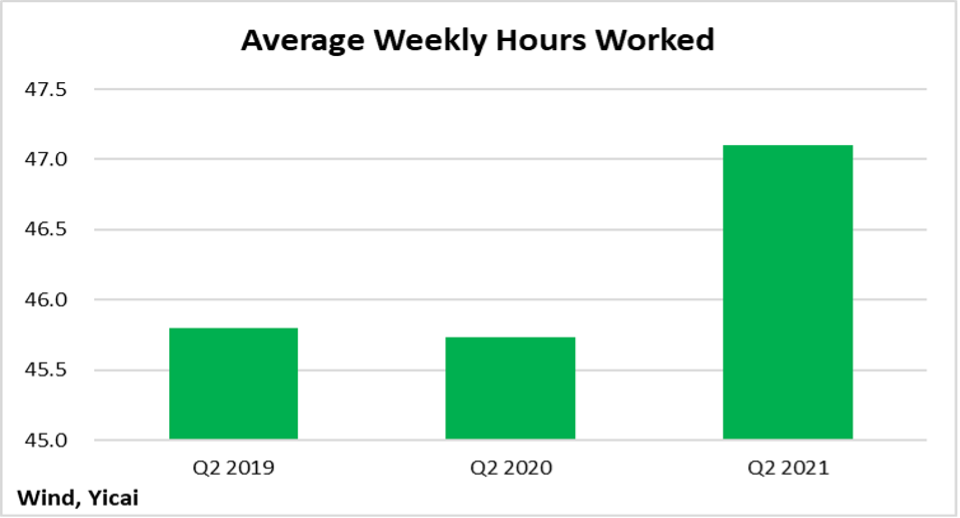
 Even though job growth has been strong, workers are putting in longer hours. The average workweek in the second quarter was 47.5 hours, compared to 45.8 hours in the same period in previous years (Figure 6). This suggests that labour supply is unable to keep up with labour demand.
Figure 6
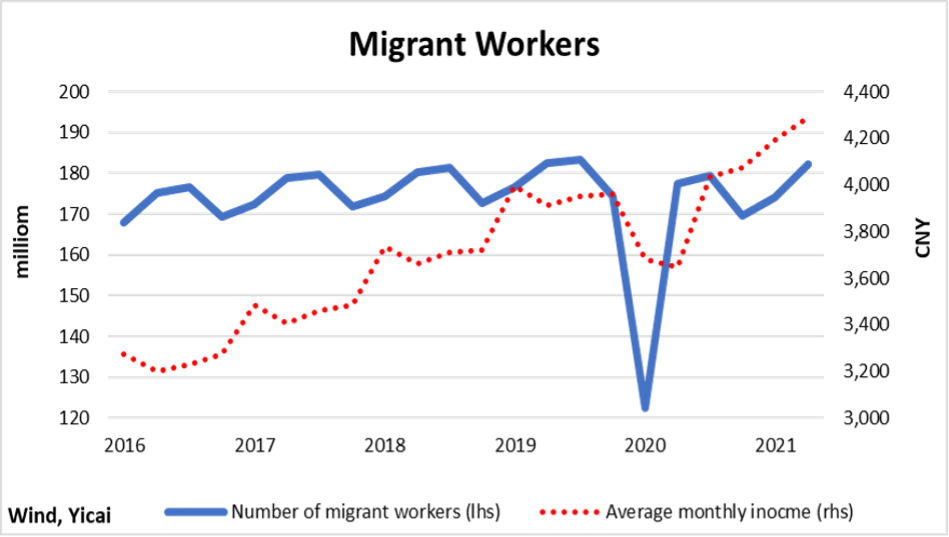
The market for migrant workers also paints a picture of strong labour demand. The number of migrant workers has just about returned to its 2019Q2 level. However, migrants’ average monthly income is 10 percent higher than it was two years ago (Figure 7).
Notwithstanding the strong demand for labour, the unemployment rate for those aged 16-24 jumped to 15.4 percent, its highest level in 10 months. The NBS attributes this to college students graduating this year.
Greater certainty about employment prospects appears to be underpinning consumer confidence. Amid pandemic-related concerns and fears that the demand for many service sector jobs could be slow to materialize, the household savings rate surged in 2020. Even in the first quarter this year, the savings rate was only slightly lower than during the worst of the pandemic (Figure 8). The good news is that the savings rate dropped sharply in Q2 and has approached its pre-pandemic level.
Figure 8
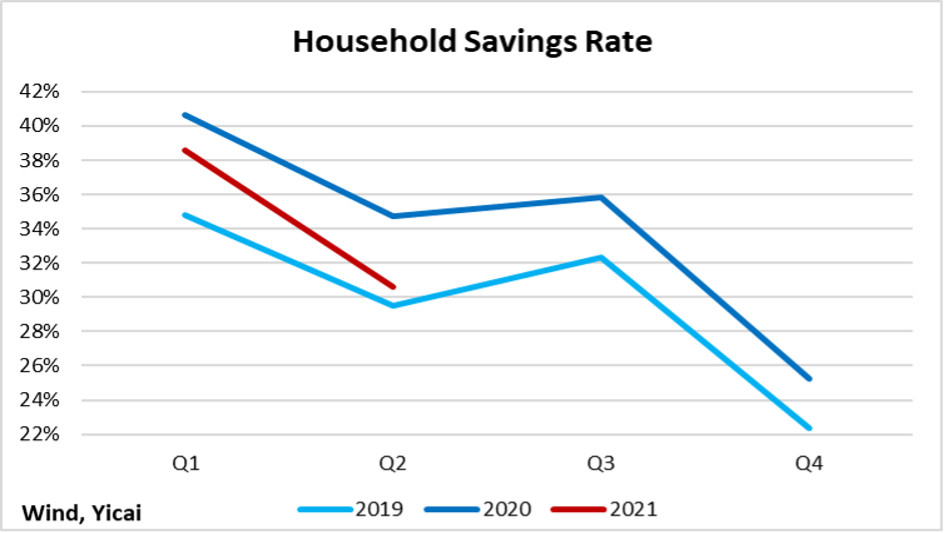
With the demand for precautionary saving falling, households are becoming more inclined to spend. Real household expenditure was up 18 percent, year-over-year, in 2021Q2. Two-year average growth was just over 7 percent, in the quarter. This is a marked improvement from 2020, when real household expenditure actually contracted.
Looking toward the second half of the year, we continue to expect quarter-over-quarter growth to be in line with the 2019 average of 1.4 percent. Should this come to pass, growth for the year would come in at 8.5 percent.
The GDP outturn in Q2 was a touch softer than the 8.3 percent forecast by the . Is it possible that the economy is losing steam?
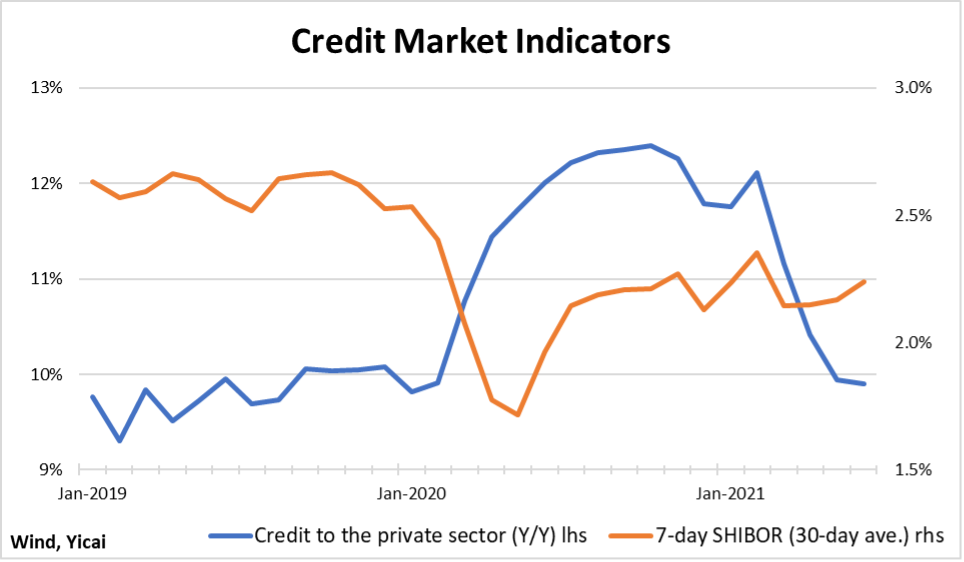
Credit market developments seem to indicate a fall in the demand for funds. The growth rate of credit to the private sector slowed sharply in the first half of the year. At the same time, short term interest rates remain below their 2019 levels (Figure 9). The combination of slower credit growth and lower interest rates suggests that weak credit demand, rather than a monetary tightening, is at work.
Figure 9
 The People’s Bank of China added to concerns over the strength of the economy last week when it cut the required reserve ratio. The move caught the market by surprise and it suggested to some observers that the recovery might be stalling.
I believe that it is too early to panic.
First, as argued above, when growth is observed on a sequential (quarter-over-quarter) basis, momentum is rising, not falling.
Second, the decline in the demand for credit is consistent with slower fixed asset investment growth. The NBS reported that two-year average fixed asset investment growth was 4.4 percent in the first half of 2021. This is about a percentage point below the rate recorded in 2019.
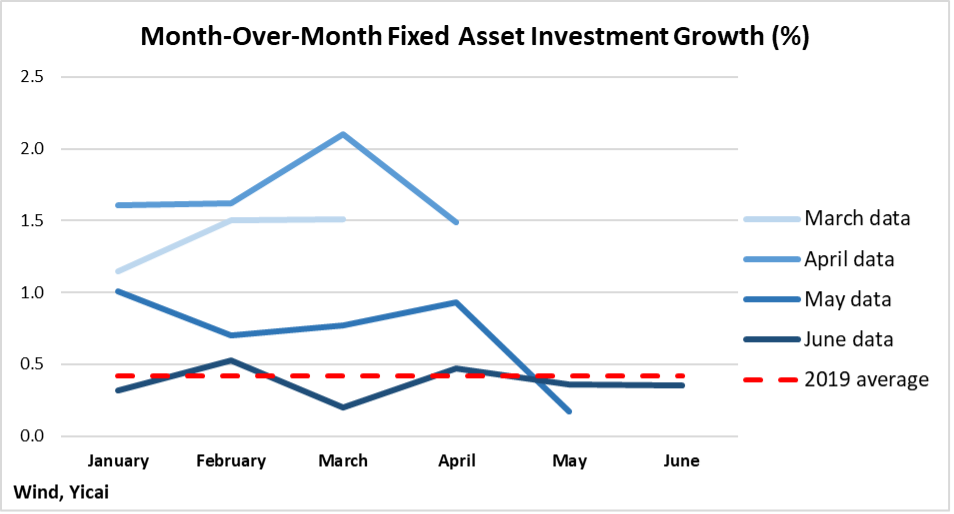
To get a clearer picture of near term investment trends, we look to the NBS’s month-over-month investment data. Unfortunately, these data have been subject to significant revisions (Figure 10). For example, the average monthly growth reported when the April data were released was 1.39 percent. The average fell to 0.71 percent when the May data came out and to 0.37 percent with the 2021Q2 National Accounts.
Average monthly growth of 0.37 percent works out to 4.5 percent at annual rates. While this is somewhat weaker than the 2019 average of 0.42 percent (5.2 percent at annual rates), it is not disastrous and should be sufficient to support robust GDP growth to year end.
Figure 10
 Third, the People’s Bank has emphasized that the cut in the required reserve ratio did not signal a change in the direction of monetary policy. Indeed, it characterized the move as a liquidity operation. A large volume of medium-term lending facility (MLF) loans is due to mature and the cut in the reserve requirement helps ensure the smooth operation of credit markets.
While investment may be weakening, I think we can take comfort in the strength of exports, the strong labour market and the rebound in consumption. Moreover, I think we can trust the People’s Bank when it says the thrust of monetary policy remains unchanged.
 Mark KrugerBased in Shanghai, Mark Kruger holds Senior Fellow appointments at the Yicai Research Institute, the Centre for International Governance Innovation and University of Alberta’s China Institute. Between 2020 and 2023, Mark was the Opinion Editor at Yicai Global. Previously, he had a 30-year career with the Bank of Canada in the course of which he served as a Senior Advisor to the Canadian Executive Director at the IMF and the head of the Economic and Financial Section of the Canadian Embassy in Beijing.


