 Finally, Some Better-Than-Expected Economic News
(Yicai) Sept. 19 --The data by the National Bureau of Statistics (NBS) on September 15 were encouraging.
The growth of industrial value added (4.5 percent) and retail sales (4.6 percent) both accelerated in August and beat the forecasts of the Chief Economists by the Yicai Research Institute (4.0 and 3.5 percent, respectively).
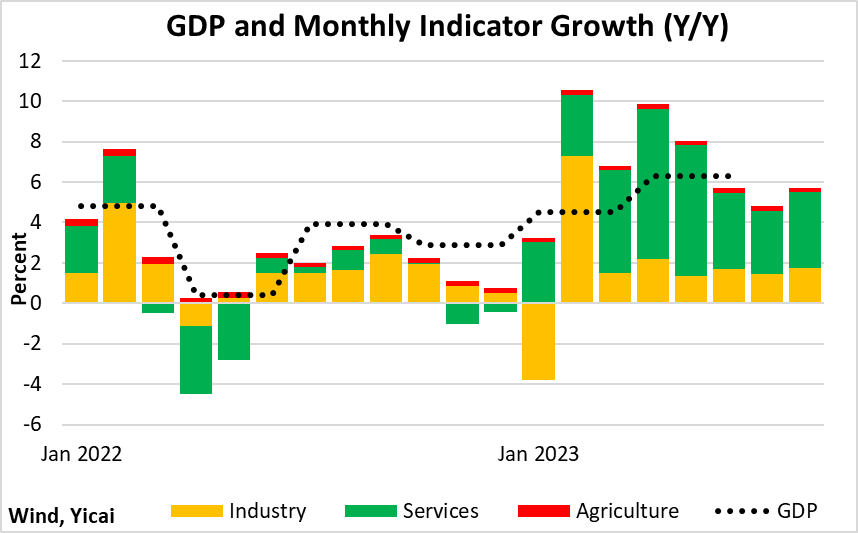
Our monthly GDP indicator is designed to give a comprehensive view of the economy. It is a weighted average of the growth of industrial value added, the NBS’s index of service production and an estimate for the agricultural sector. It suggests that GDP grew by 5.7 percent in August, up from 4.8 percent in July (Figure 1).
August’s robust growth was notable because the property market and the export sector continued to exert sizable drags on the economy. Still, if GDP can continue to grow at July-August rates, it will be no problem to meet the government’s 5 percent target this year.
Figure 1
Consumption continues to drive the economy.
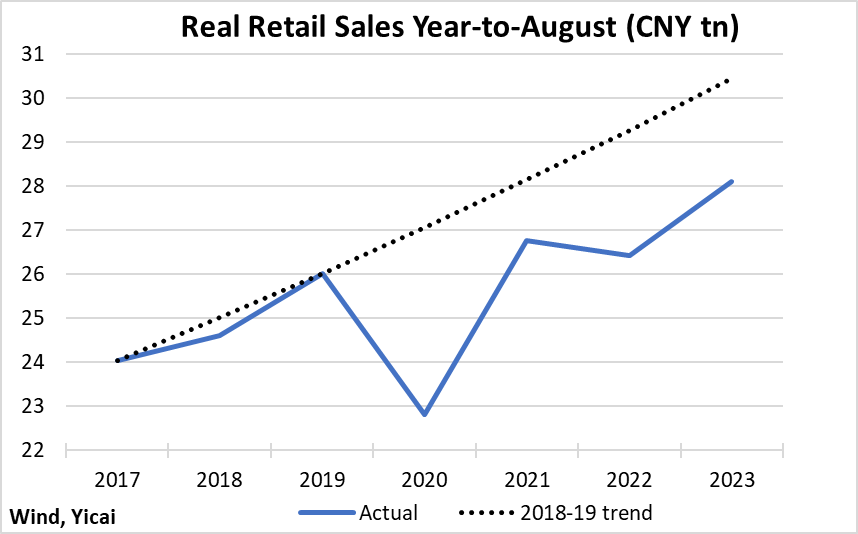
Figure 2 presents my estimate of inflation-adjusted retail sales for the year-to-August period of the last several years.
In real terms, retail sales rose by less than 2 percent between the first eight months of 2019 and those of 2022. So far this year, they are up 6 percent, which is more rapid than the 4 percent pre-Covid (2017-19 trend). Still, real retail sales remain some 8 percent below where they would have been had they maintained trend growth between 2019 and 2023. This points to the likelihood of significant pent-up demand.
Figure 2
Much of consumption’s strength this year comes from households being more willing to consume high-contact services.
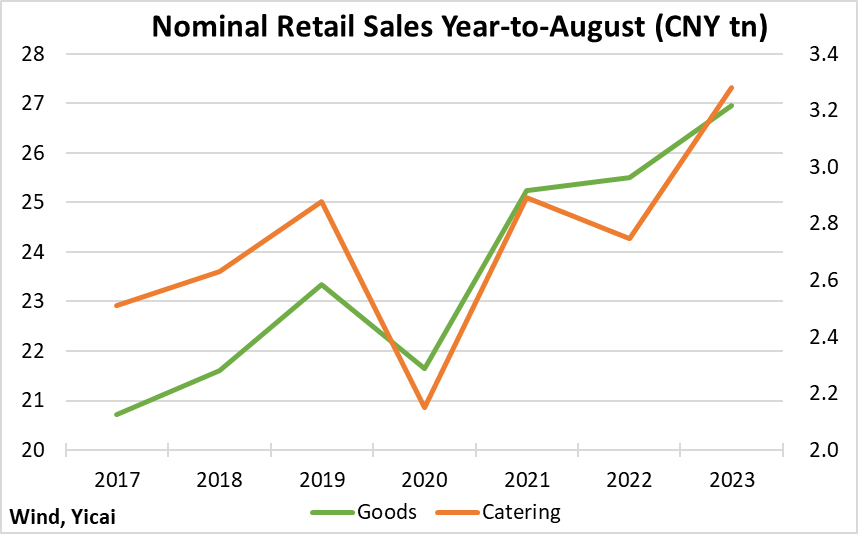
Figure 3 shows nominal retail sales for goods and for catering services for the first eight months of the last several years. Between 2019 and 2022, goods sales were up 9 percent while those of catering services were down 5 percent. Between 2019 and 2023, the two growth rates have essentially converged with the former at 15 percent and the latter at 14 percent.
Figure 3
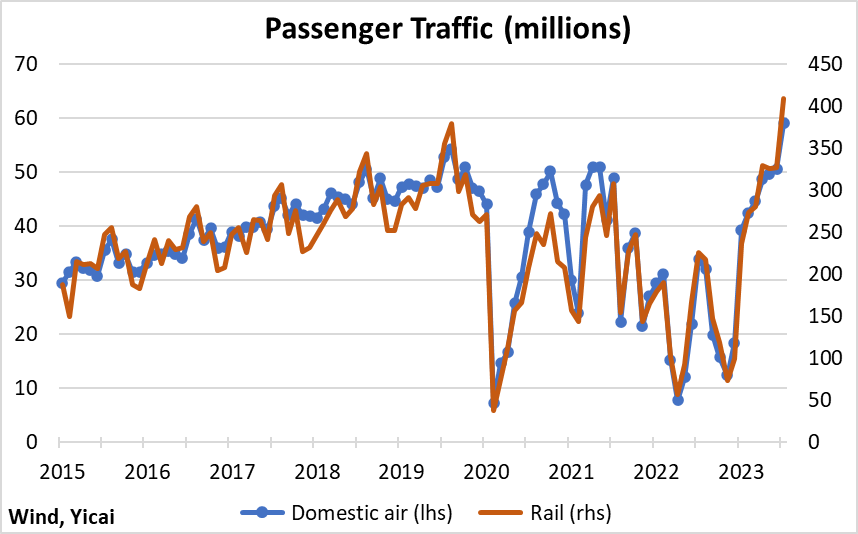
Households’ eagerness to travel is reflected in the rebound in passenger trips by rail and air (Figure 4). Passenger rail and air trips in July were 15 and 12 percent higher, respectively, than in July 2019.
Anecdotally, it looks like the strong demand for travel will persist into the October National Day/Mid-Autumn Moon period when schools and businesses close for a week. My wife, Feifei, who takes care of our family’s travel arrangements, tells me it is all but impossible to book hotels in well-known tourist locations. So, we have opted to take our daughters to visit Quzhou (衢州), a city with a venerable history but one that is well off of the beaten track.
Figure 4
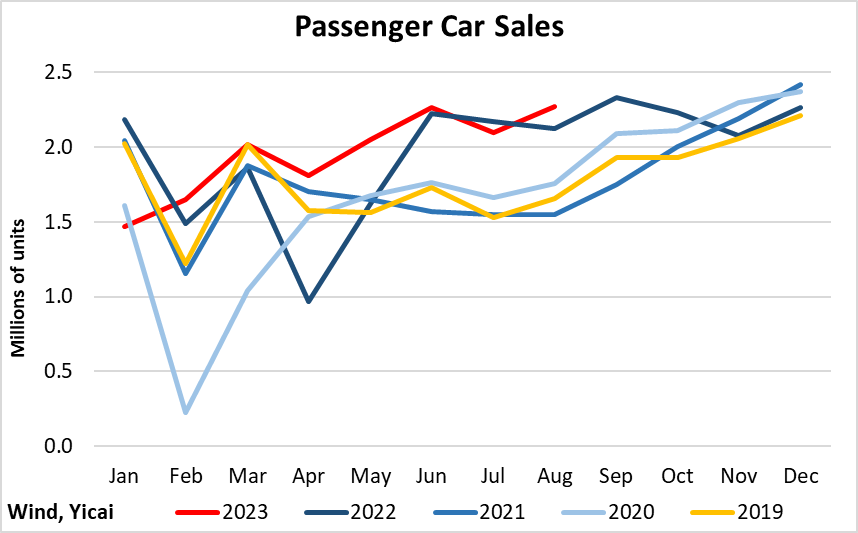
After dipping last month, sales of passenger cars grew by 7 percent year-over-year in August (Figure 5). Year-to-date, passenger car sales are up 7 percent from last year and 18 percent from 2019. Buoyant car sales mean that households must feel fairly secure about their futures. After all, cars are big-ticket items and it is always possible to drive that old one just a little longer if you are uncertain about your prospects.
In contrast, the long shadow of the real estate downturn is being felt in sales of building and decorative materials, appliances and furniture, which are down 7 percent so far this year.
Figure 5
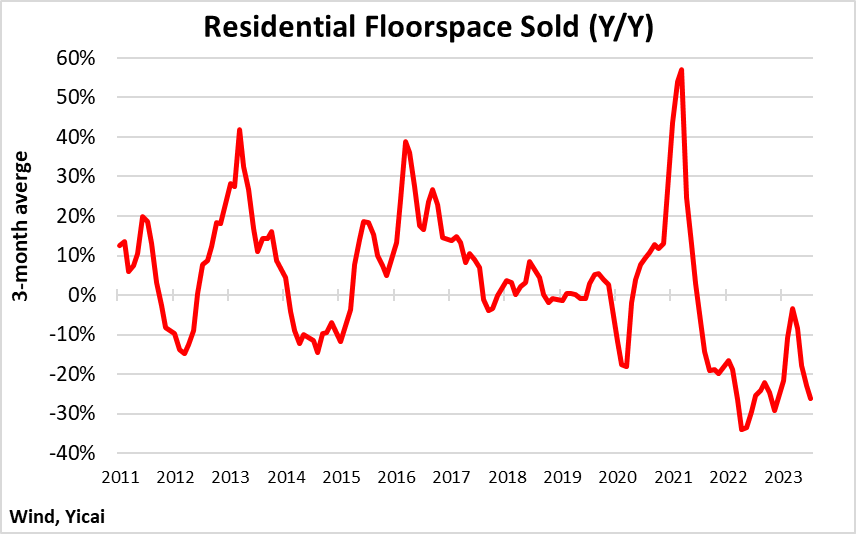
The budding signs of a recovery in the property market earlier this year have faded. The rebound in new home sales in March-April has given way to renewed weakness (Figure 6).
Figure 6
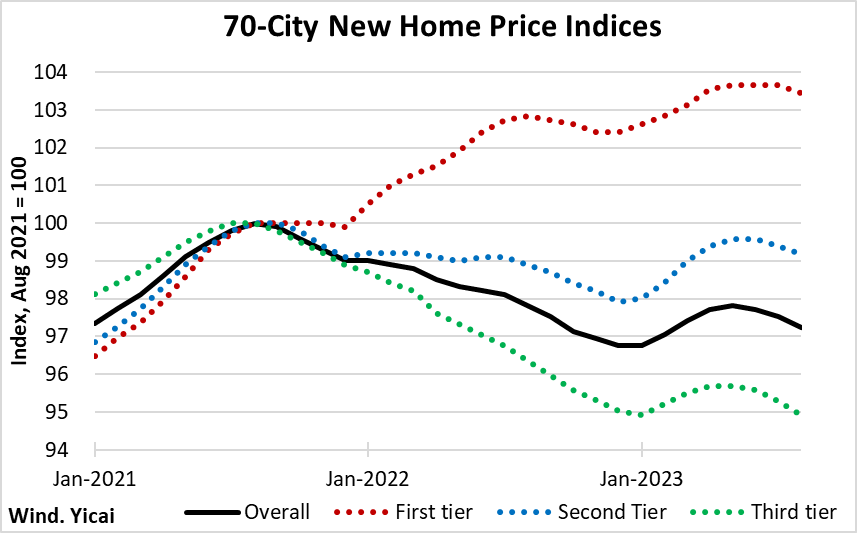
The faltering demand for housing is reflected in falling home prices (Figure 7). Third-tier cities, where prices have returned to their January levels, have been the most affected. Prices are up just 0.8 percent from January in first-tier cities and are 1.2 percent higher in second-tier cities. In all tiers, however, the near-term price trend is negative.
Figure 7
With the demand for housing fading, it is not surprising that investment in real estate development continues to be weak. After falling by 10 percent last year, it is down another 9 percent so far in 2023 – and its rate of decline is accelerating.
But, according to NBS spokesman , the weakness in investment has been concentrated in real estate. In other key areas, it is growing rapidly. So far this year, investment in manufacturing is up a respectable 6 percent. Investment in automobile manufacturing is up 19 percent, driven by new energy vehicles and, in equipment manufacturing, it is up 14 percent.
The annual growth rates of exports and imports have been declining for close to a year. However, this is not a China-specific problem. Rather it reflects the weakness of the global economy as monetary authorities in many countries have raised interest rates to bring down inflation.
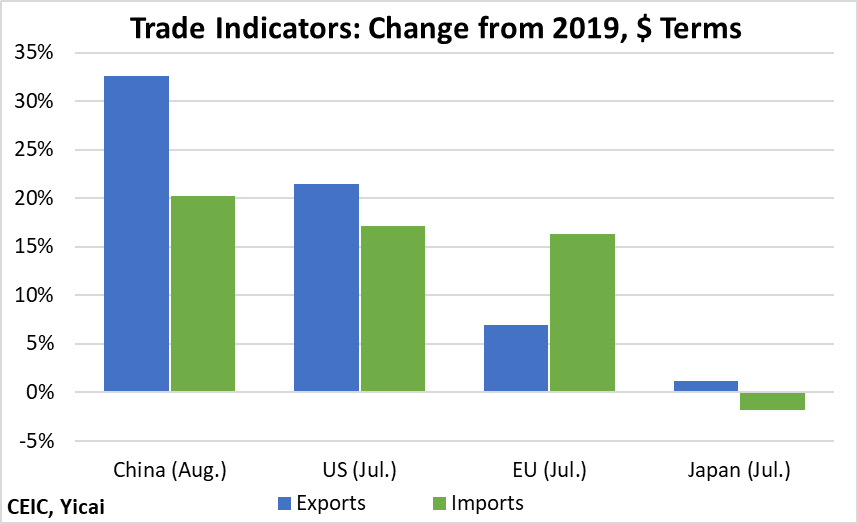
Taking a longer perspective, China’s exports and imports have been relatively strong. Figure 8 shows the change between the most recent month for which we have data (August 2023 for China and July for the other economies) and the corresponding month in 2019.
Import growth among the big three economies has been fairly similar. However, despite its recent weakness, China’s export growth has been significantly higher than those of its trading partners. This serves to illustrate that China’s export sector is suffering from cyclically weak demand and not a loss of competitiveness.
Figure 8
Notwithstanding the twin real estate and export sector shocks, China’s labour market has been resilient.
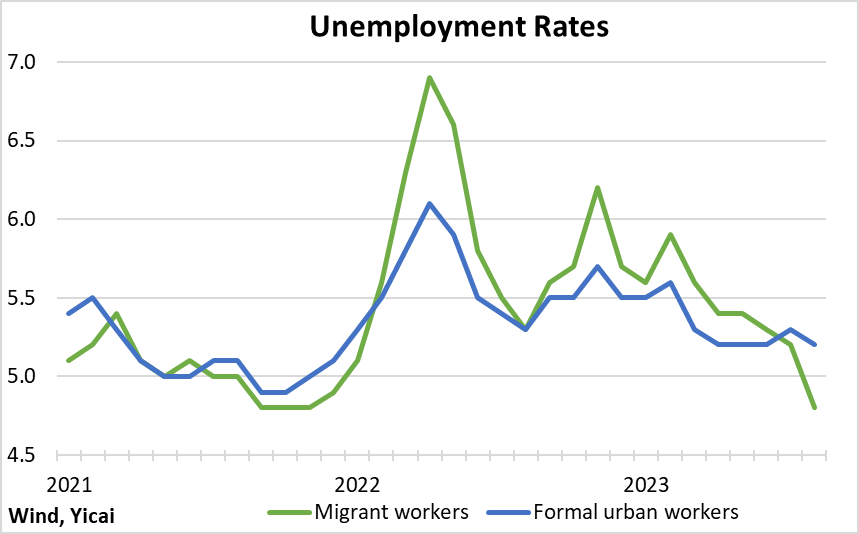
The headline unemployment rate ticked down to 5.2 percent in August, the same level as in August 2019. The unemployment rate for migrant workers dropped sharply in August, to 4.8 percent from 5.2 percent in July. Migrant workers tend to be the first hired and the first fired, so their unemployment rate is more volatile than the headline rate (Figure 9). The fall in the migrants’ unemployment rate in August could be signalling renewed demand for labour as the economy recovers.
Figure 9
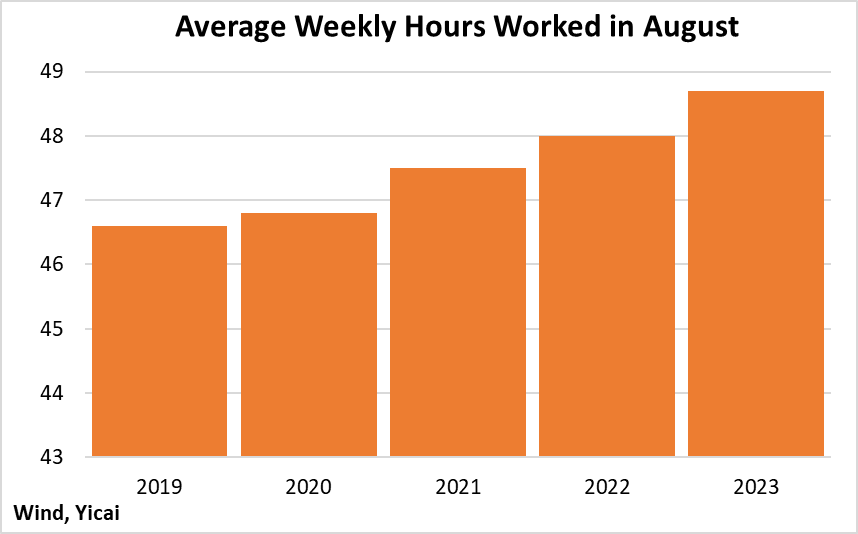
Growth in the number of weekly hours worked is also indicating strong labour demand (Figure 10). The NBS reported that 48.7 hours were worked, on average, in August. This was more than two hours more than in August 2019 and is the highest reading since the series began in mid-2018.
Figure 10
Given the resilience of China’s labour market, policy has focused on structural reforms rather than cyclical support. Several new policies were announced in recent months:
The Party and the State Council jointly guidelines to boost the growth of the private economy.
A is to be set up under the National Development and Reform Commission to analyze the evolution of the private economy and formulate policies to promote its development.
The State Council announced guidelines designed to attract .
The People's Bank of China and the State Administration of Financial Supervision reduced downpayments and lower mortgage rates for home buyers.
Hopefully, these policies and the economy’s upswing will help catalyze confidence and lead to more good news in coming months.