 How Worried Should We Be About China’s Falling Consumer Prices?
(Yicai) Aug. 28 -- For an economist – and an ex-central banker at that – I don’t spend a lot of time thinking about prices. If you ask me if things are cheaper or more expensive than a year ago, I’d be hard-pressed to tell you without consulting my spreadsheets. I am price insensitive. On the rare occasions I buy anything, I just scan the code and go, without even thinking about how much the item cost. I value my time more than any potential savings.
In our family, my wife Feifei is the one who does the shopping. She’s a shrewd buyer and always on the lookout for high-quality products on sale. She seems to know the price of everything.
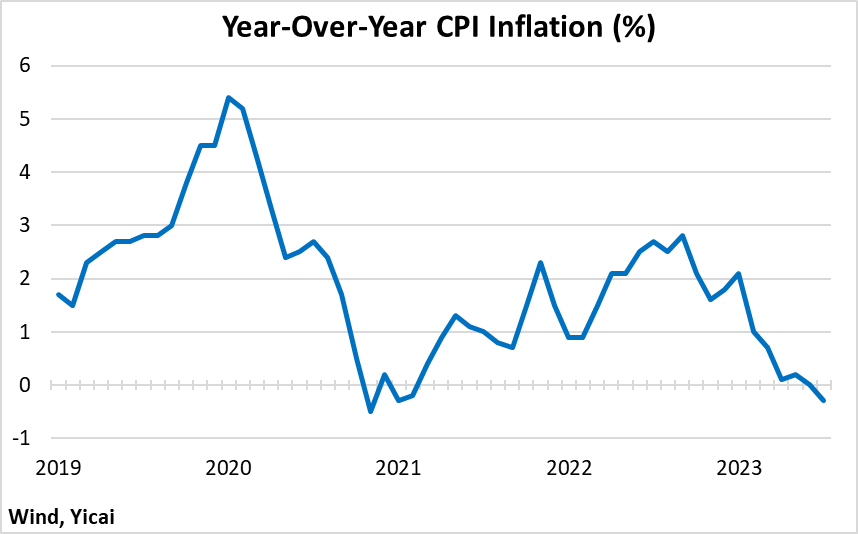
The news that China’s consumer price index (CPI) fell, on a year-over-year basis, in July certainly did catch my attention. Headline CPI inflation was -0.3 percent, following zero growth in June (Figure 1)
It is not unusual for economies to be hit by shocks that cause short-term declines in prices. As Figure 1 shows, China experienced temporary consumer price declines during late-2020/early-2021. In the Eurozone, consumer prices fell in August through December 2020. The US experienced falling prices for a couple of months in the spring of 2015 and for most of 2009.
Figure 1
However, if sustained over time, deflation can pose several challenges for the economy. It can discourage investment, as real interest rates increase. Similarly, deflation raises real debt burdens and makes the possibility of financial distress more likely. Moreover, falling prices can lead consumers to delay their spending, prolonging economic recoveries. Japan experienced protracted deflation between 1998 and 2013, which likely aggravated its economic slowdown.
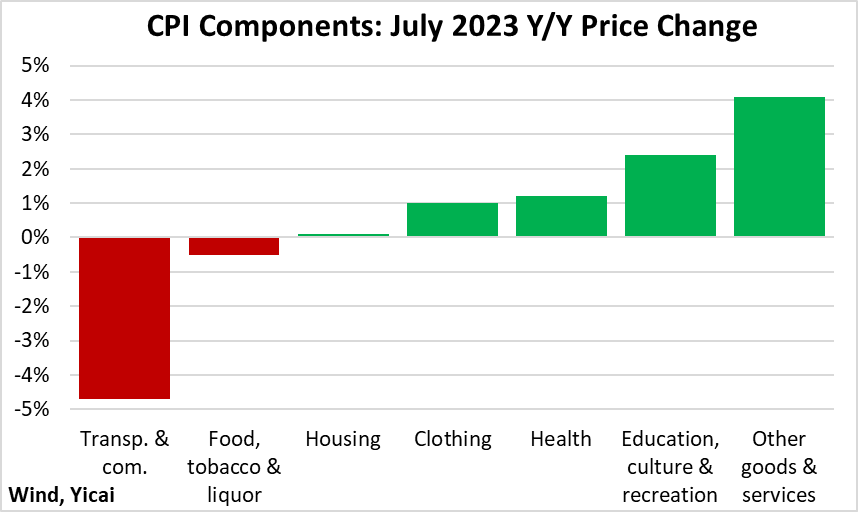
July’s fall in China’s consumer prices was concentrated in just two components of the CPI basket: transportation & communication and food, tobacco & liquor (Figure 2).
Figure 2
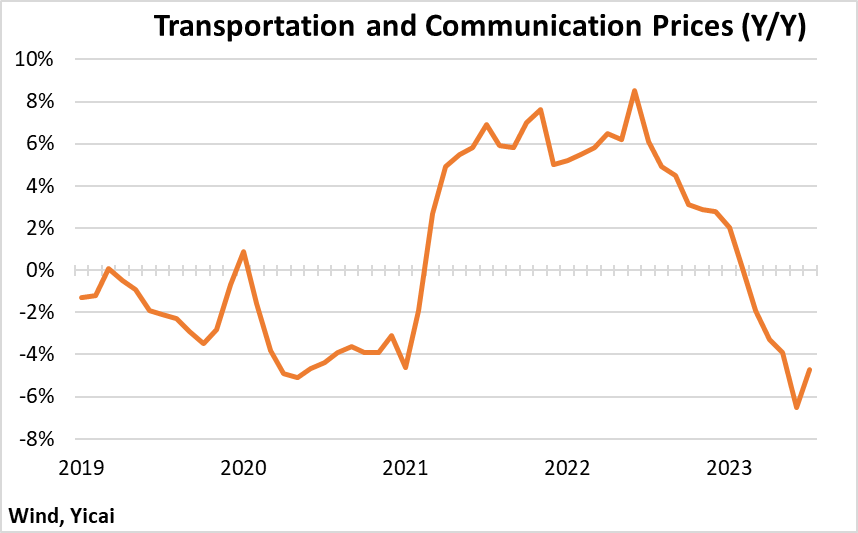
Transportation and communication prices are quite volatile. They fell significantly in 2019-20, rose sharply in 2021-22 and have declined again this year (Figure 3).
Figure 3
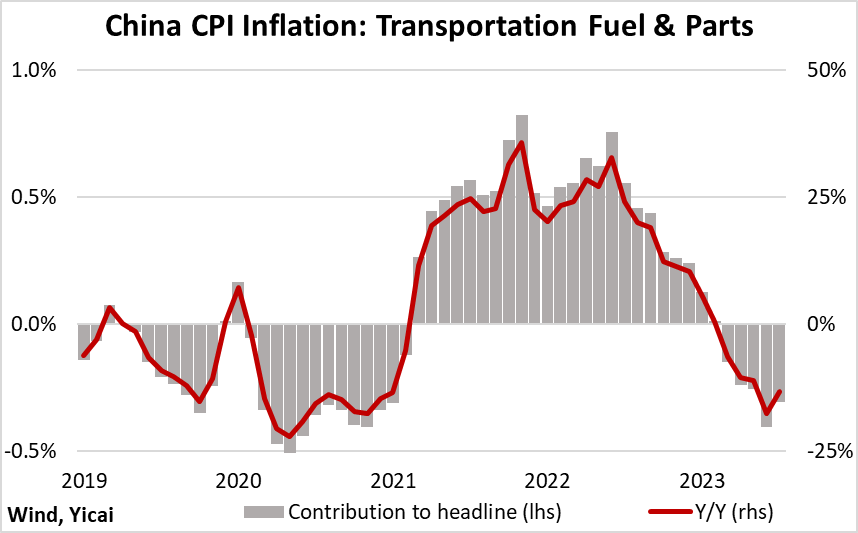
Within this component, it is the transportation fuel and parts sub-component that accounts for most of the volatility (Figure 4). Increases and declines in excess of 20 percent have not been uncommon as Chinese gasoline prices followed global oil price trends. In July, this sub-component fell by 13 percent and it subtracted some 0.3 percentage points from headline CPI inflation.
Figure 4
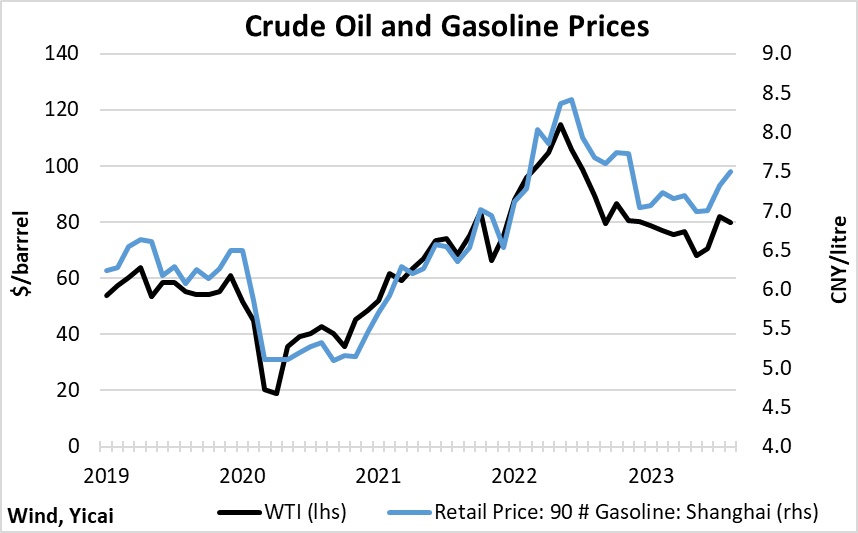
Both global crude oil prices (WTI) and pump prices in Shanghai appear to have stabilized (Figure 5). Barring another shock, we should expect that transportation costs will cease being a drag on CPI inflation by the end of the year.
Figure 5
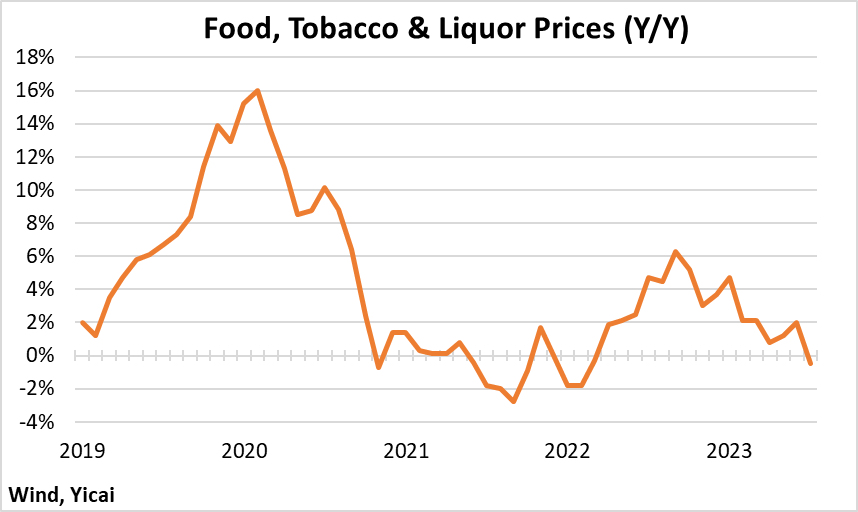
Food, tobacco & liquor was the other component that recorded a year-over-year decline in July. It fell 0.5 percent, from a 6 percent increase in September 2022 (Figure 6).
Figure 6
Much of the volatility in this component comes from pork, which is Chinese households’ staple meat. Pork accounts for about 5 percent of the food, tobacco & liquor component and close to 2 percent of the overall CPI basket.
Pork prices are subject to wide swings because of the “hog cycle” which reflects the lag between the time farmers receive new information and their ability to adjust production. Pork production is also affected by the outbreak of communicable diseases. In 2019, a wave of African Swine Fever killed millions of pigs and led to a sharp rise in China’s pork price.
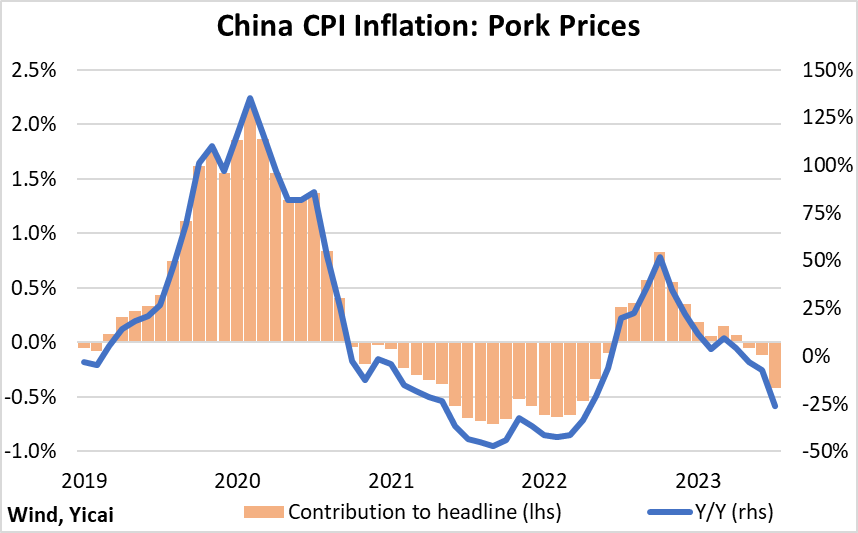
In July, pork prices were down 26 percent year-over-year. They subtracted 0.4 percentage points from headline CPI inflation (Figure 7).
Figure 7
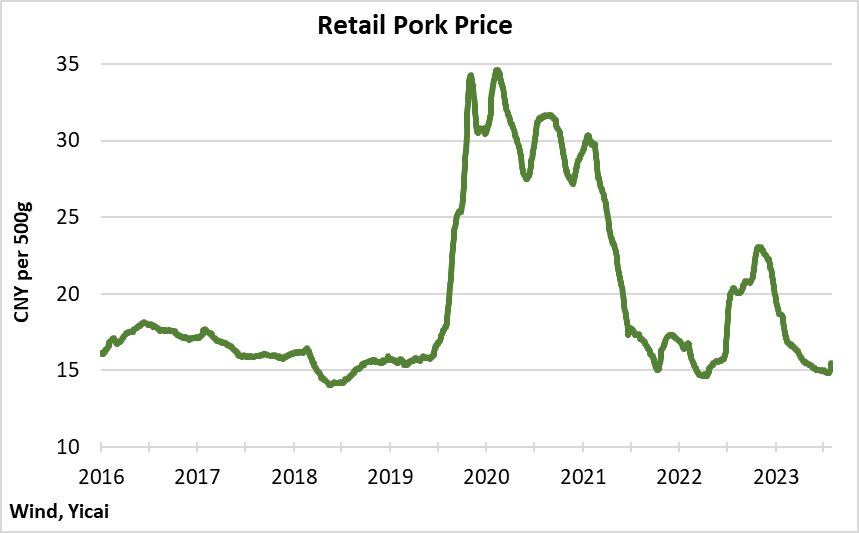
Retail pork prices have stabilized in the CNY 15 per 500g range, which is close to their 2016-19 average (Figure 8). Expectations are for pork prices to rise between 10-20 percent in the second half of the year, so they will likely begin to contribute positively to headline CPI inflation.
Figure 8
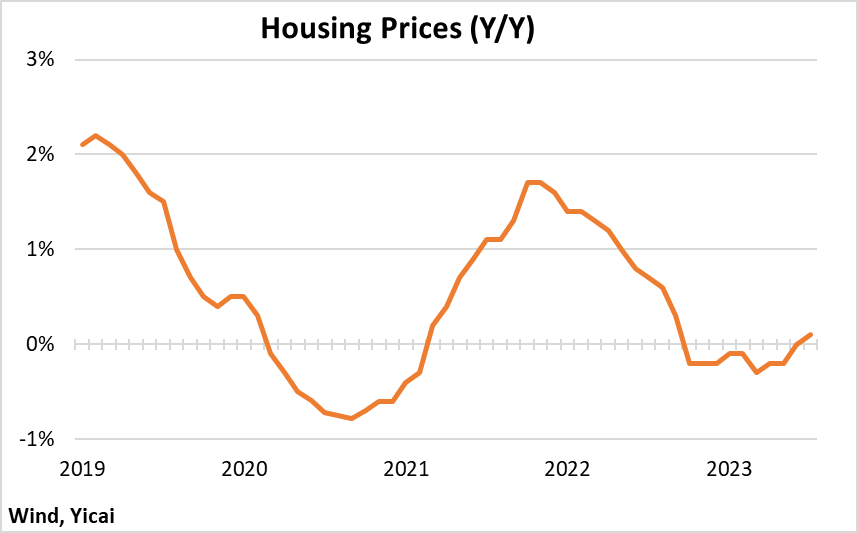
Housing represents the second largest component of the CPI basket after food, tobacco & liquor. In July, the growth of housing prices turned positive, increasing by 0.1 percent year-over-year after eight months of decline (Figure 9).
Figure 9
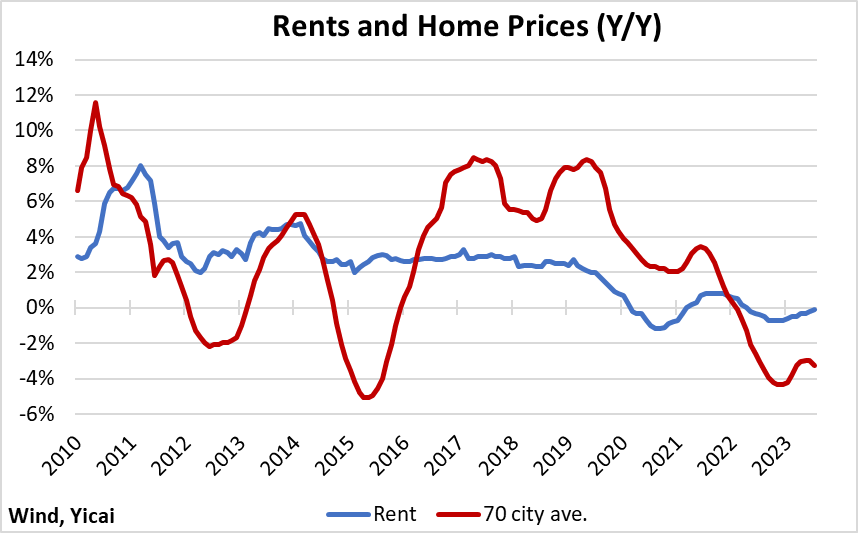
The evolution of the housing component seems to be driven by rental prices. Before the pandemic, rents had been growing by 2 percent a year. Over the last three-and-a-half years, the growth in rents has been close to zero. While they are not nearly as volatile, rents seem to follow the trend in the year-over-year growth of second-hand home prices in China’s 70 biggest cities (Figure 10). The most recent data suggest that a trough has been reached but it is too early to be certain given the fragility of the property market.
Figure 10
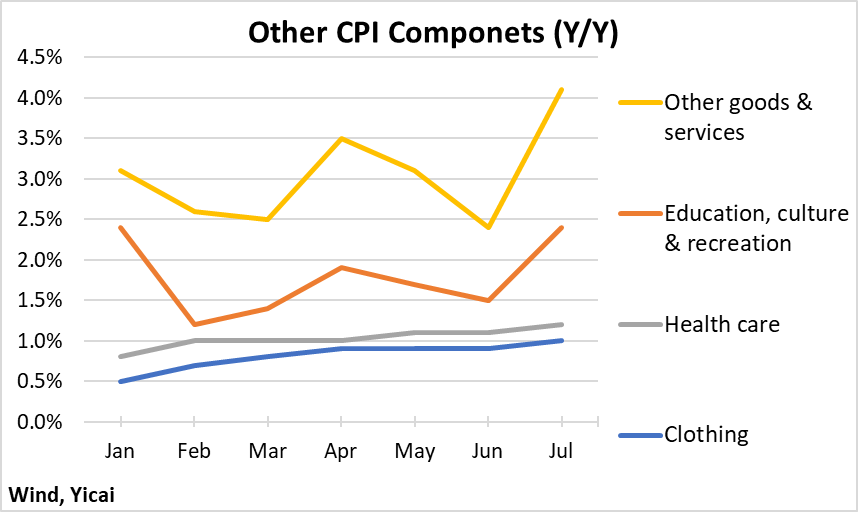
The prices of the other four CPI components were positive year-over-year in July. Moreover, their growth appears to be accelerating over time, suggesting that China’s deflationary pressures are not broad-based (Figure 10).
Figure 10
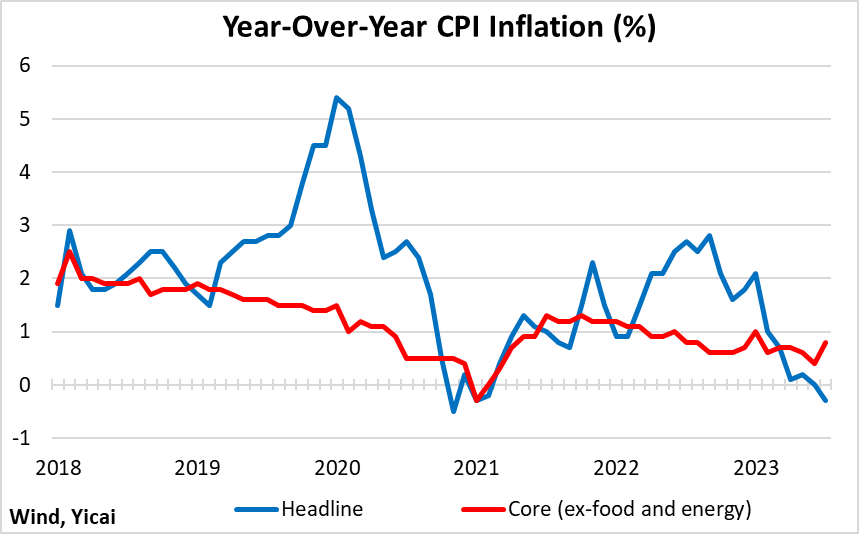
To look through the volatility often associated with food and energy prices, economists like to focus on “core inflation” measures that exclude these components. Excluding food and energy, Chinese core inflation remained positive in July, ticking up to 0.8 percent from 0.4 percent in June (Figure 11).
Taking a longer perspective, it is clear that disinflationary forces are at work. Between 2018 and 2019, the year-over-year growth of the core CPI averaged 1.8 percent. Over the last 12 months, core CPI growth was only 0.7 percent.
Figure 11
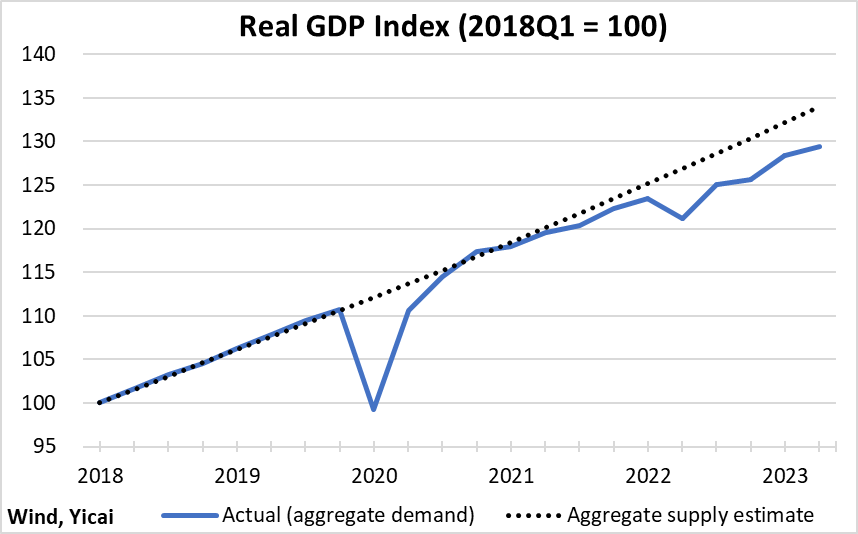
Disinflation can signal that aggregate supply exceeds aggregate demand.
Economists typically take the evolution of actual GDP as a measure of aggregate demand. Estimating aggregate supply is trickier. In Figure 12, the aggregate supply estimate is “trend GDP” for 2018-19. In subsequent years, the trend grows at an annual rate of 5.6 percent.
Aggregate supply could, in fact, be lower. Weak GDP growth during the pandemic period may have had “scarring effects” on the supply side of the economy.
Figure 12
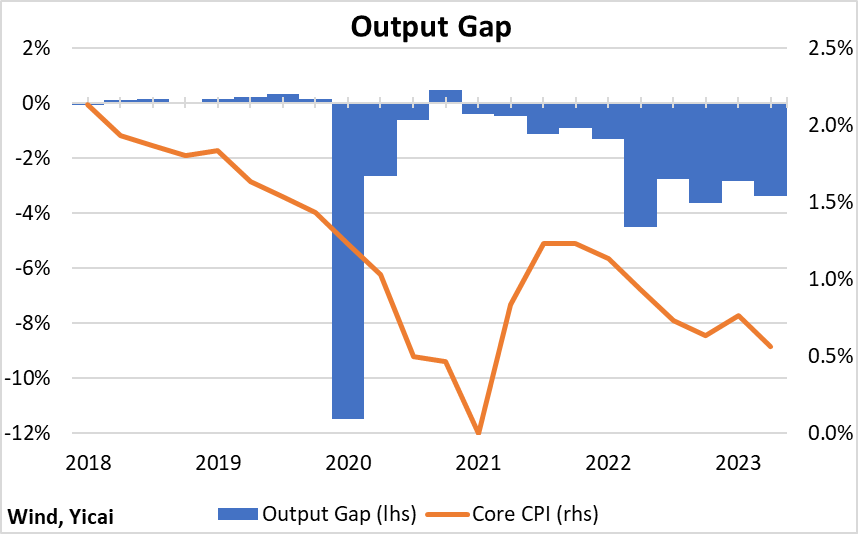
Economists call the difference between aggregate demand and aggregate supply the “output gap”.
When aggregate demand exceeds aggregate supply, the output gap is positive and inflation tends to rise. When aggregate supply exceeds aggregate demand, the output gap is negative and inflation tends to fall.
The relation between my estimate of the output gap and core inflation is shown in Figure 13.
Two separate forces seem to be at work here. The opening of a persistent output gap to some 3 percent of GDP in 2022-23 is associated with a deceleration in core inflation. This is a cyclical development.
Figure 13
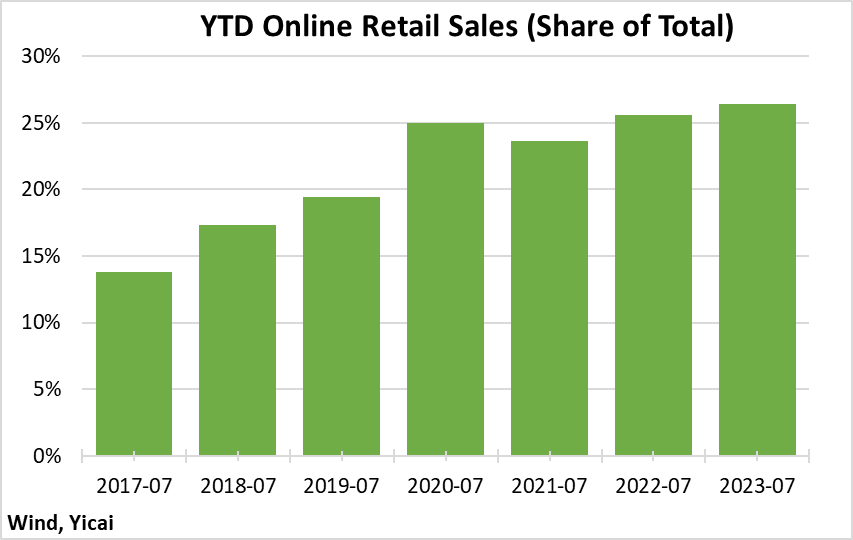
Since core inflation was falling before the output gap opened, structural factors must be at work as well. One possibility is China’s dramatic embrace of e-commerce. Online shops tend to have lower overhead and they can pass these cost-savings along to their clients. So, shifting from buying in stores to buying online should lead to lower prices and disinflation.
Feifei always shops online. That makes every day at our place seem like Christmas. We always have a package or two delivered with a surprise inside.
The data show that in the first seven months of this year, online sales accounted for 26 percent of all retail sales. This is up sharply from 14 percent in the first seven months of 2017 (Figure 14).
We can call the lower prices that result from our ability to shop online “good disinflation” because it represents a more productive retail sector. This can be contrasted with “bad disinflation” which results from insufficient aggregate demand.
Figure 14
To summarize, recent price dynamics are quite complex.
Deflationary pressures appear to be confined to falling food and energy prices. Since the world oil price and Chinese pork prices have stabilized, falling headline consumer prices should be short-lived.
Longer-term disinflationary pressure has both cyclical and structural components. The share of retail sales conducted online appears to have plateaued in recent years. Perhaps the structural transition is complete. We can also expect the output gap to close over time. Domestic consumption is recovering as the unemployment rate has stabilized, household income growth has been strong and precautionary savings are falling. Moreover, low domestic inflation gives China an advantage in foreign markets that should, over time, boost export growth.
 Mark KrugerBased in Shanghai, Mark Kruger holds Senior Fellow appointments at the Yicai Research Institute, the Centre for International Governance Innovation and University of Alberta’s China Institute. Between 2020 and 2023, Mark was the Opinion Editor at Yicai Global. Previously, he had a 30-year career with the Bank of Canada in the course of which he served as a Senior Advisor to the Canadian Executive Director at the IMF and the head of the Economic and Financial Section of the Canadian Embassy in Beijing.


