 How Should We Interpret April’s Economic Data?
(Yicai Global) May 18 -- It is not easy to make sense of the macroeconomic data this week by China’s National Bureau of Statistics (NBS). Given the robust year-over-year growth of the service sector (13.5 percent) and industrial value-added (5.6 percent), our monthly GDP indicator suggests that the economy expanded by close to 10 percent in April (Figure 1).
Figure 1
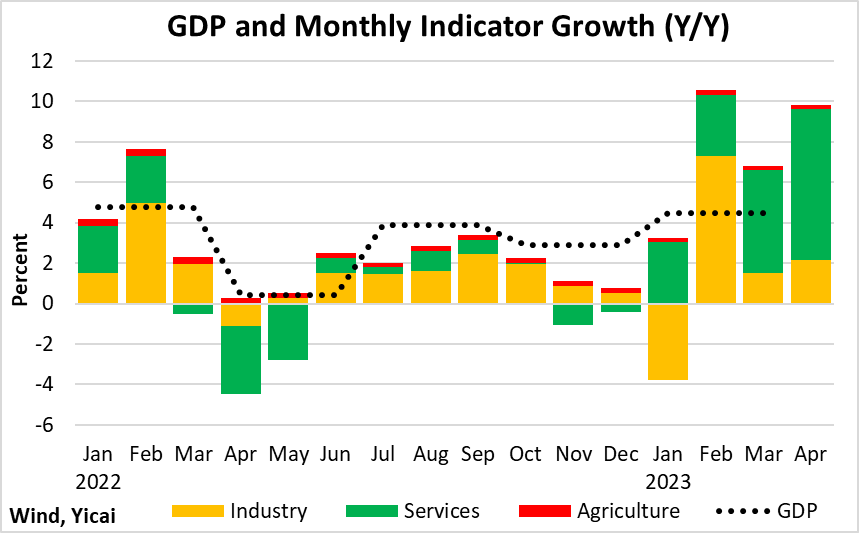
Some of the strength in the economy’s year-over-year growth comes from the weakness in 2022. Last April was when Covid infections peaked and pandemic prevention measures weighed heavily on the economy. It made for a “low base” which inflates year-over-year comparisons. The task for economic analysis is to tease out how much of April’s growth was due to the economy’s rebound and how much reflects its underlying strength.
Retail sales grew by 18.4 percent year-over-year in April, up from 10.6 percent in March. This impressive outcome was actually below expectations. The median forecast of the Chief Economists by the Yicai Research Institute was 21.9 percent.
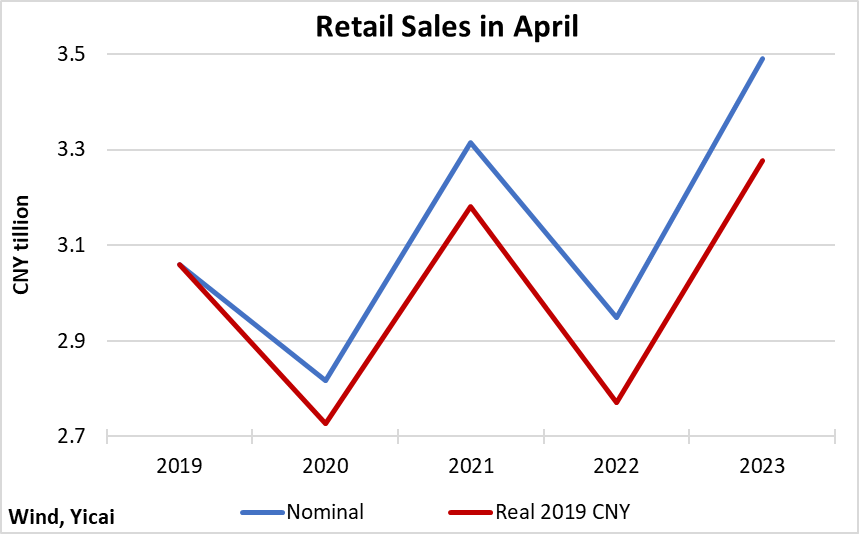
In April, retail sales totalled close to CNY3.5 trillion. This was a good number. It was much better than the depressed outcomes in April 2022 and April 2020. Moreover, it was 5 percent higher than April 2021 and 14 percent higher than April 2019 (the blue line in Figure 2). The NBS reports retail sales on a nominal basis. However, even after adjusting for inflation, April’s retail sales were still 3 percent higher than in 2021 and 7 percent higher than in 2019 (the red line in Figure 2).
The upshot is that retail sales hit their highest level ever for the month of April, well exceeding their pre-pandemic peak. However, their growth remained slower than the 5 percent, in real terms, recorded in April 2019.
Figure 2
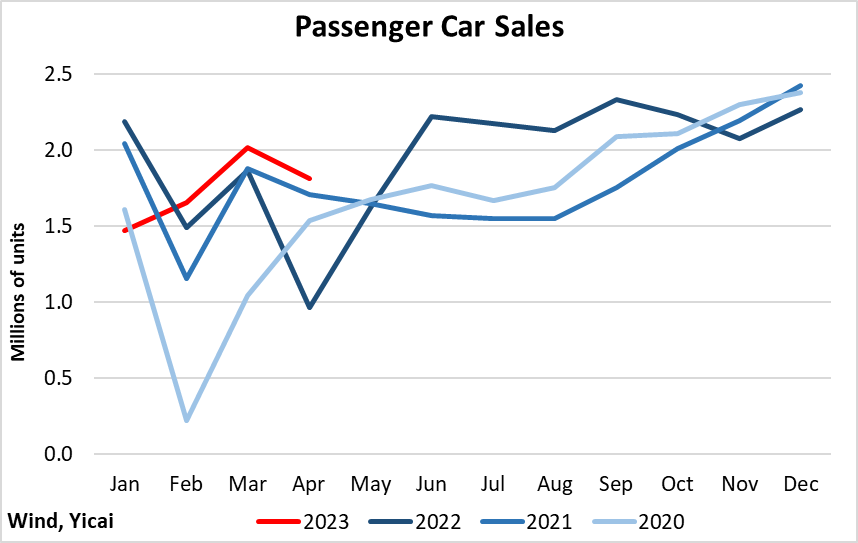
Similarly, the pandemic also distorted the passenger car sales data, which were up an incredible 88 percent in April. As Figure 3 shows, this was largely because of the steep drop in 2022. Nevertheless, April’s sales were 6 and 18 percent higher than those of the same month in 2021 and 2020, respectively. Over the last three months, car sales have been significantly stronger than in previous years, suggesting demand is buoyant.
Figure 3
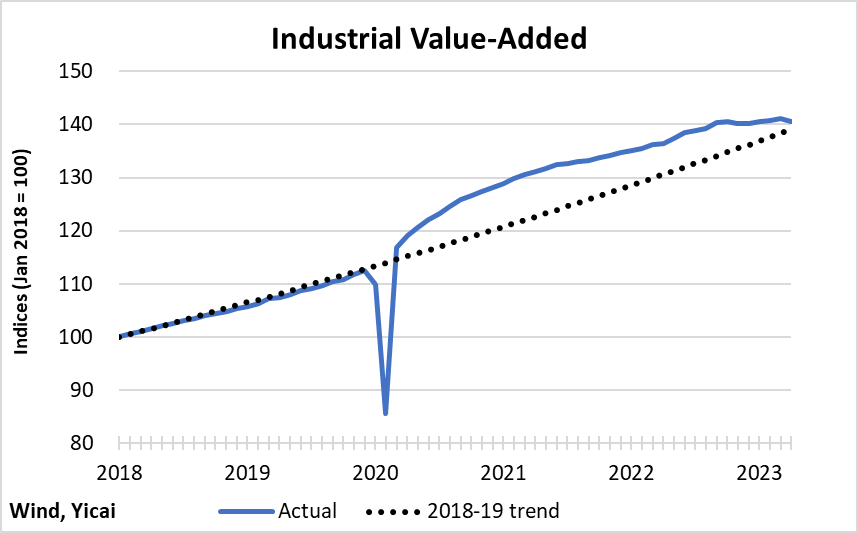
Industrial value-added grew by 5.6 percent year-over-year in April, up from 3.9 percent in March. The outturn was well below the 10 percent forecast by the Chief Economists. Industrial value-added fell by 2.9 percent in April 2022. This means that average growth over the two-year period was only 1.4 percent. This represents a deceleration from two-year growth of 4.5 percent in March.
Industrial value-added recovered quickly following the pandemic-related drop in early 2020 (Figure 4). Output has been well above trend these past three years. But, since the middle of last year, growth has stalled. It appears that industrial value-added is at risk of falling below trend in the coming months.
Figure 4
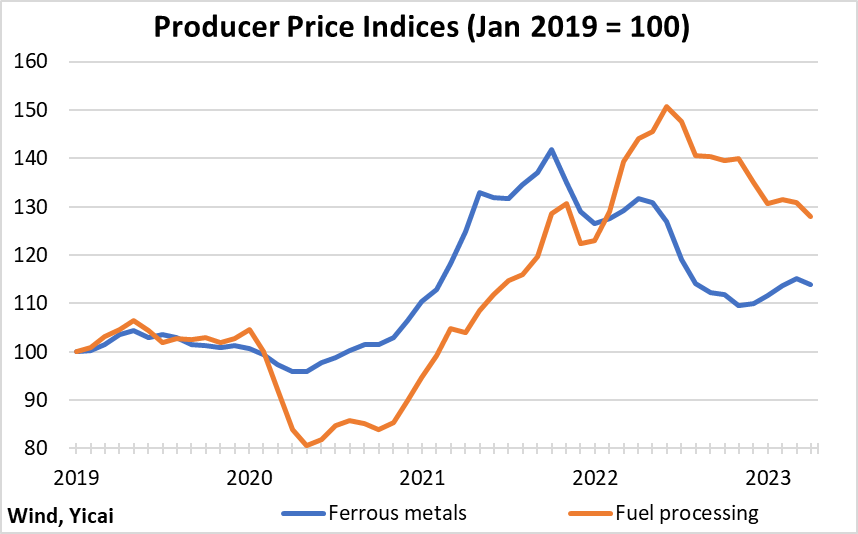
Declining profitability is likely contributing to the slowdown in industrial value-added growth. Across the manufacturing sector, profits were down 31 percent in the first quarter from year-ago levels. Upstream industries such as ferrous metals smelting and fuels refining were the hardest hit as the prices of their products have been falling (Figure 5). Profit growth in key downstream industries, like electrical machinery and equipment, remains strong.
Figure 5
The property market continues to stabilize.
In the first four months of the year, the volume of floorspace completed was up 17 percent from year-ago levels. Indeed, the volume of completions in the January to April period was the highest since 2017. While the volume of new home sales fell 2 percent in the first four months of the year, this represents a significant moderation from the 25 percent decline last year. The volume of housing starts remains weak, down 21 percent so far this year.
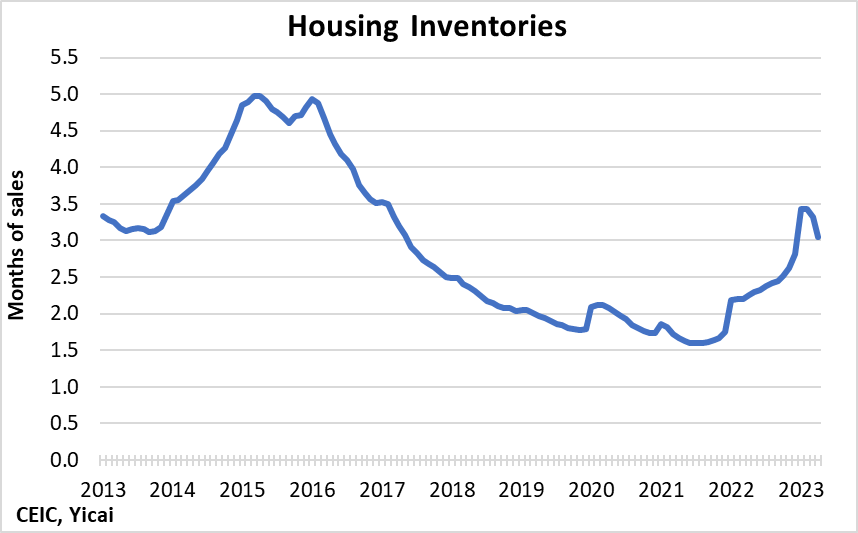
With completions up, sales relatively stable and starts down, there has been a reduction in the amount of excess supply. Housing inventories, in terms of months of sales, appear to have peaked (Figure 6). The inventory buildup, while rapid, was much less pronounced than during the 2014-16 cycle.
Figure 6
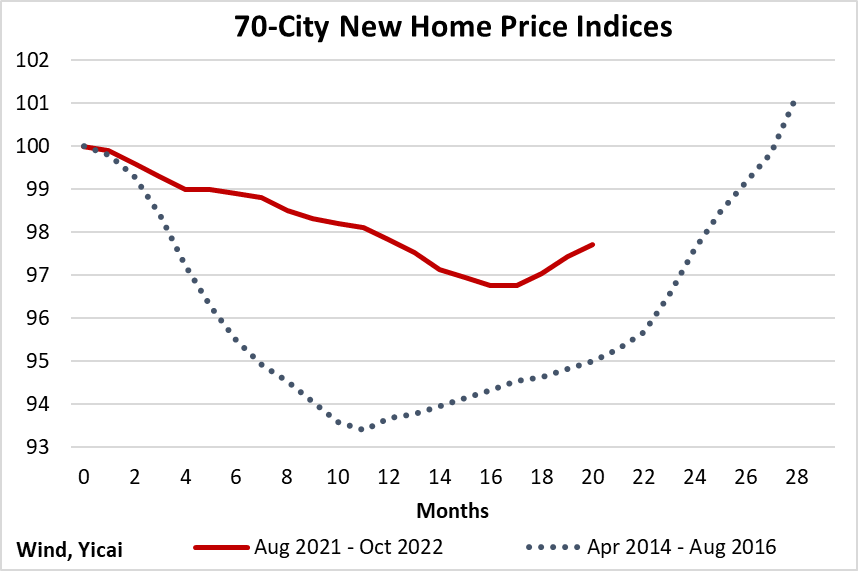
Another sign of repair in the housing market is the rebound in new home prices. Across the 70 cities surveyed by the NBS, prices were up for the third consecutive month. Like the inventory data, the new home prices show that the current property market cycle has been less severe than the previous one (Figure 7).
Figure 7
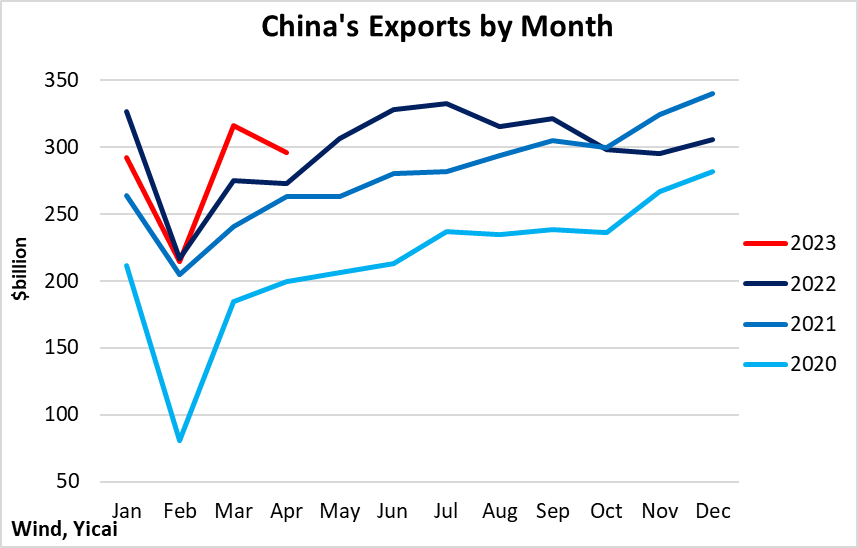
The export sector ouperformed expectations. In dollar terms, they were up 9 percent, following 15 percent growth in March. As Figure 8 shows, there was no significant weak base last year to inflate exports’ strong performance in April.
Figure 8
With rising interest rates in China’s trading partners dampening their demand for imports, China’s exports are expected to slow. That may well be the case. But lower inflation in China could be offering its exporters an important offset.
Figure 9 presents China’s effective exchange rate indices as compiled by the Bank for International Settlements. The nominal effective exchange rate index is a weighted average of China’s exchange rates with its trading partners. The real effective exchange rate index adjusts the nominal effective rate by including a measure of consumer prices. It reflects both nominal exchange rate developments and the inflation differential vis-à-vis China and its trading partners.
In early 2021, a gap opened up between real and nominal effective exchange rates, reflecting the relatively higher rates of consumer price inflation of China’s trading partners.
Figure 9
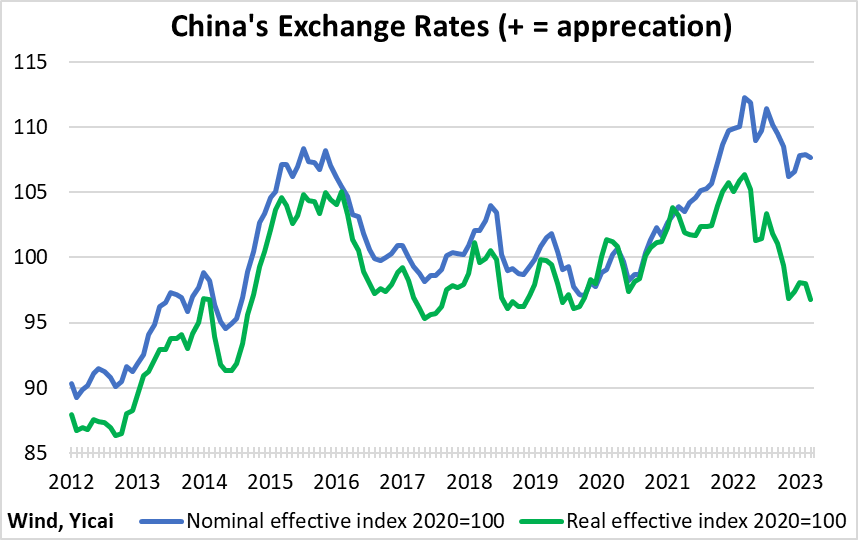
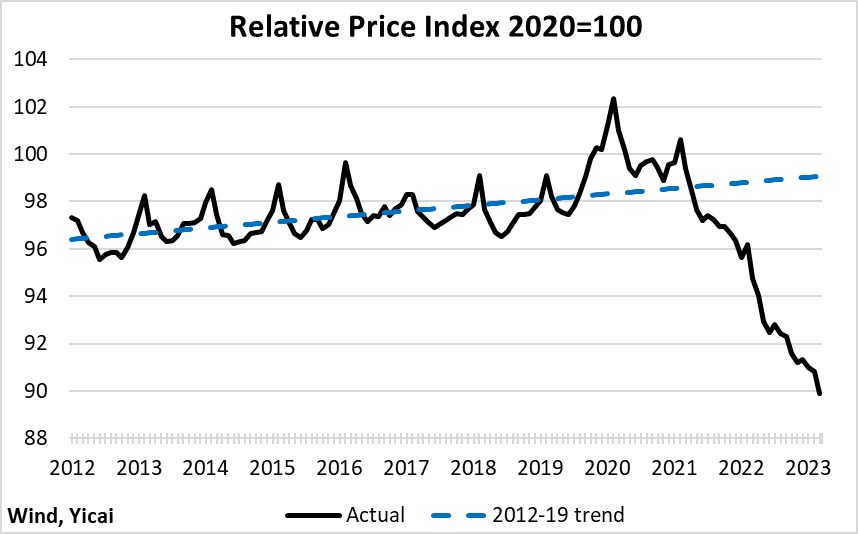
Figure 10 shows the relative price component of the real effective exchange rate index. Between 2012 and 2019, China ran somewhat higher consumer price inflation than its trading partners. This is not unusual. The predicts that countries that have rapid productivity growth should experience relatively high rates of domestic price inflation.
While China relied on fiscal policy to offset the contractionary effects of the pandemic, its trading partners implemented very accommodative monetary policy, which on the back of structural rigidities in labour markets, led to sizable increases in inflation. Figure 10 indicates that relative prices in China are 9 percent lower than they would have been had the pandemic not hit and supportive policies not been implemented.
These price differentials are likely to grow further in coming months, making Chinese goods more attractive in foreign markets.
Figure 10
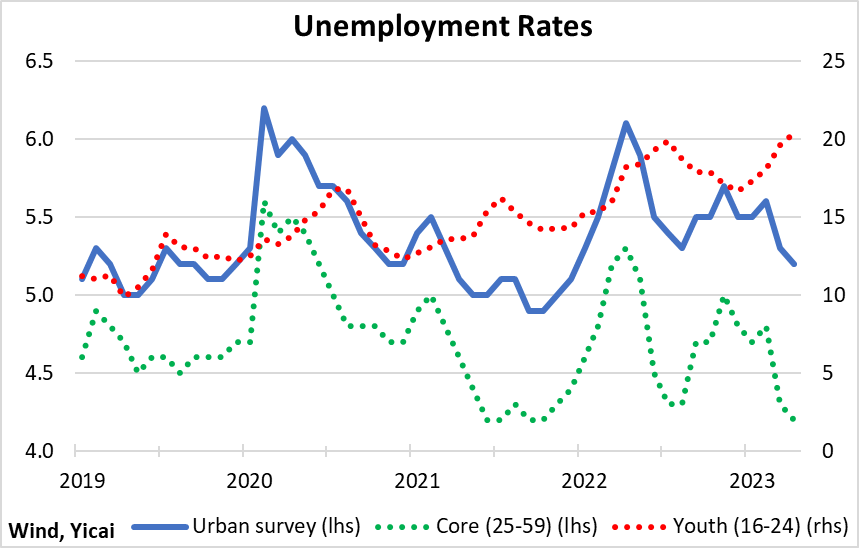
China’s labour market is bifurcated. For core workers – those aged 25 to 59 – the unemployment rate has dipped below pre-pandemic levels (Figure 11). However, the unemployment rate for youth has topped 20 percent. This appears to be due to increased supply – a of students are graduating – rather than insufficient demand for labour.
Figure 11
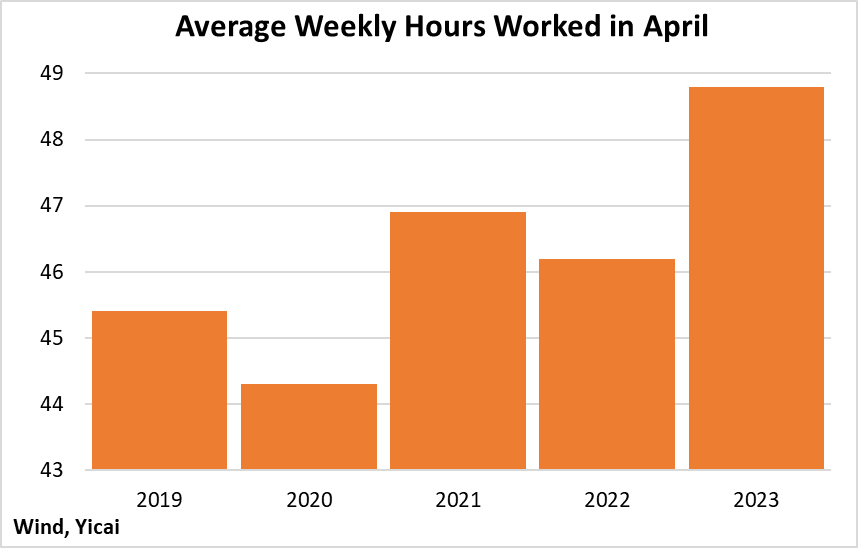
Relatively strong labour demand is reflected in the number of hours worked in April, compared to the same month in previous years (Figure 12). On average, employees were putting in 7 percent more hours each week than they did before the pandemic. Clearly, there are limits to how far employers can push their existing workforce. I expect that as the recovery becomes more entrenched, employers will become more confident and create additional jobs.
Figure 12
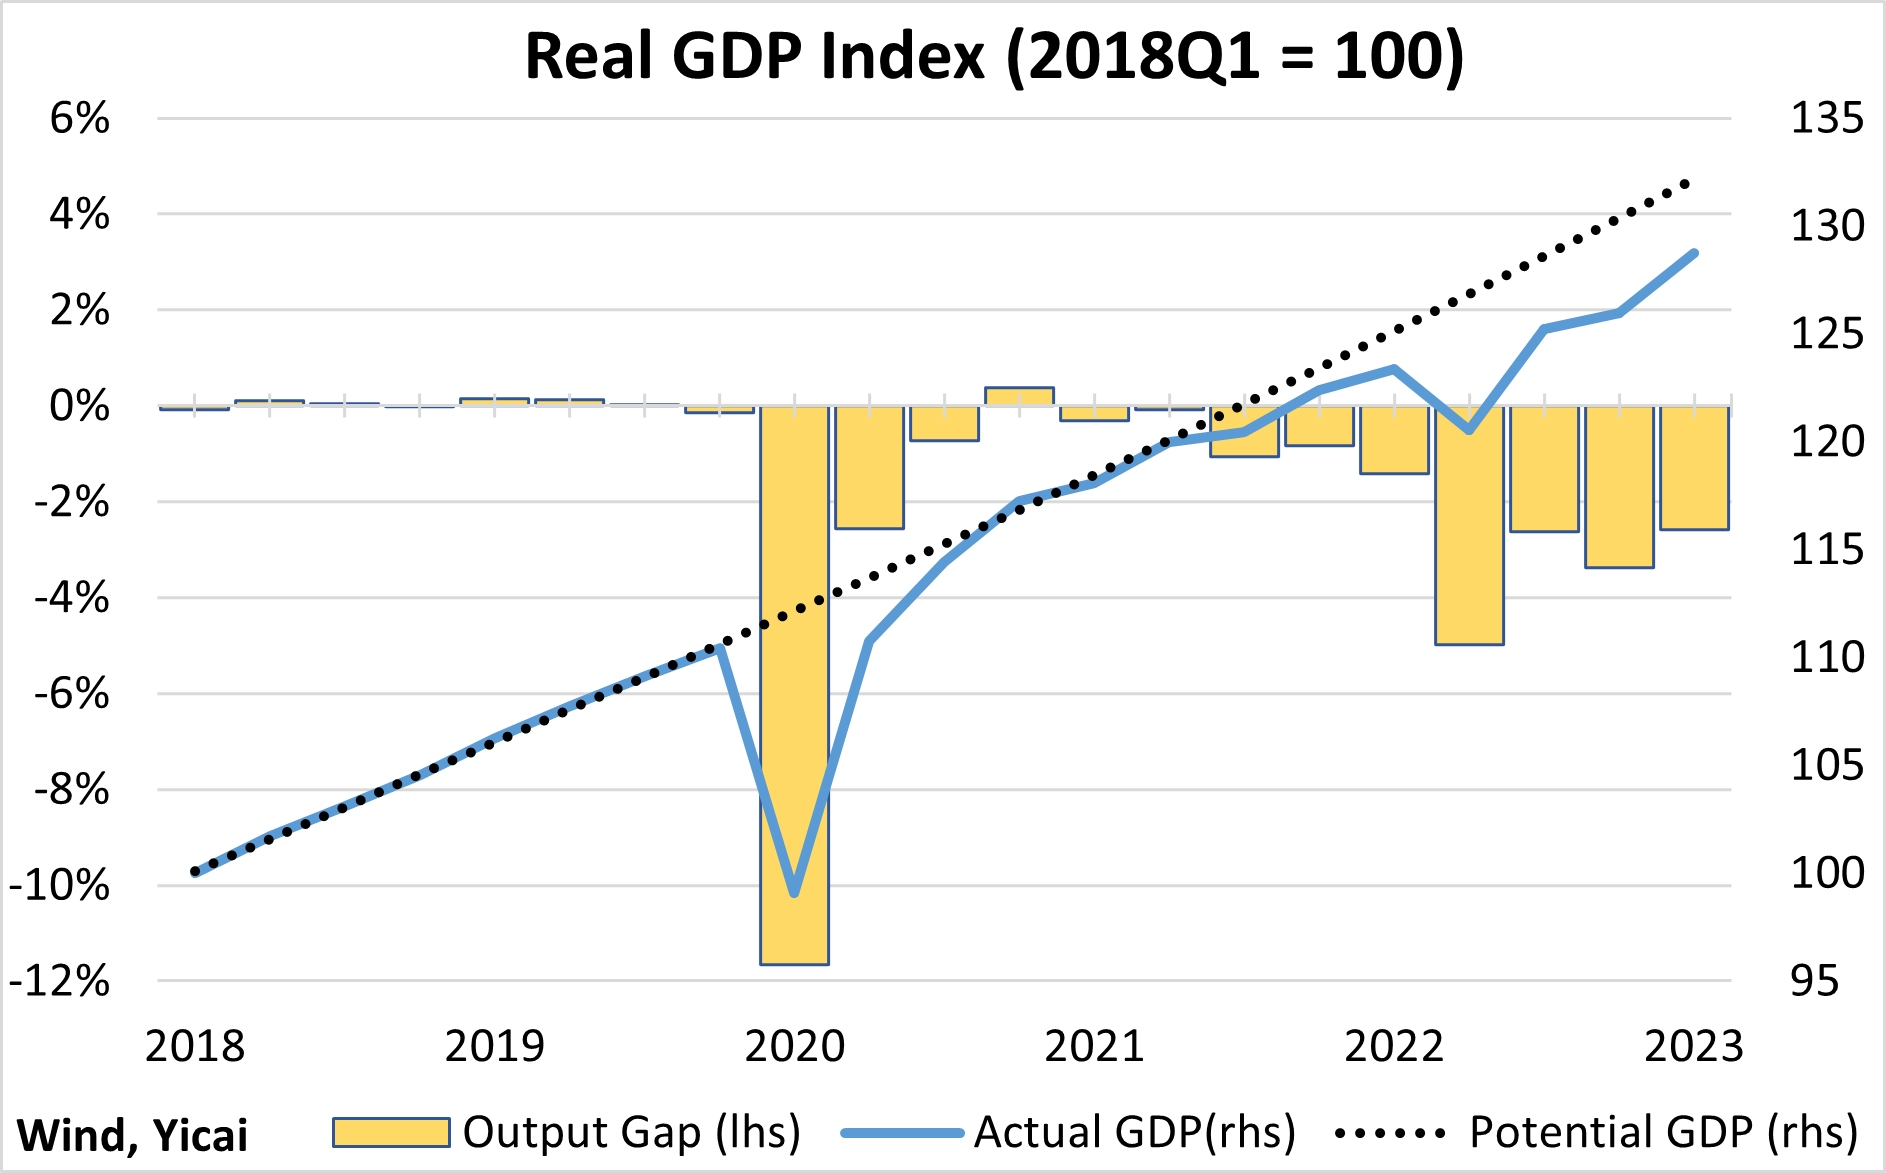
The April data portray an economy in which demand is catching up to supply. They do not suggest that the economic recovery is running out of steam. A period of demand growing faster than supply is exactly what is needed to close the output gap – the difference between potential and actual GDP. I estimate the output gap to have been some 2.6 percent of GDP in the first quarter (Figure 13).
The economy only grew by ½ of one percent in the second quarter last year. If its potential growth is in the 5 percent range, I would expect GDP to grow by 9 to 10 percent this quarter. The April data indicates that it is headed in the right direction.
Figure 13
 Mark KrugerBased in Shanghai, Mark Kruger holds Senior Fellow appointments at the Yicai Research Institute, the Centre for International Governance Innovation and University of Alberta’s China Institute. Between 2020 and 2023, Mark was the Opinion Editor at Yicai Global. Previously, he had a 30-year career with the Bank of Canada in the course of which he served as a Senior Advisor to the Canadian Executive Director at the IMF and the head of the Economic and Financial Section of the Canadian Embassy in Beijing.


