 Is the Chinese Economy Running Out of Gas?
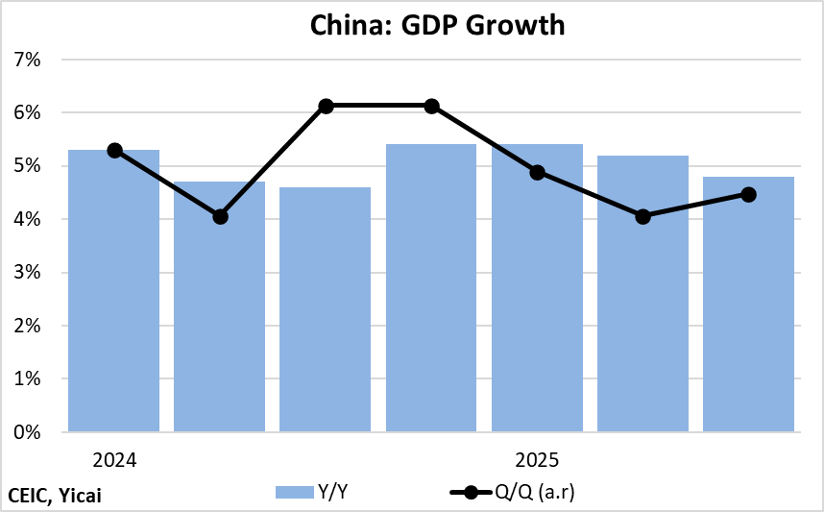
(Yicai) Oct. 28 -- China’s National Bureau of Statistics (NBS) reported that GDP growth for the third quarter was 4.8 percent. The data came in as expected. The economy continues to be pressured by the US’s tariffs and the downturn in the property market. Q3’s growth slowed from 5.2 percent in the previous quarter and 5.4 percent in Q1.
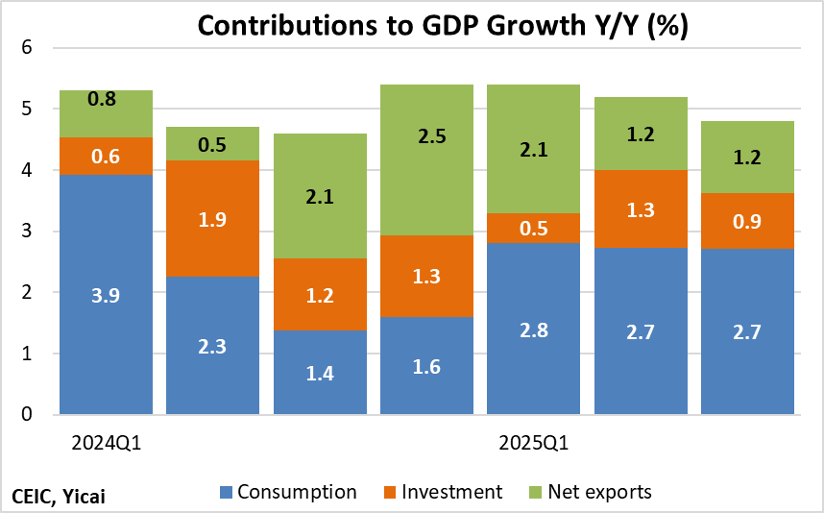
Looking at the demand components, net exports, once again, made a substantial contribution to GDP growth. Investment weakened, while consumption remained solid (Figure 1).
Figure 1
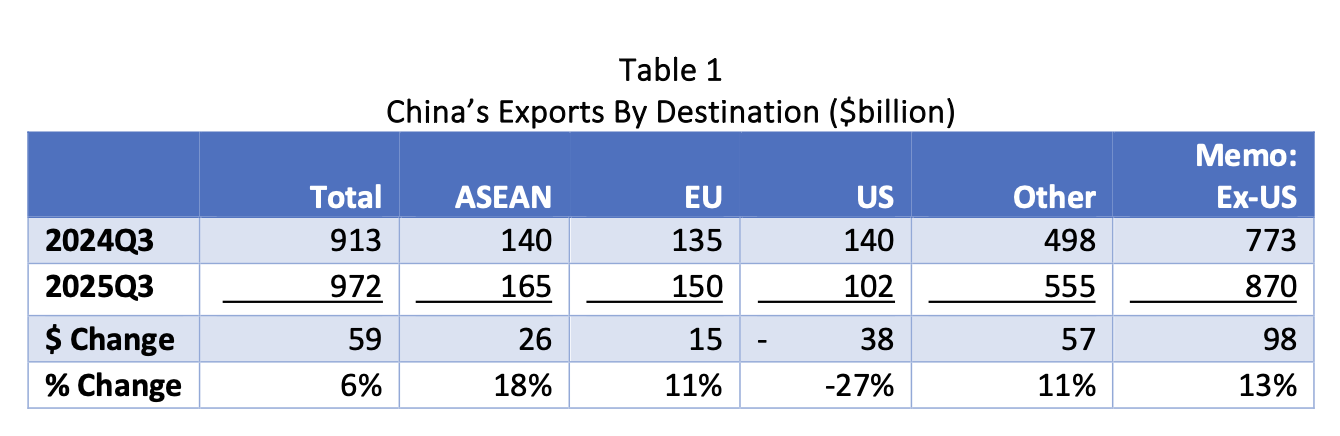
The growth of China’s exports to markets, outside the US, remained strong. Between 2024Q3 and 2025Q3, exports grew by $59 billion or 6% (Table 1). Sales to the US fell by $38 billion, while those to all countries except the US rose by $98 billion. Growth in the major markets except the US was in the teens, more than offsetting the sharp US drop.
The resilience of Chinese exports does not mean that the tariffs imposed by the US have been costless. Indeed, they caused China’s share of US imports to drop from 22 percent in 2017 to just 8 percent in the third quarter. Had China maintained its 2017 US import share, its Q3 exports would have been $114 billion higher.
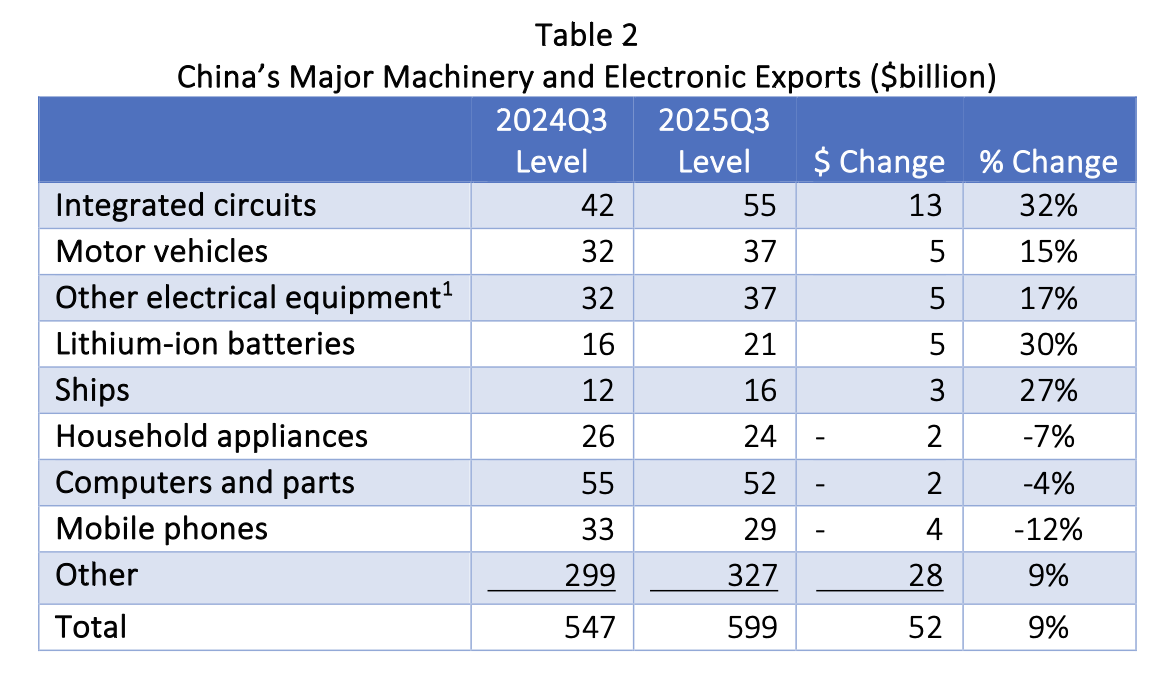
Not only has the geographic distribution of Chinese exports shifted over time, their industrial composition has evolved as well. In response to changing demand patterns, exports pivoted away from consumer goods, like computers, mobile phones and household appliances, to producer inputs, like integrated circuits, lithium-ion batteries and other electrical equipment. Exports of motor vehicles and ships were also strong in Q3 (Table 2).
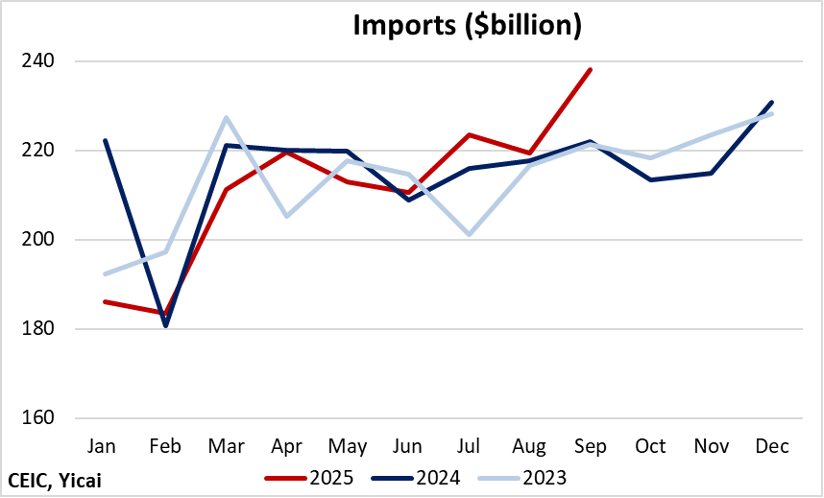
Imports rose significantly in Q3 (Figure 2). They were up 4 percent Y/Y, following declines of 1 and 6 percent in the two previous quarters. Imports of semiconductor manufacturing equipment (+21 percent) and integrated circuits (+12 percent) grew particularly rapidly in the quarter.
Import growth has been understated by the fall in major commodity prices. For example, the value of iron ore imports fell by 2 percent Y/Y in Q3, while the imported tonnage increased by 6 percent. Similarly, the value of crude oil imports fell by 12 percent, while the volume increased by 5 percent.
Figure 2
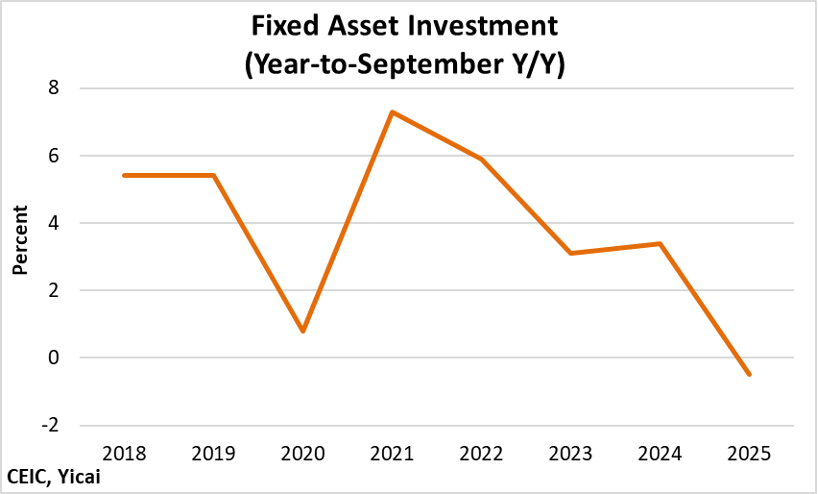
Fixed asset investment growth has turned negative this year. An even weaker outturn than in pandemic-depressed 2020 (Figure 3).
Figure 3
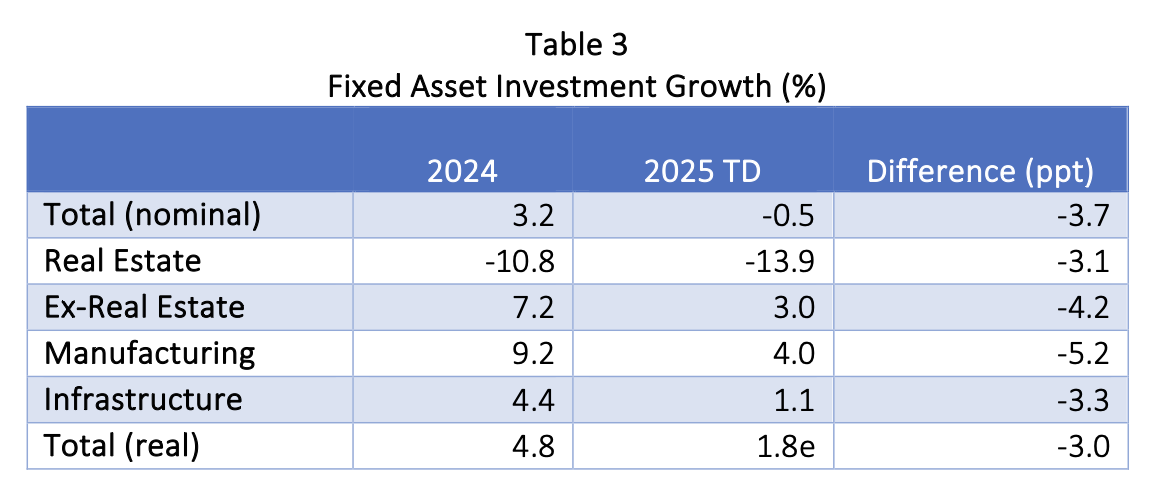
Looking at the fixed asset components, we see that investment in real estate has been an even larger drag, so far this year, than it was in 2024 (Table 3). More importantly, there has been a significant slowing in fixed asset investment ex-real estate. The government’s efforts to rein in excess capacity may be playing a role in capping manufacturing spending. At the same time, concerns about local government indebtedness are likely putting the breaks on infrastructure investments.
Falling prices are playing a role in depressing the headline fixed asset investment depicted in Figure 3, which is reported in nominal terms. For 2024, the NBS reported that fixed asset investment came in at 4.8 percent in real (price-adjusted) terms. This was 1.6 percentage points higher than the headline number and represents the falling cost of fixed asset investment. The NBS has not yet released a number for the first three quarters of 2025, but I estimate that fixed asset investment growth was 1.8 percent in real terms. This is 2.3 percentage points higher than the headline number and indicates that fixed asset investment costs have been falling more rapidly this year.
Much of the analysis of Chinese consumer spending focuses on the retail sales data released by the NBS. Like the headline fixed asset investment numbers, retail sales are reported in nominal terms and, here too, falling prices can mask important trends.
Take auto sales, for example. In the third quarter, the number of passenger cars sold was up 14 percent. But, because of intense competition in the auto market, the value of these sales did not change. Similarly, the value of petroleum products sold in the third quarter was down close to 7 percent from a year earlier. Yet, this decline was entirely due to a fall in pump prices. With autos and gasoline accounting for some 28 and 14 percent of goods sales, respectively, at large retail establishments, we can see how falling prices can affect the consumption picture.
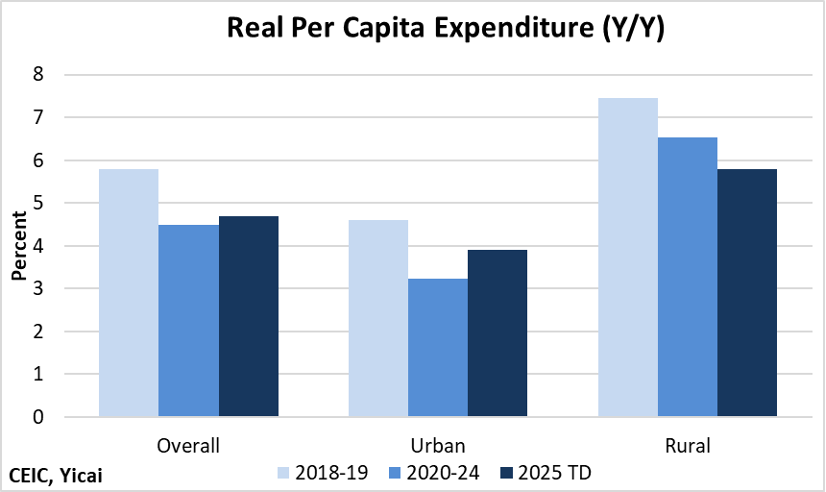
To assess consumption, I prefer to look at the data of per capita expenditure, which the NBS reports in real terms.
So far this year, real per capita expenditure rose by just under 5 percent (Figure 4). This is a touch stronger than over 2020-24 but about 1 percentage point slower than before the pandemic. Consumption in urban areas has rebounded a bit more sharply, while rural spending has been held back by low agricultural prices.
Figure 4
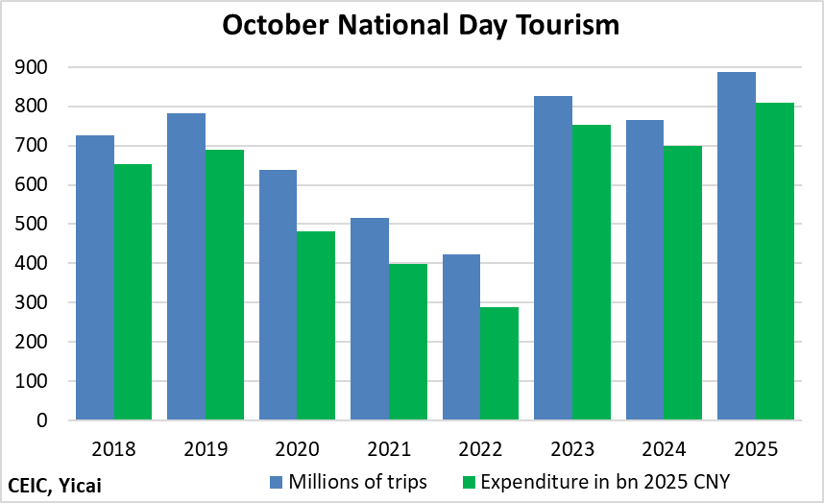
Looking at early indications for the fourth quarter, consumers’ willingness to spend was evident during the recent National Day Golden Week. The number of person-trips was up 16 percent from last year and 14 percent from 2019 (Figure 5). I have adjusted the NBS’s spending numbers to account for inflation. In price-adjusted terms, spending was up 16 percent from last year and stood 17 percent higher than in 2019.
Figure 5
It looks like GDP growth for the year will reach the government’s 5 percent target.
GDP increased by 5.2 percent over the first three quarters. That means it would have to slip below 4.4 percent in the fourth quarter for 2025 growth to miss 5 percent. While this is possible, I think it is unlikely given the economy’s momentum.
However, looking ahead to 2026, it is not clear that 5 percent growth can be sustained.
Growth this year benefitted from a strong hand off at the end of 2024, with the level of GDP increasing by just over 6 percent quarter-over-quarter at annual rates (Figure 6). Subsequently, for each of the quarters in 2025, quarter-over-quarter growth has been below 5 percent at annual rates. The year-over-year growth rates can be thought of as an average of the quarterly ones. Eventually, this average converges to the most recent observations.
This arithmetic points to how the economy would evolve if there were no major shocks. However, a variety of positive and negative macroeconomic shocks are bound to occur that will take us off of our arithmetic pathway. For example, the US and China could reach a deal that significantly reduces trade tensions. Or the property market could cease being a drag on GDP growth. On the other hand, we could see a tragic escalation in the European and Middle Eastern conflicts. Of course, the way in which policy responds to these shocks is a key variable.
As the year draws to a close, there is no substitute for a careful analysis of the most recent economic data. In particular, we need to be aware of the ways falling prices can skew the numbers.
Figure 6
[1] Other than lithium-ion batteries.
 Mark KrugerBased in Shanghai, Mark Kruger holds Senior Fellow appointments at the Yicai Research Institute, the Centre for International Governance Innovation and University of Alberta’s China Institute. Between 2020 and 2023, Mark was the Opinion Editor at Yicai Global. Previously, he had a 30-year career with the Bank of Canada in the course of which he served as a Senior Advisor to the Canadian Executive Director at the IMF and the head of the Economic and Financial Section of the Canadian Embassy in Beijing.


