 Is the US Dollar: As Good As Gold?
(Yicai) Sept. 3 -- I am not a very good investor.
My first venture into the markets was the purchase of a small bit of gold bullion. I liked the idea of owning a physical asset. Armed with a degree in economics, I knew that gold had a long history as a store of value. I understood that it was a good hedge against inflation, and I had seen its price jump from just over $200 at the end of 1978 to more than $660 at the beginning of 1980. So, in late 1982, having accumulated some savings, I jumped at the chance to buy an ounce for only $400, and I picked up a small gold bar.
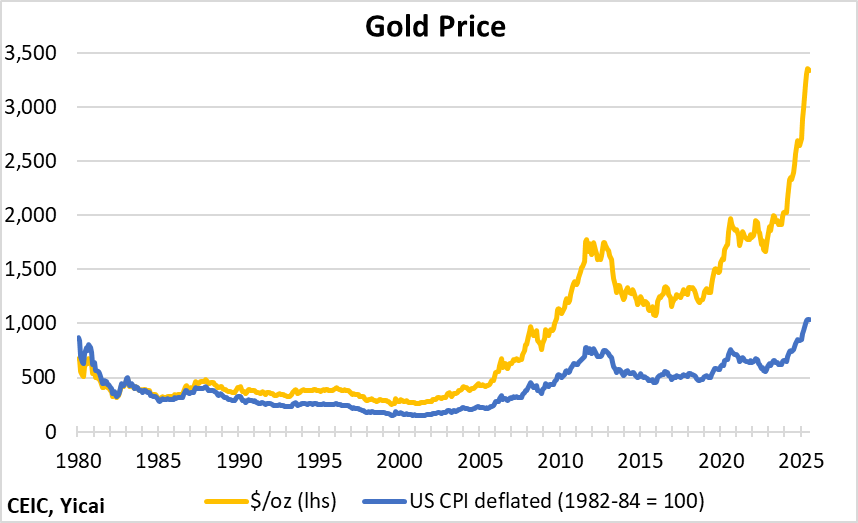
The price of gold has been on a tear recently and the value of my little bar is worth nearly 9 times as much as I paid for it (Figure 1).
I patted myself on the back for being so savvy, but then I had a closer look at the numbers. After almost 43 years, the annual return on my investment in gold averaged 5 percent. However, more than half of this gain has simply been compensation for inflation. The US consumer price index rose by an annual average of 2.8 percent over the same period. As Figure 1 shows, gold’s rise has been much less impressive in inflation-adjusted terms. Accounting for the increase in prices, my annual average real return has been just over 2 percent.
Young and inexperienced, I did not understand that I would have done much better to purchase a low-cost mutual fund that invested in the S&P 500 basket of stocks. The annualized return of the S&P 500 index was 9.4 percent during this period. It would have risen to 11.9 percent had I opted to reinvest my dividends (some of this return would have gone to pay the mutual fund fees).
To put it more starkly, while my gold bar is now worth close to $3500, had I invested the same $400 into the S&P 500 index, reinvested the dividends and paid 1 percent a year in mutual fund fees, the value of my portfolio would now be in excess of $33,000.
Figure 1
While I now invest in the index, I have kept my little gold bar and I have watched the rally in gold with interest.
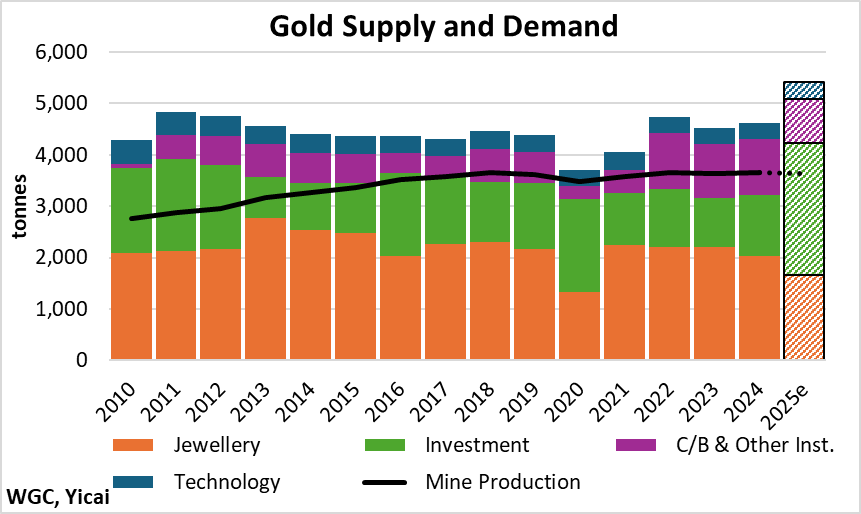
To understand why the gold price has risen so rapidly, I turned to the data supplied by the World Gold Council on supply-demand dynamics (Figure 2). The solid black line shows the production of gold from mines. The sources of demand for gold – for jewelry, for investment, for holdings by central banks and other institutions, and for technological purposes – are given by the coloured bars. I have estimated the supply of and demand for gold in 2025 by applying the growth rates for the first half of the year to 2024’s annual values.
The first thing to notice is that the demand for gold typically exceeds the newly-mined supply. The market balances by “recycling gold” – people deciding to sell their old jewelry for cash when the price is high.
The second thing to notice is that the relatively large demand for gold jewelry is also price sensitive. At this year’s high prices, the demand for gold jewelry is expected to be 40 percent lower than in 2013 when gold was about $1400 an ounce.
If current trends persist, the demand for gold this year will be 13 percent higher than the 2022-24 average, with the increase being driven by very strong investment demand. The investment demand for gold this year could be some 2600 tonnes, up from an average of 1100 tonnes over 2022-24.
Figure 2
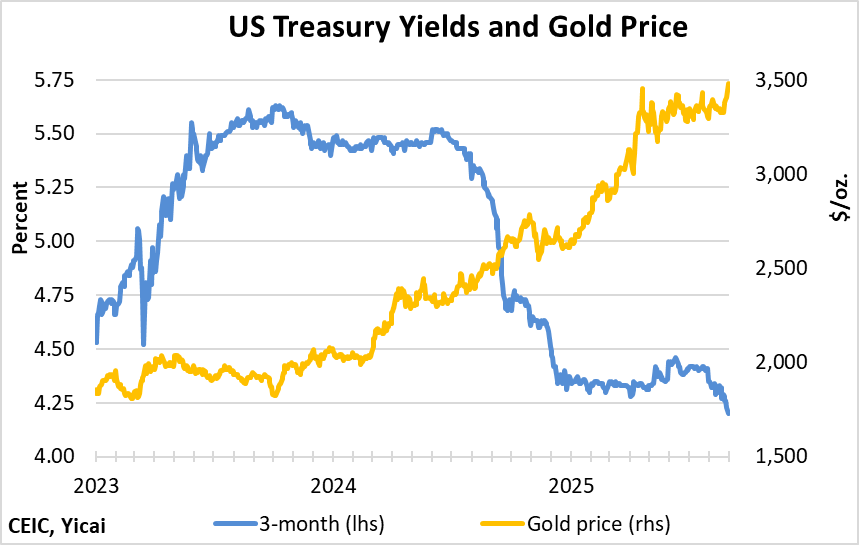
The strong investment demand for gold and the run up in the gold price appear to be related to concerns about US macroeconomic policy. The gold rally began in the fourth quarter of 2023 with the peaking of US short-term interest rates. It picked up speed as rates fell sharply in 2024 (Figure 3).
US Treasuries are also seen to be a safe asset and, therefore, are an alternative to holding gold. When Treasury yields drop, gold becomes more attractive and vice versa.
There is another important linkage between these two assets. A too rapid fall in Treasury yields could portend a rise in inflation and lead investors to buy gold as a hedge.
Figure 3
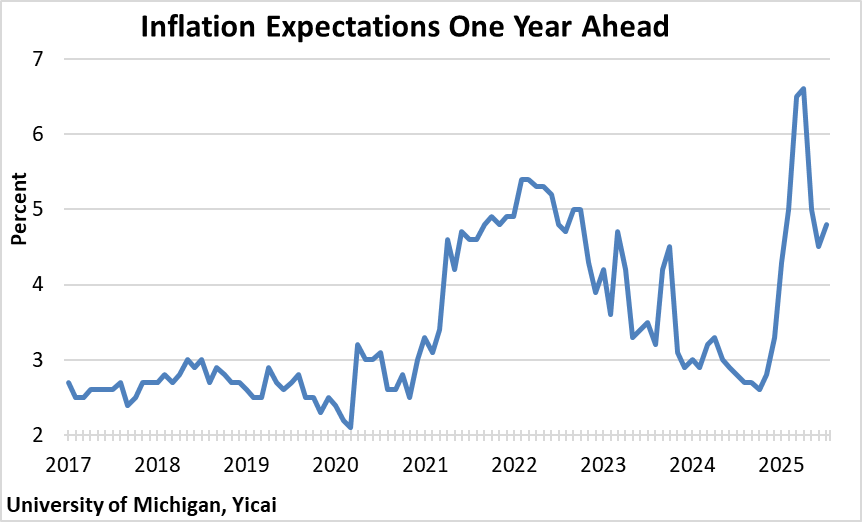
Indeed, expectations for inflation 12 months ahead, as measured by the University of Michigan’s consumer survey, spiked this year as the Trump Administration imposed large tariffs on US imports. These tariffs are widely expected to raise consumer price inflation. The most recent reading from the University of Michigan shows that consumers believe inflation in the next year will be close to 5 percent. While this is a significant fall from expectations earlier this year, households’ inflation expectations remain well above pre-pandemic levels (Figure 4).
It remains to be seen how much President Trump’s efforts to control the membership of the Federal Reserve’s Board of Governors will affect perceptions of future inflation.
Figure 4
Anxiety over the future course of US fiscal policy may also be feeding the strong investor appetite for gold.
In its Long-Term Budget Outlook, the Congressional Budget Office (CBO) projects that the federal government will run annual deficits in the 5-6 percent of GDP range to 2030. And it sees further deterioration in the government’s fiscal position over the subsequent two and a half decades (Figure 5).
Figure 5
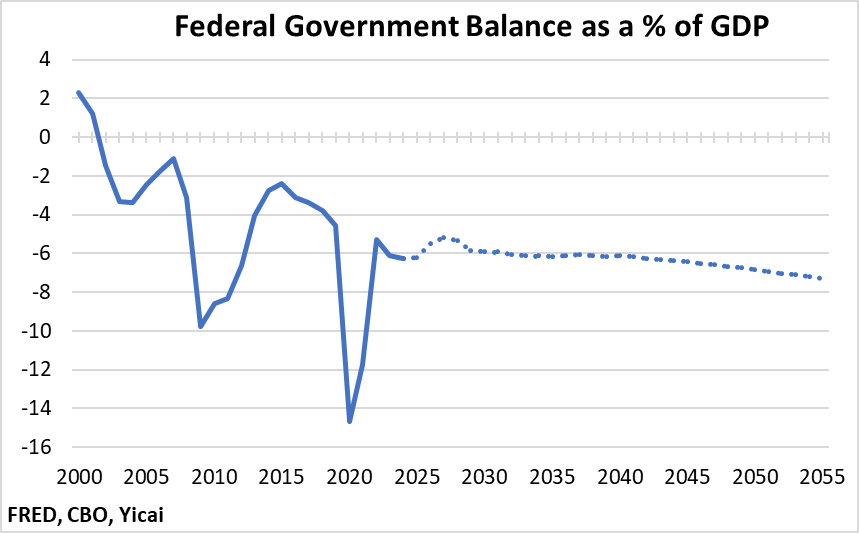
As a result of these persistent, large deficits, the CBO forecasts that federal debt held by the public will rise from 97 percent of GDP last year to 109 percent of GDP in 2030 and 156 percent of GDP in 2055. As a result of the government’s increase in indebtedness, interest payments will rise to 20 percent of government revenue in 2030. By 2055, the CBO’s projection suggests that interest payments will consume 28 percent of government revenue.
The CBO’s projections imply a large increase in debt issuance and more onerous debt service. Such dire forecasts could certainly be leading investors to consider gold, rather than Treasuries, as a safe asset.
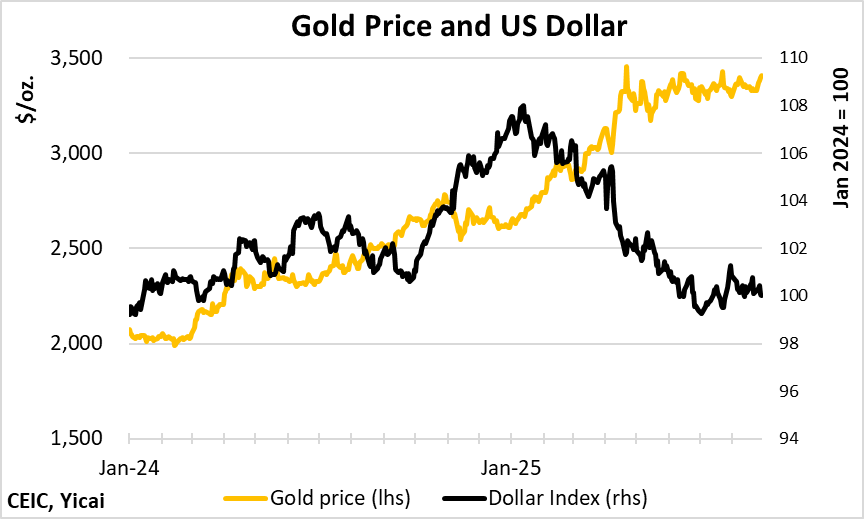
In part reflecting the substitutability of US Treasuries and gold as safe assets, the dollar tends to drop when the price of gold rises. So far this year, the price of gold is up 31 percent while the US dollar is down by 7 percent against a basket of major currencies (Figure 6).
Figure 6
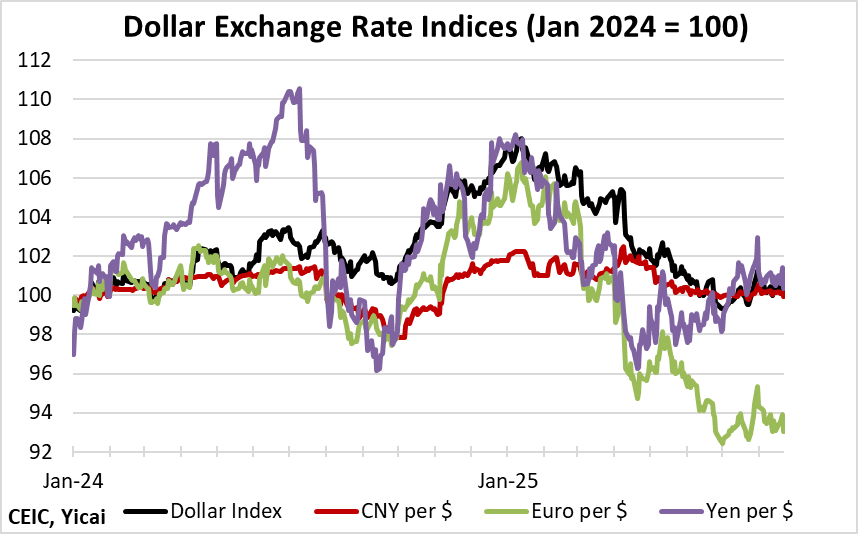
Digging deeper, the dollar’s performance against the individual currencies is instructive (Figure 7). Looking through the volatility, the dollar has been fairly stable against the Japanese yen and the Chinese renminbi, but it has depreciated against the euro.
There may be many reasons for the dollar’s weakness against the euro, but one possibility is that the same forces that are driving investors to hold gold are pushing them to consider the euro as a global safe asset.
Christine Lagarde, President of the European Central Bank, recently stated that the dominant role of the dollar is no longer certain. She believes that this is a key moment for the euro – the world’s second most used currency – to play a greater role in the international monetary system.
Figure 7
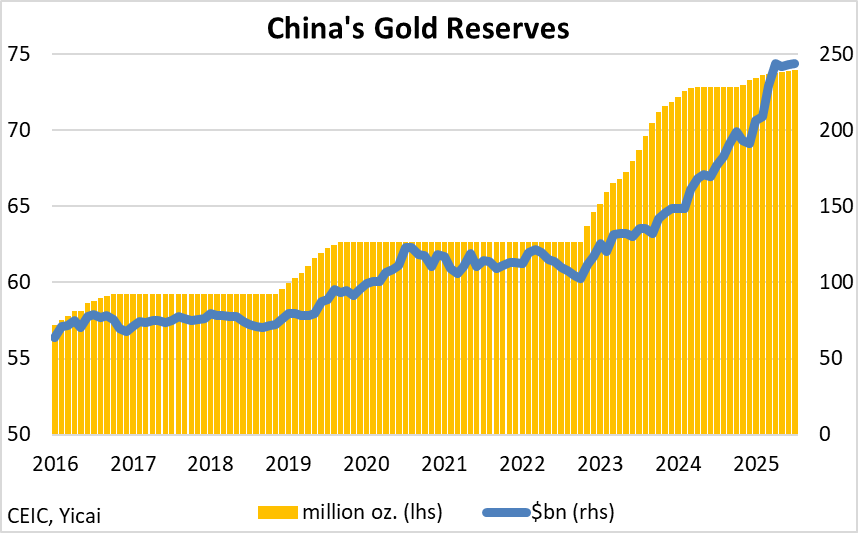
The People’s Bank of China (PBOC) has also been busy accumulating gold.
Its holdings rose to 74 million ounces in July from 63 million in July 2022, an 18 percent increase. Because of the rise in gold prices, the value of its holdings is up 122 percent over the same period (Figure 8). Gold now accounts for close to 7 percent of the PBOC’s international reserves, twice the share of three years ago.
The foregoing analysis makes it easy to understand why the PBOC wants to diversify out of US Treasuries and into alternative safe assets. But is gold the right choice?
Figure 8
What if the PBOC decided to invest in a diversified basket of stocks like the S&P 500?
A well-diversified basket of US stocks has long been one of the best-performing investments one can make. Like gold, stocks can be an effective inflation hedge. In addition, the potential credit risks faced by the US government may have little impact on well-run, blue-chip companies. Moreover, there are costs involved with holding millions of ounces of gold that eat into its potential returns.
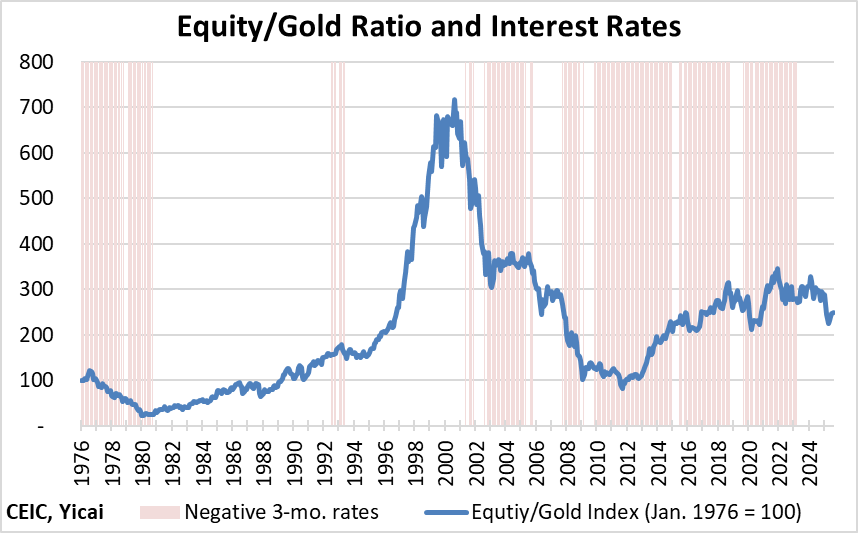
In order to assess the near-term prospects of holding stocks versus gold, it is helpful to consider the equity-gold ratio. This ratio is simply the value of the S&P 500 index divided by the price of gold. Note that this ratio ignores the dividends. It also ignores the cost of holding gold bullion. I have indexed the ratio to January 1976 = 100.
Consistent with my own investment experience, Figure 9 shows that the equity-gold ratio more than doubled between January 1976 and July 2025. In the short run, however, the ratio is quite volatile. Some of the higher-frequency movements are due to the stance of US monetary policy. When the difference between three-month Treasury yields and 12-month inflation is negative, gold tends to outperform stocks and the equity-gold ratio falls or rises less rapidly.
I believe the near-term performance of these two assets will depend critically on the Federal Reserve’s conduct. Three-month real rates are positive but declining and inflation expectations are high. Should rates turn negative, it would be relatively bullish for gold and this is what the market seems to be expecting.
Figure 9
Notwithstanding short-run, cyclical developments, stocks tend to outperform gold over time. This is because the value of the stock market depends on corporate earnings which themselves are functions of nominal GDP and productivity. Gold, on the other hand, is traditionally seen as valuable and its value increases in times of uncertainty.
By buying equities, China may not only make a superior investment, it could also capture “geopolitical returns”. President Trump is a dealmaker and a Chinese offer to invest billions in the S&P 500 could be part of a grand bargain that helps reset relations with the US.
 Mark KrugerBased in Shanghai, Mark Kruger holds Senior Fellow appointments at the Yicai Research Institute, the Centre for International Governance Innovation and University of Alberta’s China Institute. Between 2020 and 2023, Mark was the Opinion Editor at Yicai Global. Previously, he had a 30-year career with the Bank of Canada in the course of which he served as a Senior Advisor to the Canadian Executive Director at the IMF and the head of the Economic and Financial Section of the Canadian Embassy in Beijing.


