 Despite Tariffs, China’s GDP Exceeds Expectations
(Yicai) July 21 -- China’s National Bureau of Statistics (NBS) recently released the National Accounts for the second quarter. It reported that GDP grew by 5.2 percent year-over-year, modestly exceeding the expectations of the Chief Economists surveyed by the Yicai Research Institute.
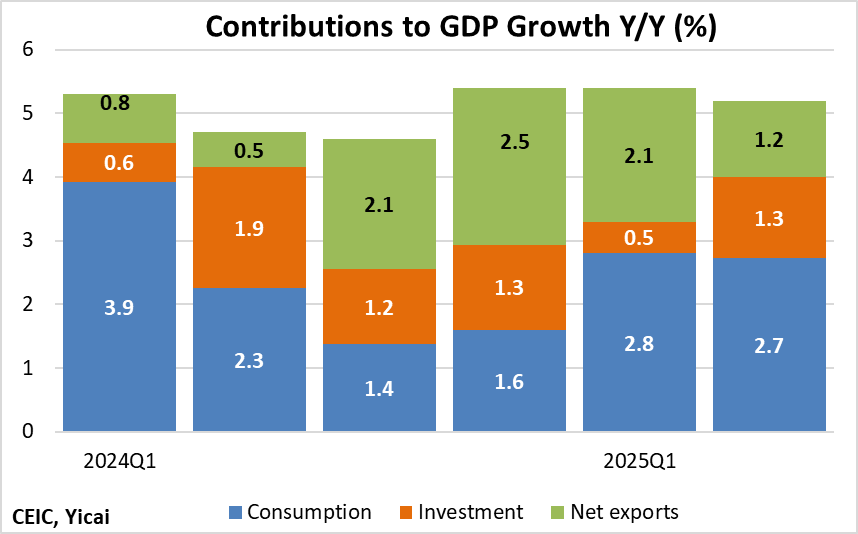
Growth in the first half of the year was 5.3 percent. Despite the concerns about the deterioration in the global trading system and the effects of the property market downturn, growth has accelerated from 5.0 percent in 2024. Compared to last year, we are seeing stronger consumption and net exports, partially offset by weaker investment (Figure 1).
Figure 1
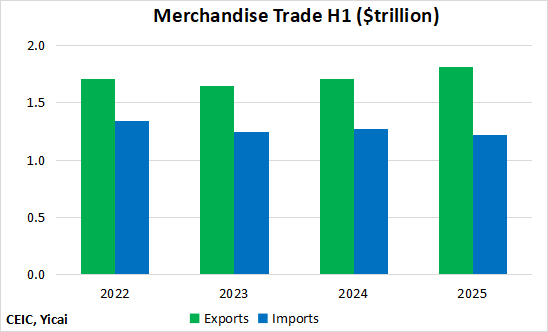
Net exports contributed 1.7 percentage points to GDP’s 5.3 percent growth in H1. This is an unusually large contribution. In US dollar terms, exports increased by 6 percent while imports fell by 4 percent. The trade balance over the first six months was USD586 billion, up from USD435 billion in the first half of 2024 (Figure 2).
Figure 2
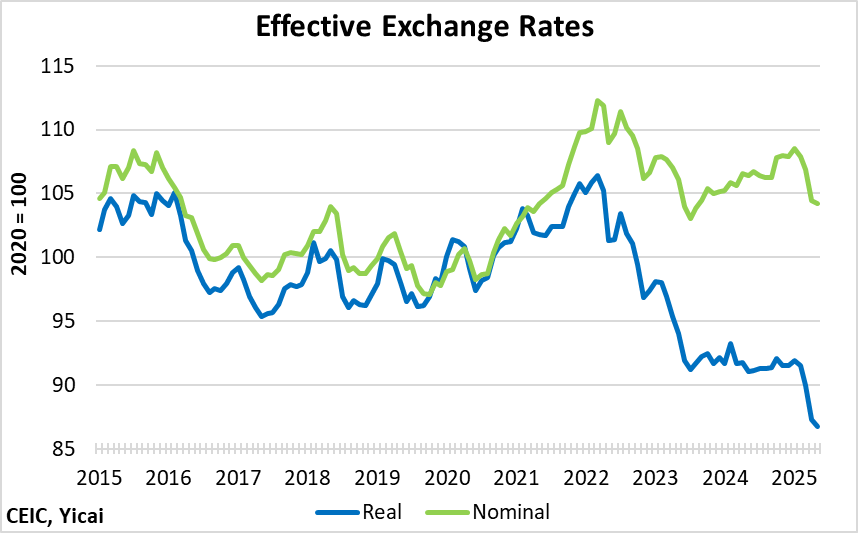
China’s trade surplus is growing, in part, because of relatively low domestic prices.
Figure 3 presents China’s effective exchange rates. Its nominal effective exchange rate is simply a trade-weighted average of China’s bilateral exchange rates. The real effective rate adjusts for relative prices.
Between 2015 and mid-2021, China’s nominal and real effective rates tracked each other quite closely, implying that China’s inflation rate and those of its trading partners were similar. Once the inflationary effects of Covid were felt, the two exchange rates began to diverge. Compared to its trading partners, China’s fiscal policy was relatively restrained and the rise in its consumer prices was much more subdued.
While China’s nominal effective exchange rate is essentially at its 2020-22 average level, its real effective exchange rate is 15 percent lower. This has given China a price edge – making its exports more attractive and imports more expensive.
Figure 3
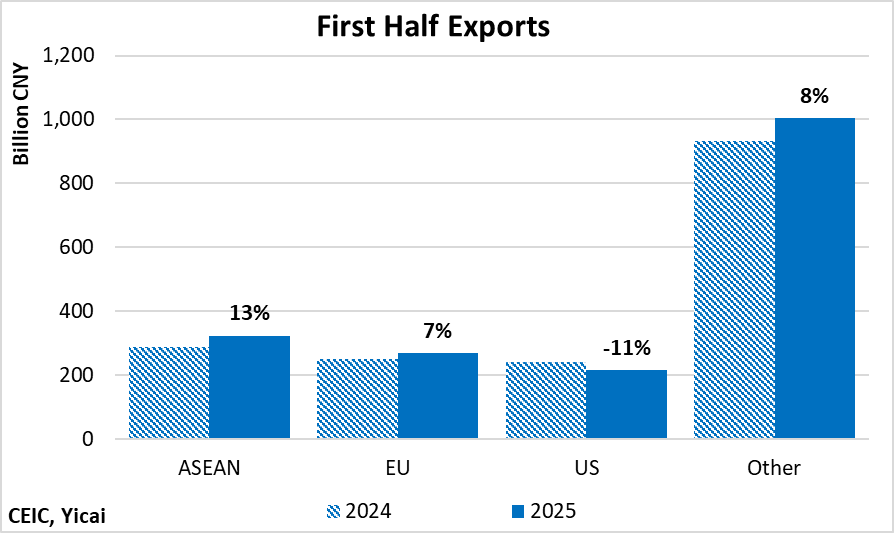
While the Trump Administration’s tariffs have engineered a fall in China’s exports to the US, China’s sales to other destinations have remained strong (Figure 4). Exports to ASEAN countries were up 13 percent from the first half of 2024, those to the EU were up 7 percent and those to all other countries rose 8 percent.
Figure 4
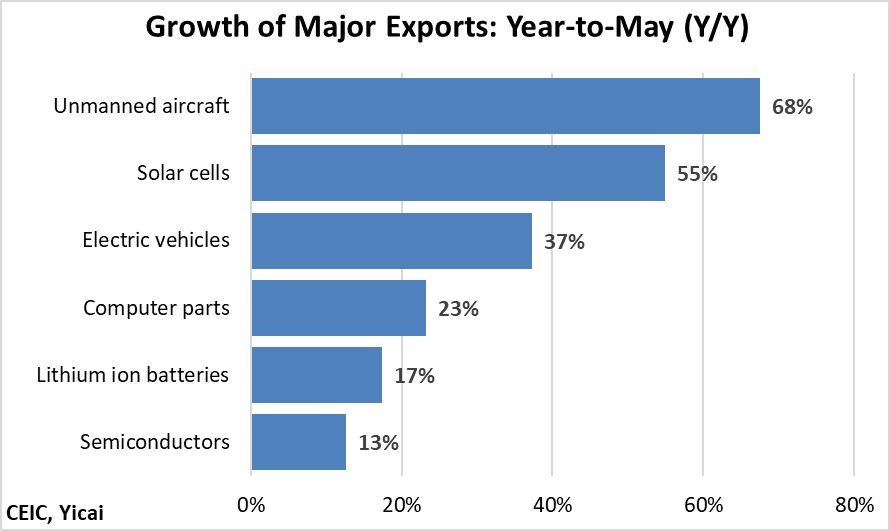
While the full detail on June exports is not yet available, the data through May show sales of a wide variety of high-tech products have been growing rapidly, including unmanned aircraft, solar cells, EVs, computer parts, batteries and semiconductors (Figure 5).
Figure 5
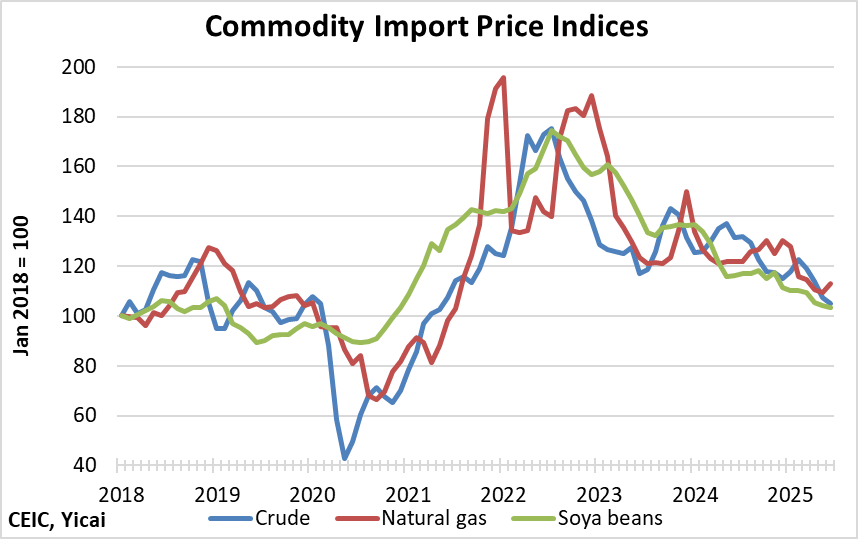
The fall in China’s imports is due, in part, to the decline in commodity prices. For example, the prices that China has had to pay for key imports like soya beans, crude oil and natural gas are down by 15, 13 and 8 percent, respectively, year-over-year, in the first half (Figure 6).
Figure 6
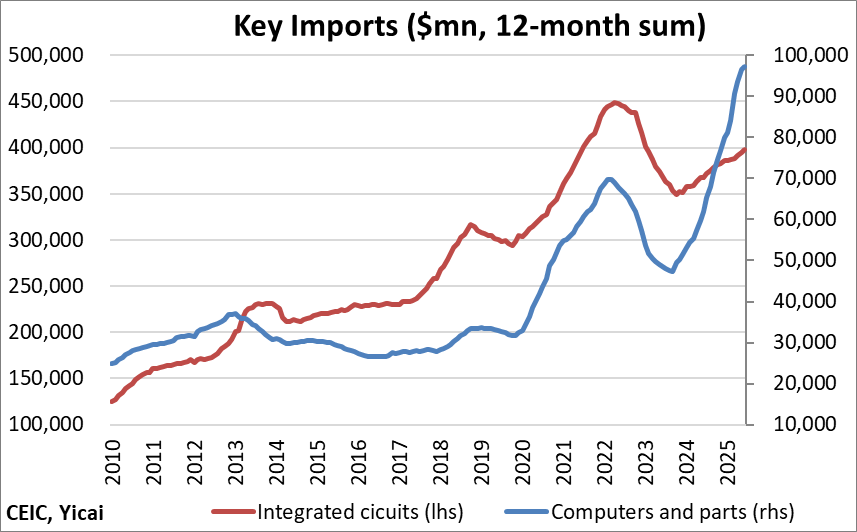
Chinese demand for many imported products remains strong (Figure 7). China purchased almost USD400 billion in integrated circuits in the last 12 months (+7 percent Y/Y). While imports of computers and parts are only a quarter as large, they are up more than 50 percent so far this year.
Figure 7
Consumption contributed 2.8 percentage points to GDP growth in H1, up from 2.2 percentage points in 2024. We are still a long way below the pre-pandemic contribution of 4 percentage points, but are up from the dismal consumption posted in the second half of last year (Figure 1 above).
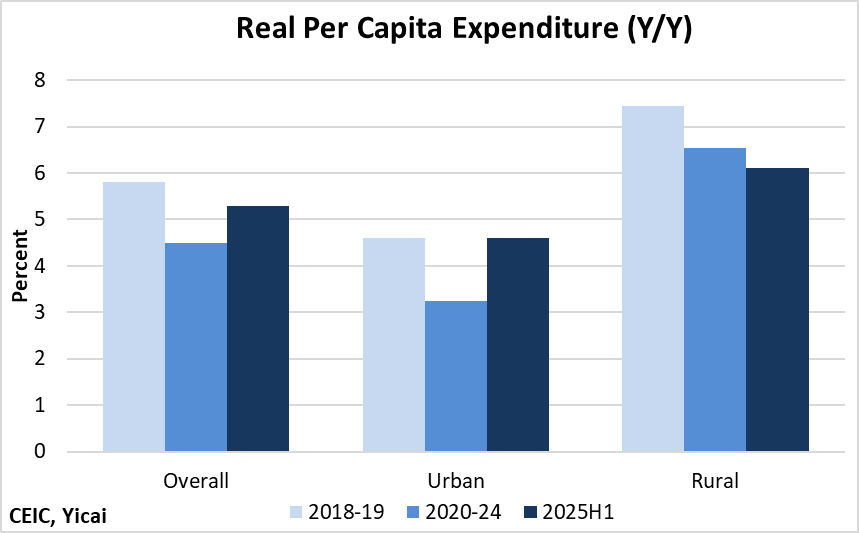
The NBS’s household survey shows that real per capita consumption rose by 5.3 percent in the first half. This is up from the 4.5 percent recorded over 2020-24 but still below the pre-pandemic’s 5.9 percent (Figure 8). In fact, among urban households, real consumption has already returned to its pre-pandemic rate, while falling agricultural prices have restrained expenditure among rural households.
Figure 8
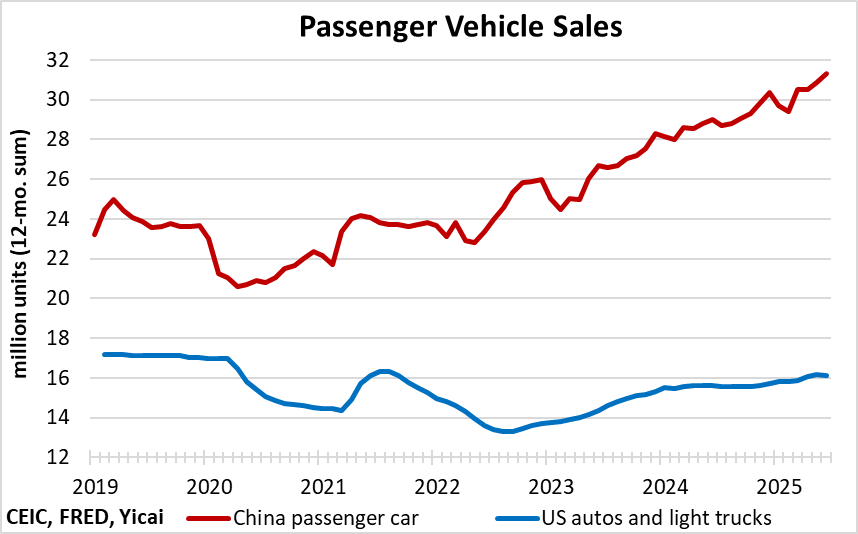
China’s auto market reflects this buoyant consumer demand. Sales of new passenger cars are up 13 percent, so far this year, in volume terms.
In the US, sales of autos and light trucks are struggling to return to the 17 million sold during 2019. Meanwhile, China’s passenger car sales are more than 30 percent above their 2019 levels (Figure 9). In the auto market at least, it is the US, not China, that appears to be suffering from insufficient demand.
Figure 9
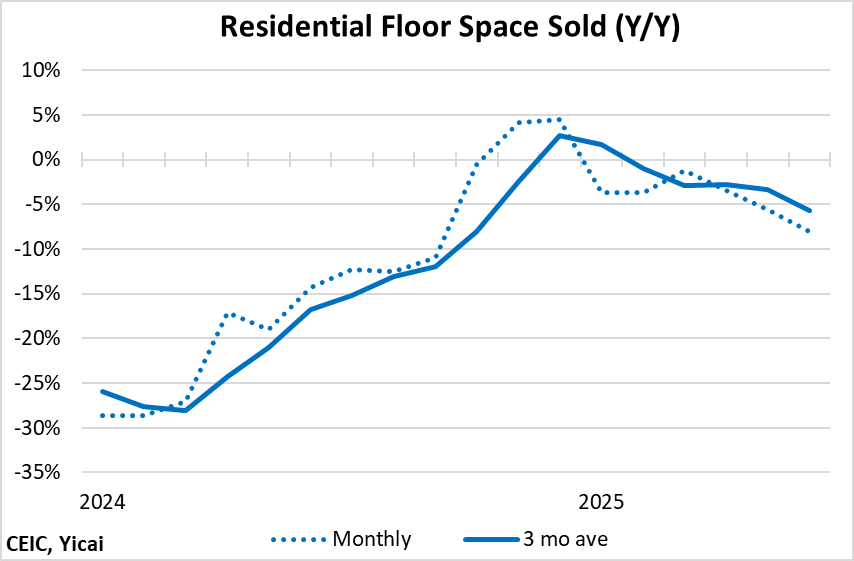
The anticipated rebound in the property market has not yet materialized.
Sales of new residential floor space have drifted lower after briefly turning positive in late 2024 (Figure 10). Despite improved affordability, households are not inclined to buy new homes while prices continue to slip.
Figure 10
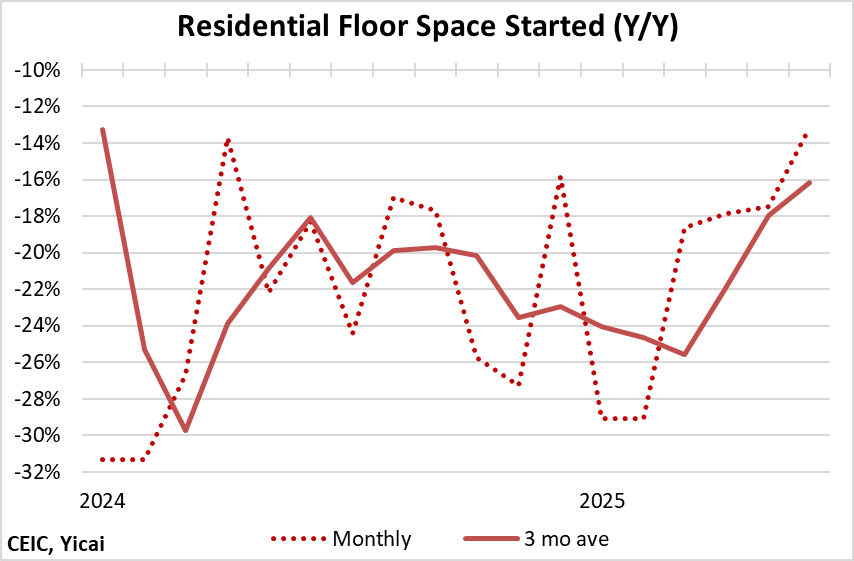
On the supply side, there seems to be some moderation in the fall in new home starts (Figure 11).
Forward-looking indicators suggest further moderation is possible in coming months. The value of land purchased by developers, so far this year, is up 26 percent. And domestic sales of excavators are up 23 percent.
Importantly, the fall in starts has been much sharper than that of sales. So far this year, only 0.6 units have been started for every unit sold. Between 2010 and 2024, the starts-to-sales ratio was 1.2. This suggests that starts are too low even for today’s anemic demand and that we could see more of a rebound later this year.
Figure 11
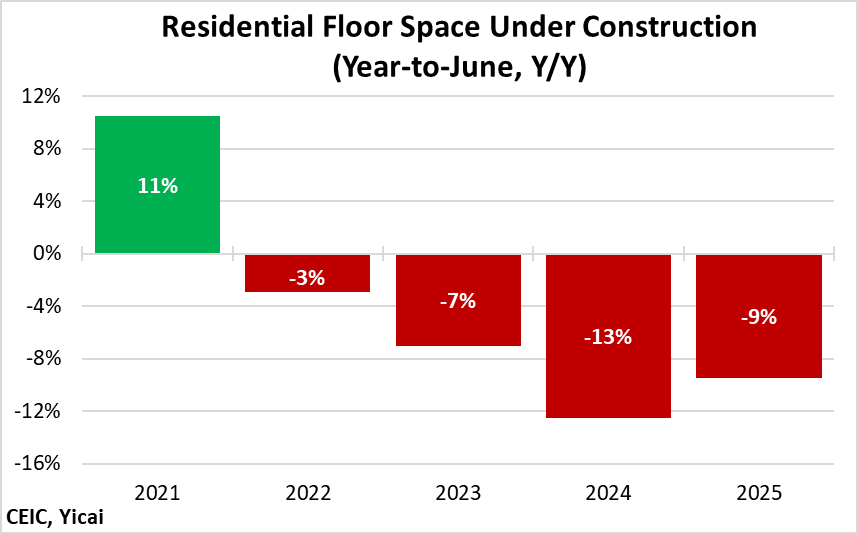
The good news is that the decline in construction activity has bottomed out.
The volume of residential floor space under construction in the first half was down 9 percent year-over-year. This is a more modest decline than the 13 percent fall in the first half of 2024 (Figure 12). While housing continues to make a negative contribution to GDP growth, this year’s contribution is less negative than last year’s. I estimate that the property market is taking off 0.5 percent of GDP less this year than it did in 2024.
Figure 12
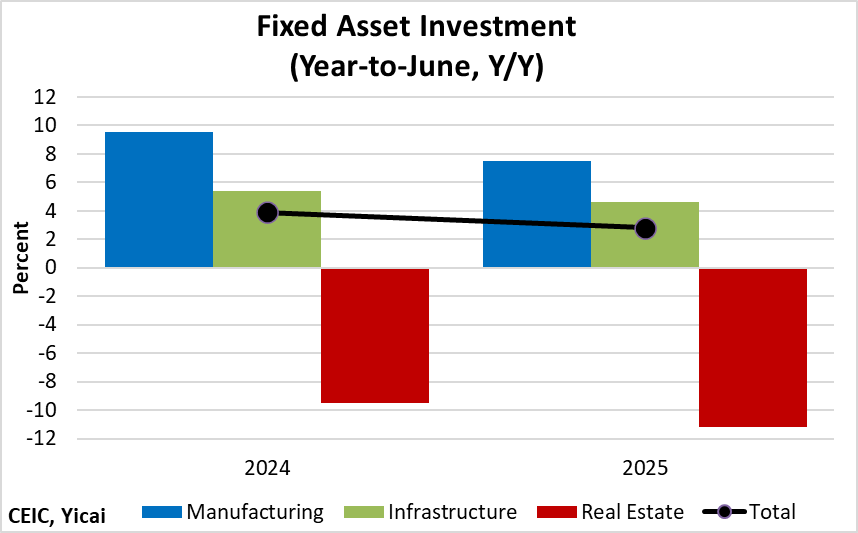
Investment contributed 0.9 percentage points to growth in the first half. This is weaker than its 1.3 percent contribution in 2024. The weakness is widespread. The growth rates of all of the components of fixed asset investment slowed from last year’s pace (Figure 13). Nevertheless, at close to 8 percent, manufacturing investment is still robust and should remain an important source of productivity improvement.
Figure 13
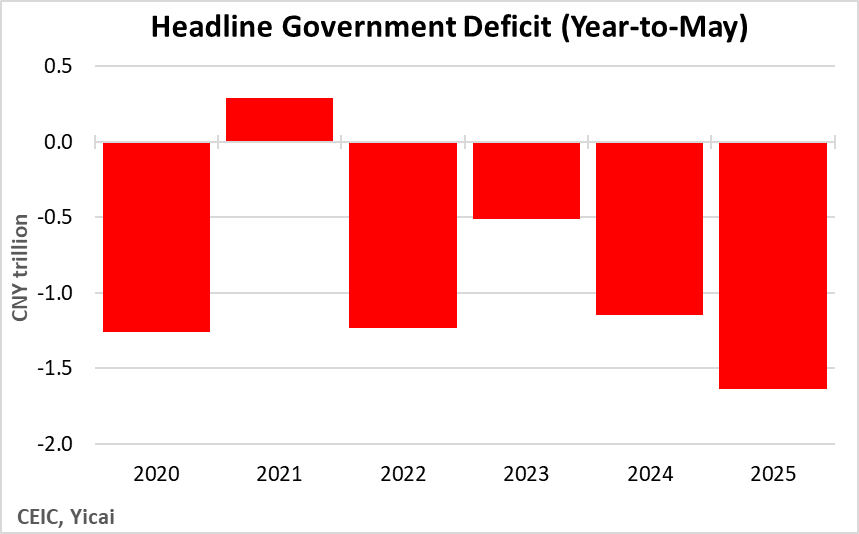
The data through May show that fiscal policy is supporting GDP growth. The cumulative deficit over the first five months of the year was CNY1.6 trillion, CNY0.5 trillion larger than over January-May in 2024 (Figure 14). This translates to stimulus of 0.7 percent of GDP.
Figure 14
The Chinese economy is benefiting from a positive swing in its terms of trade, low domestic prices, fiscal support and the bottoming out of the property market. It is outperforming expectations.
The IMF’s World Economic Outlook, published in April, forecast growth this year at 4.0 percent. The World Bank’s Global Economic Prospects, published in June, foresaw 4.5 percent growth this year. With first-half growth coming in at 5.3 percent, I expect these institutions will revise their forecasts up (again).
There is, of course, an immense amount of uncertainty over how the rest of the year will play out. Still, the data so far suggest that the targeted growth of close to 5 percent seems like a safe bet.
 Mark KrugerBased in Shanghai, Mark Kruger holds Senior Fellow appointments at the Yicai Research Institute, the Centre for International Governance Innovation and University of Alberta’s China Institute. Between 2020 and 2023, Mark was the Opinion Editor at Yicai Global. Previously, he had a 30-year career with the Bank of Canada in the course of which he served as a Senior Advisor to the Canadian Executive Director at the IMF and the head of the Economic and Financial Section of the Canadian Embassy in Beijing.


