 The Slowing US Economy: What Does it Mean for China?
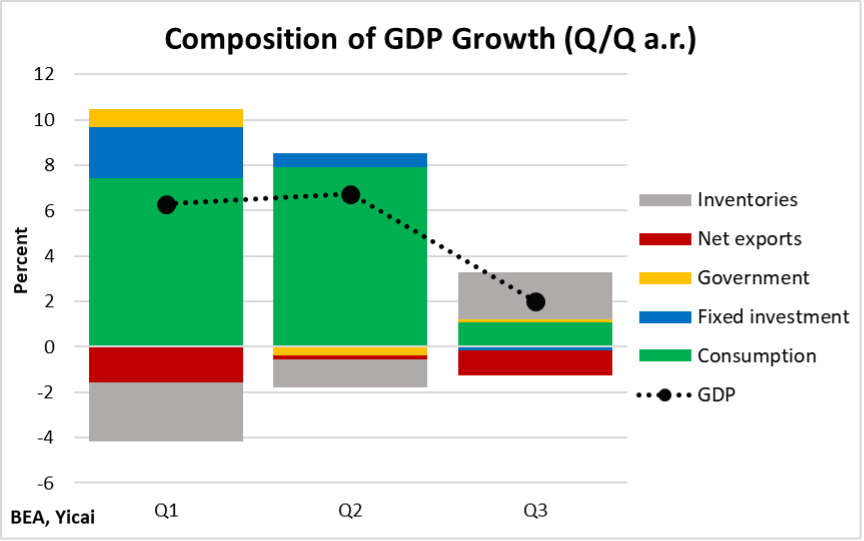
(Yicai Global) Nov. 5 -- On October 28, the US Bureau of Economic Analysis released the National Accounts for the Third Quarter. The data showed a dramatic slowing in economic activity. GDP growth dropped from over 6 percent (quarter-over-quarter at annual rates) in the first two quarters of the year to just 2 percent in the July-to-September period (Figure 1). The outturn was somewhat weaker than the 2.7 percent predicted by the economists . However, expectations for the quarter had been significantly ratcheted down since the summer. In July, the professional forecasters by the Philadelphia Fed were predicting 6.8 percent growth.
In fact, the underlying data were even weaker than the headline figure suggests, as most of the growth was due to inventory investment and inventory levels continued to fall, albeit at a much slower pace than in the previous quarter. The key takeaway here is that the fundamental demand drivers – consumption, investment, government expenditures and net exports – were anemic. Three factors contributed to the weakness in Q3: the resurgence of Covid-19, a decrease in government social benefit payments, and ongoing supply chain bottlenecks.
Figure 1
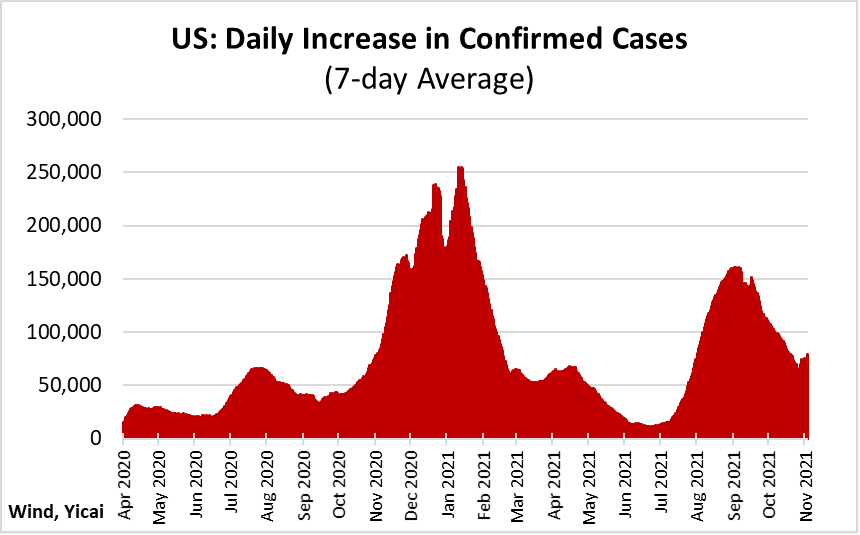
With the spread of the more contagious Delta Variant, there was a huge upsurge in Covid cases in the third quarter. Average daily new infections exceeded 100,000 cases, up from just over 36,000 in Q2 (Figure 2). While the infection rate in Q3 was still 20 percent below that of the first quarter, this wave of the pandemic reduced households’ willingness to consume – especially services – and to participate in the labour market.
Figure 2
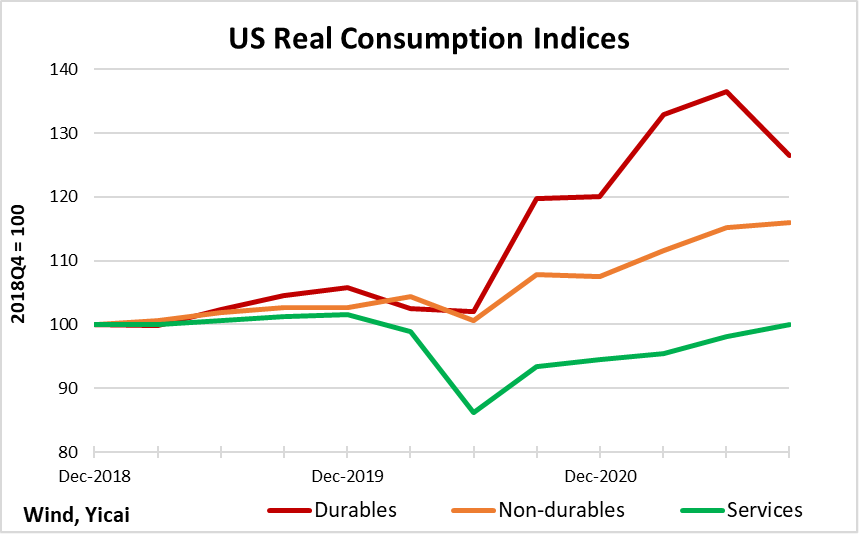
A drop in durable consumption led to the weakness of household expenditures in the quarter (Figure 3). Spending on durables had been very strong in recent quarters, in part, boosted by transfer payments under the government’s Covid response programme. Households’ appetite for durables had offset much of the weakness in service consumption. Government transfer payments fell in Q3 and households bought fewer durables. To a great extent, the weakness of consumption in the third quarter reflects just how strong it had been in the first half of the year.
Figure 3
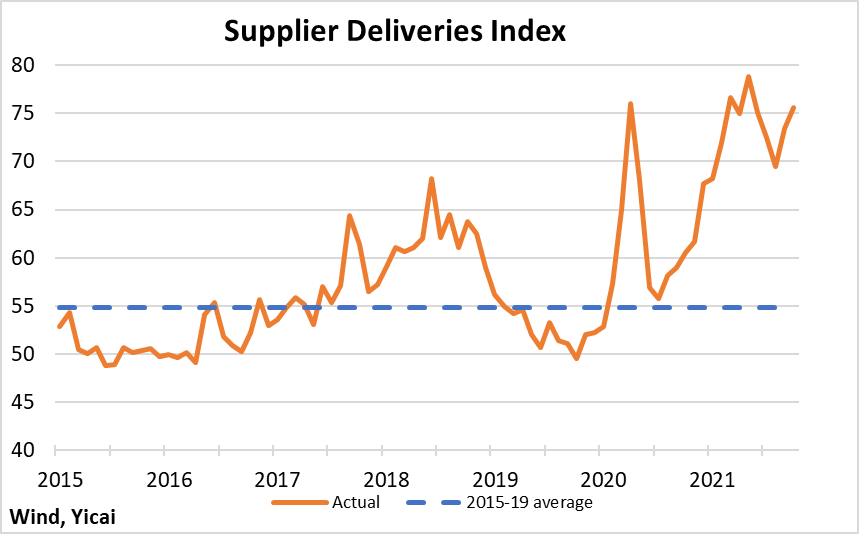
Supply chain bottlenecks remained pervasive. They are reflected in the elevated readings for the Supplier Delivery Index published by the Institute of Supply Management (Figure 4). This index measures the delivery performance of suppliers to manufacturers. A high reading indicates longer supply times. The Institute of Supply Management suppliers’ challenges in getting their products to manufacturers to the difficulty in hiring workers, the delays in sourcing raw materials, the shortages of material, the high prices of inputs and the inconsistent availability of transportation.
Figure 4
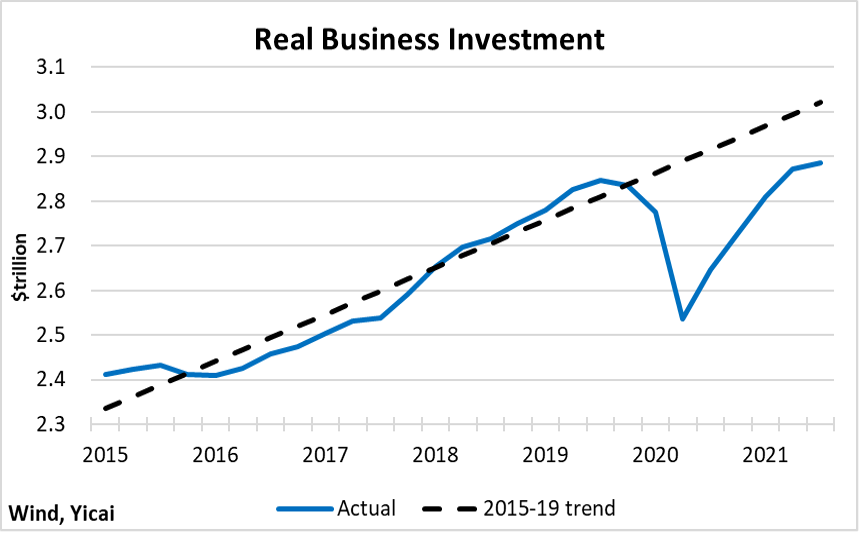
Along with uncertainty over the evolution of the virus and concerns about staffing, the supply bottlenecks are one of the key factors restraining investment spending. Indeed, investment has been a major casualty of the pandemic. It remains close to 5 percent below its 2015-19 trend (Figure 5). In comparison, consumption and GDP are less than 1 percent and 2 percent below trend respectively.
Figure 5
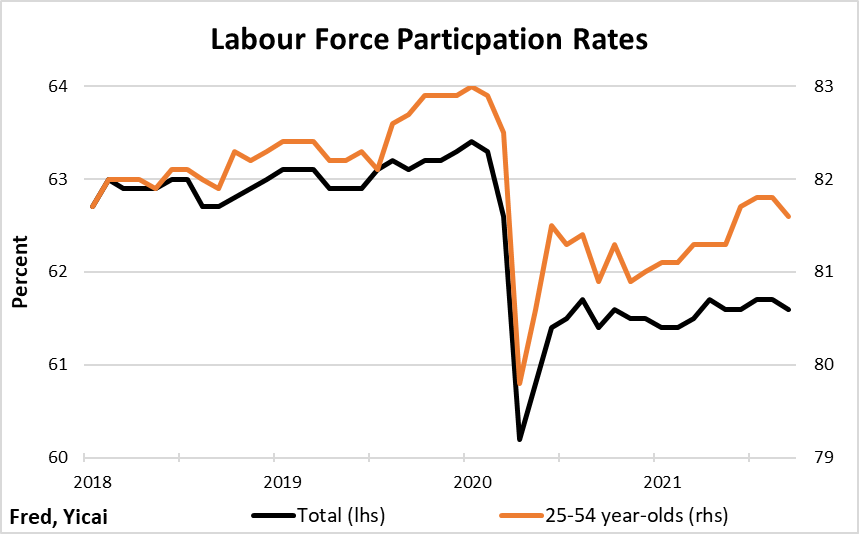
Like investment, employment is also about 5 percent below its pre-pandemic trend. Some labour market indicators suggest that the pandemic has had a long-lasting effect on people’s willingness to work. The labour force participation rates – both overall and of prime-age workers – fell sharply in April 2020 and, so far, show little sign of returning to their pre-pandemic levels (Figure 6). The slow rebound is not that unusual. The US Bureau of Labour Statistics the labor force participation rate never fully recovered to its pre-recession levels following the downturns in 2001 and 2007–09.
Figure 6
But this time, labour force participation may be especially slow to return to normal. There has been a sharp increase in the number of workers who have voluntarily quit their jobs since the beginning of the year. Termed the “”, the quit rate seems to be highest in those service industries with frequent people-to-people contact such as food services, retail sales and child care. The current drop in labour force participation has been especially sharp for women and workers without a bachelor’s degree. Given the risk of infection, these people prefer to perform unremunerated labour at home or are pursuing interests outside of the formal labour market.
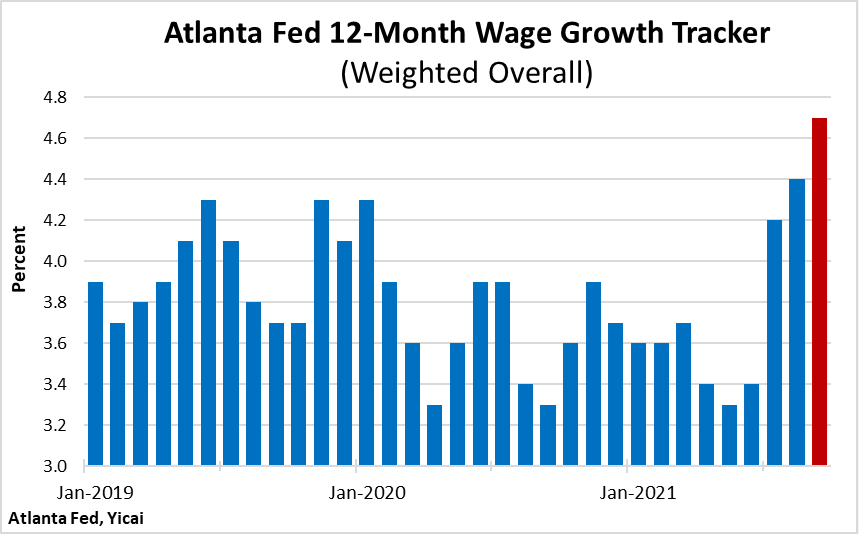
With workers in relatively short supply, it is no surprise that wages are rising rapidly. The Wage Growth Tracker published by the shows a 4.7 percent increase, year-over-year, in September. This is well in excess of what was recorded in late 2019 when the unemployment rate was at a multi-decade low and the labour market was considered to be extremely tight. Low labour force participation rates, in the face of a strong demand for workers and rapidly rising wages, suggest that the employment gap could be structural rather than cyclical. The US may need to significantly reduce the rate of Covid infections before employment returns to normal.
Figure 7
The sense that the labour market is close to its post-pandemic equilibrium was likely one of the factors that prompted the Federal Reserve’s November 3 that it would begin tightening monetary policy by winding down its bond purchasing programme. The Fed is committed to promoting “maximum employment” and it noted that it would leave the target for the Fed Funds interest rate at 0 to ¼ percent until maximum employment is achieved.
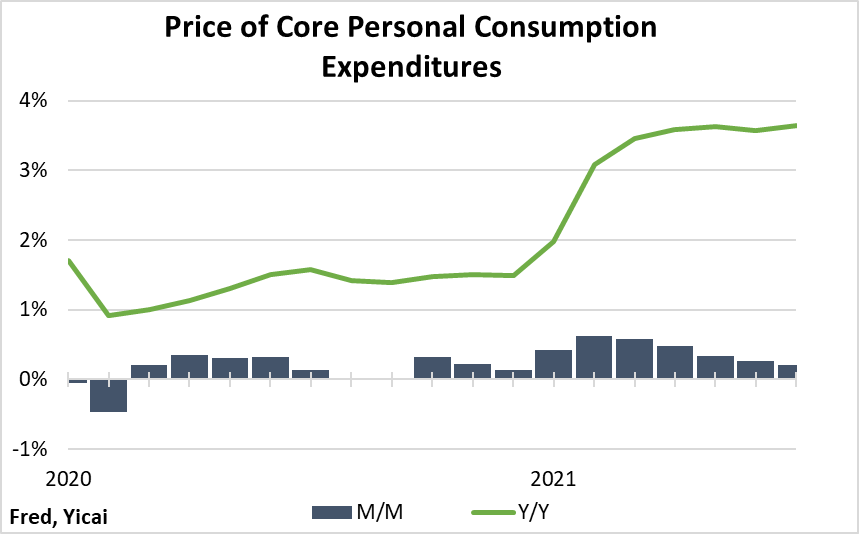
The Fed’s statement indicated that it is targeting inflation “moderately above 2 percent for some time”.
On a year-over-year basis, the price of core personal consumption items has risen by 3.6 percent for several months in a row (Figure 8). However, the month-over-month increases recorded in the third quarter were significantly smaller than those in Q2. This suggests that we could see a moderation toward 2 percent in the months to come.
Figure 8
What do the US’s Q3 results mean for China?
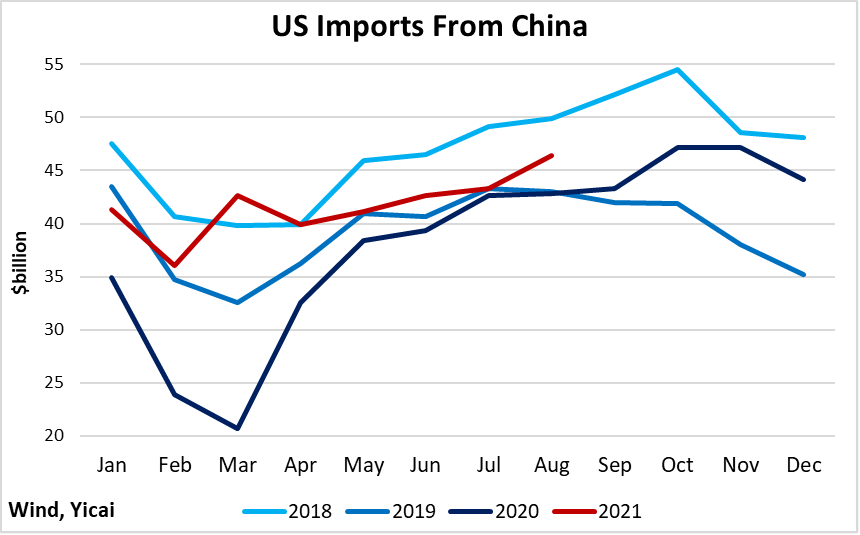
First, the US economy has become more dependent on goods imports this year. This is because the domestic economy has been unable to accommodate the shift in consumer demand from services to durable goods. China benefits from this trend. Year-to-date, the US’s goods imports from China are up 21 percent from 2020 and 6 percent from 2019 (Figure 9). They remain 7 percent lower than in 2018. The Trump Administration imposed tariffs on Chinese imports late that year.
Figure 9
Second, there are good reasons to believe the US economy will rebound in Q4 and that its demand for China’s products will remain robust. The Purchasing Managers Indices for both the manufacturing and non-manufacturing sectors were elevated in October indicating further growth. Strong wage increases bode well for consumption. And inventory levels remain very low, suggesting strong restocking demand. Forecasters expect Q4 growth to come in at close to 5 percent.
Third, the Fed’s tapering announcement is good for global capital markets. Interest rates need to normalize as the global economy recovers. Moreover, the Fed appears to be tightening monetary policy very gradually and its communication strategy seems clear. This reduces the risk of a market over-reaction.
Fourth, the Q3 data point to some medium-term concerns. The US’s large investment and labour market gaps are worrisome, as they imply a lower level of potential GDP. To offset this, US policymakers need to find ways to increase the economy’s efficiency. One way to do this is to negotiate a reciprocal tariff reduction with China. This would decrease the imposed on both countries.
While politics impinge on economic policy here, it is worth noting that the US is sensitive to the costs of the tariffs and is taking steps toward liberalization. On October 8, the US Trade Representative announced that it would to exempt the imports of certain products from its tariffs. Previously, 549 products had been exempted from the tariffs but these exemptions expired in 2020. Moreover, the Trade Act of 2021, which has been passed by the Senate but not by the House, would extend the tariff exemptions more broadly.
 Mark KrugerBased in Shanghai, Mark Kruger holds Senior Fellow appointments at the Yicai Research Institute, the Centre for International Governance Innovation and University of Alberta’s China Institute. Between 2020 and 2023, Mark was the Opinion Editor at Yicai Global. Previously, he had a 30-year career with the Bank of Canada in the course of which he served as a Senior Advisor to the Canadian Executive Director at the IMF and the head of the Economic and Financial Section of the Canadian Embassy in Beijing.


