 Where Does the Chinese Economy Go From Here?
(Yicai Global) July 23 -- Last week, China’s National Bureau of Statistics released the National Accounts for the second quarter of 2020. It reported that the Chinese economy grew by 3.2 percent year-over-year after having dropped by 6.8 percent in Q1. This was a modest upside surprise as the market was .
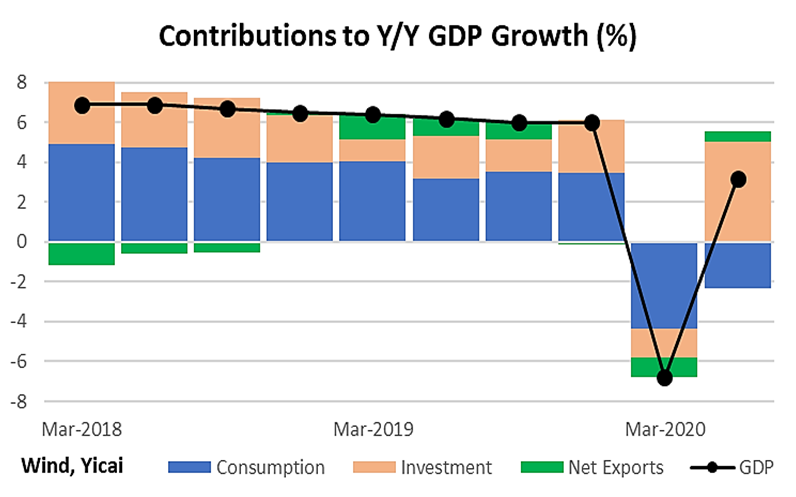
The graph below presents an add up of China’s GDP growth from the expenditure side. It shows that a sharp rebound in investment spending was the key factor behind GDP growth in Q2. Investment contributed 5 percentage points to GDP growth, while net exports added an additional half a percentage point. Consumption remained very weak, subtracting 2.4 percentage points.
Investment’s contribution in the quarter was huge: almost twice its average over 2015-19. Payback from a very weak 2020Q1 explains much of investment’s strength in the quarter. For the first half of 2020, investment contributed 1.5 percentage points even as GDP fell by 1.6 percent.
State-owned companies increased their investment spending sharply in Q2 by building infrastructure. Investment by private firms remained depressed, although new capacity was created in the manufacture of medicines and of computers and other electronic equipment.
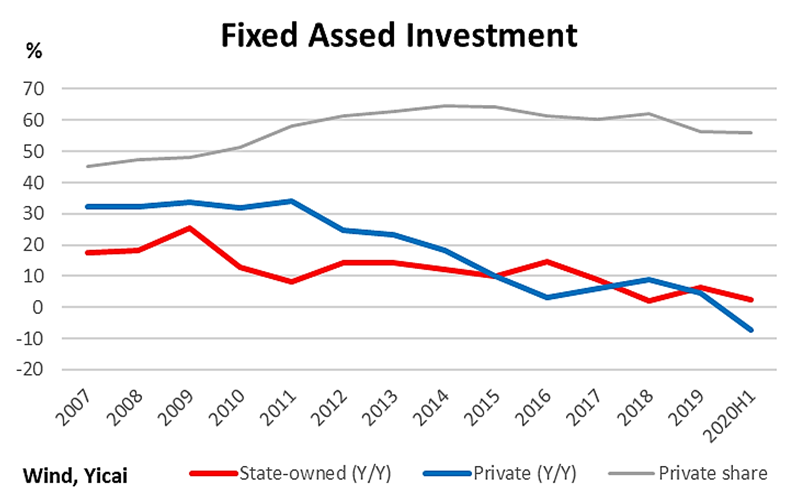
The relative strength of investment by state-owned firms will doubtlessly lead some commentators to see another wave of re-nationalization of the Chinese economy. This is, I think, misguided. The graph below shows fixed asset investment growth for both private and state-owned firms as well as private firms’ share of the annual investment undertaken.
The growth rate of state-owned firms’ investment tends to rise when the private sector is weak: the global financial crisis in 2009, the Euro crisis in 2012, the Chinese balance of payments pressures in 2016, the trade war in 2019 and Covid-19 in 2020.
While it is true that private firms’ share of fixed asset investment peaked at 65 percent in 2014, and has since fallen to 56 percent, the authorities have, in classical Keynesian fashion, used public investment to stabilize the economy in the face of shocks that have undermined investor confidence.
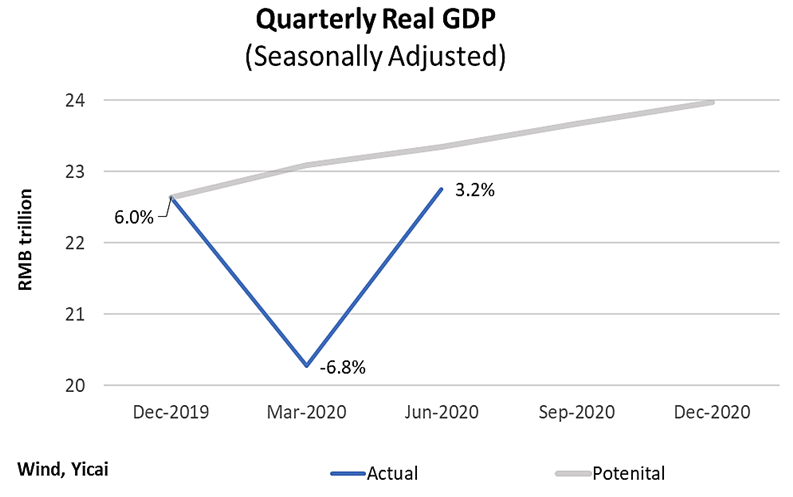
The recovery of the Chinese economy is underway but is its far from complete. The graph below shows that the level of seasonally adjusted real GDP hit a new record high in Q2 by exceeding 2019Q4 by half a percent. However, we estimate that there is excess lack in the economy equal to 2.5 percent of GDP. We calculate this as the difference between the actual level of GDP in Q2 and our estimate of potential – the grey line in the graph below. We believe that the economy was broadly in balance in the fourth quarter of 2019 and that it would have probably grown at 6 percent in 2020 in the absence of Covid-19.
Our estimate of an output gap of 2.5 percent of GDP is consistent with the observed increase in unemployment. In the second quarter, urban surveyed unemployment averaged 5.9 percent, 0.8 percentage points higher than in 2019Q4. The relationship between the rise in unemployment and the increase in the output gap is called the “Okun Coefficient”. In the US, the Okun Coefficient is estimated to be 2, which means that an 0.8 percentage point increase in unemployment would be consistent with an increase of the output gap by 1.6 percentage points. Here, we get an Okun Coefficient of 3.1 for China. An Okun Coefficient for China in excess of 3 is consistent with the and that show that the NBS’s unemployment survey tends to be relatively insensitive to economic conditions.
Notwithstanding a strong recovery in the second quarter, the Chinese economy faces headwinds. Foremost of these is the weakness in domestic consumption. In the first half of the year, real personal disposable income declined by 1.3 percent, but real personal expenditure dropped by 9.3 percent. This indicates that rather than drawing on their savings to smooth consumption, households responded to uncertainty by putting more money away. For the recovery to gain traction, Chinese consumers need to regain their confidence.
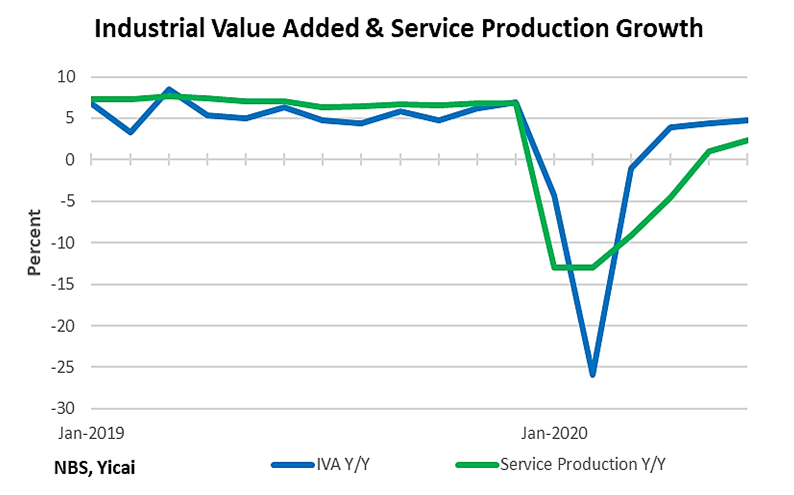
The second headwind the economy faces is an apparent loss of momentum. The graph below shows the near-term trends in industrial value-added and service production. After a sharp rebound in March and April, the growth of industrial value-added looks to be plateauing at about 5 percent, somewhat slower than the 5.7 percent recorded in 2019. Similarly, the momentum of service production slowed in June. Growth was only 2.3 percent, well below the 2019 average of 6.9 percent.
The final headwind is the course of Covid-19. While there are only scattered cases in China, the virus is still out of control globally. On July 20, the seven-day average of new cases was just over 230,000, up from 150,000 a month earlier. China does benefit from being the first country to recover and the most able to serve export markets, but this is more than offset by the virus’s crushing effects on external demand.
Thus, while China has established a basis for closing its output gap, the pace at which the economy will return to full health is not at all clear.
 Mark KrugerBased in Shanghai, Mark Kruger holds Senior Fellow appointments at the Yicai Research Institute, the Centre for International Governance Innovation and University of Alberta’s China Institute. Between 2020 and 2023, Mark was the Opinion Editor at Yicai Global. Previously, he had a 30-year career with the Bank of Canada in the course of which he served as a Senior Advisor to the Canadian Executive Director at the IMF and the head of the Economic and Financial Section of the Canadian Embassy in Beijing.


