 Chinese Carbon Satellite Delivers First Global CO2 Distribution Map
(Yicai Global) Feb. 5 -- The Institute of Atmospheric Physics of the Chinese Academy of Sciences released the first global carbon dioxide distribution diagram ever produced by a Chinese carbon satellite at the recent annual conference of the Group on Earth Observations, or GEO, a move that means the Chinese carbon satellite will supply data for research into climate change, the Academy reported on its website.
Major foreign research agencies such as the US National Aeronautics and Space Administration, Japan Aerospace Exploration Agency and European Space Agency have shown great interest in the diagram. The satellite was launched into orbit from the Jiuquan Satellite Launch Center on Dec. 22, 2016, as the world's third satellite with high-precision greenhouse gas detection capabilities. The first two carbon satellites of this kind, GOSAT and OCO-2, were developed by Japan and the US.
The Institute of Atmospheric Physics oversaw the development of the carbon dioxide concentration inversion algorithm, the carbon source assimilation system and satellite data applications, overcoming main challenges involved in remote sensing of atmospheric carbon dioxide, namely demanding precision requirements, a large number of distraction factors at work and a difficult inversion process.
Dr. Yang Dongxu, a core member of the research team at the institute, developed the inversion algorithm, known as Institute of Atmospheric Physics Carbon dioxide retrieval Algorithm for Satellite observation (IAPCAS), and a fast vector radiative transfer calculation method, which significantly improves computing efficiency and ensures a high level of precision at the same time. The team used the algorithm to analyze carbon dioxide monitoring data captured by the satellite and created the global CO2 distribution diagram.
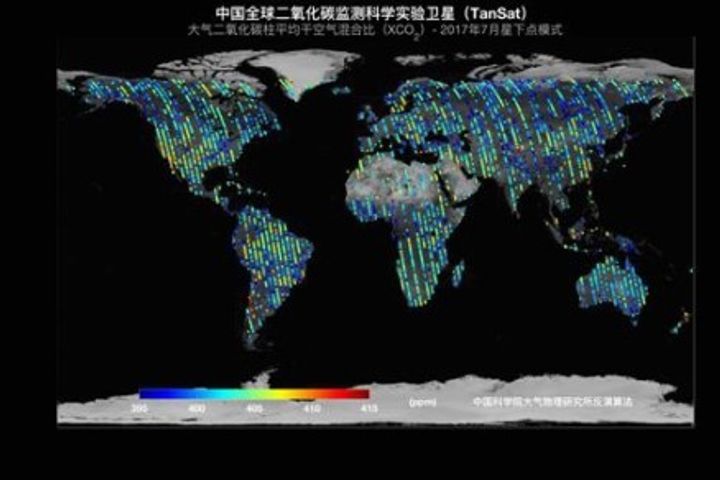
The diagram for April 2017 shows that the northern hemisphere has higher carbon dioxide levels than the southern hemisphere in spring in line with global patterns of manmade emissions. By comparing diagrams for April and July, the scientists found that the carbon dioxide level of the northern hemisphere decreased from spring to summer, indicating more carbons were absorbed by the ecosystem. The diagrams suggest that the regions with frequent human activity had higher carbon dioxide levels.


