 How Worrisome is China’s Rising Leverage?
With China emerging from three years of Covid-induced economic slowdown, it is time to take another look at how indebted it has become.
As at the end of last year, China’s macro leverage ratio reached 273 percent of GDP, up by 27 percentage points from the end of 2019 (Figure 1).
About 60 percent of China’s overall debt is classified as having been incurred by the non-financial corporate sector. This would include borrowings by both state-owned and private firms. Household debt accounted for just under a quarter of the total and public sector debt – the borrowings of central and local governments – making up just under 20 percent.
Figure 1
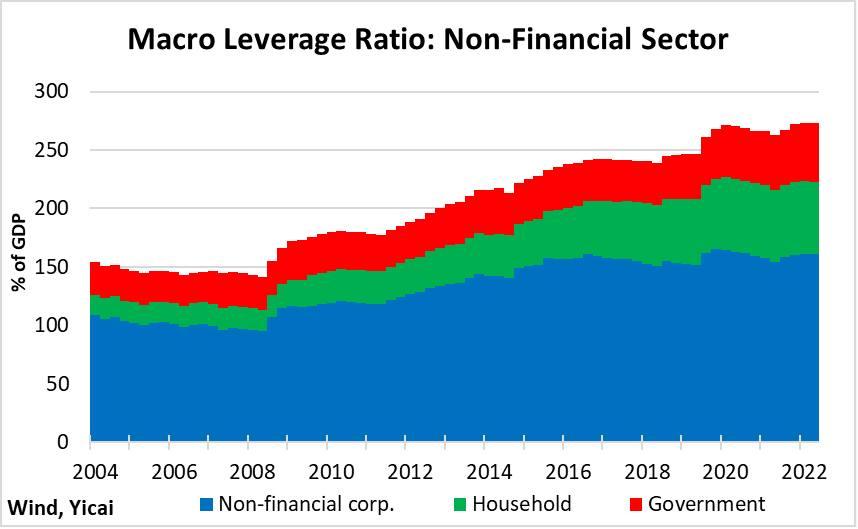
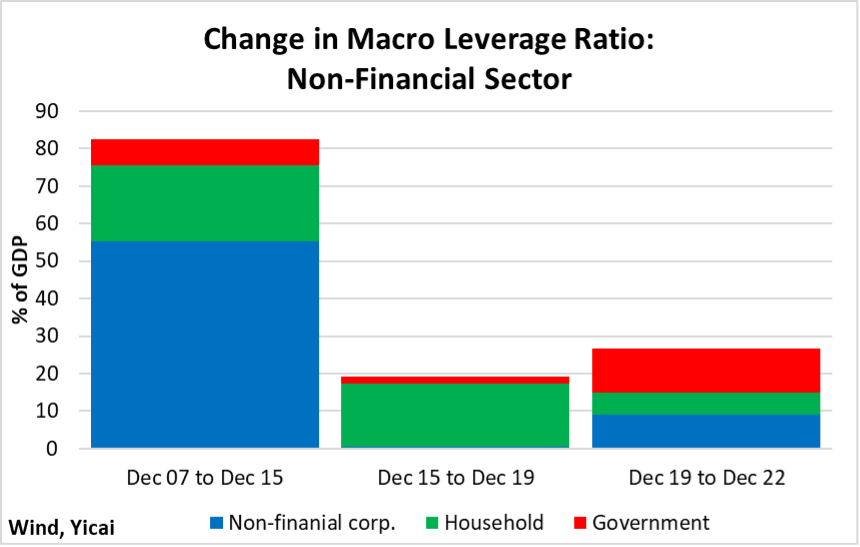
China’s macro leverage ratio stood at 145 percent of GDP before the outbreak of the Global Financial Crisis in 2008. Since then, it has evolved in three distinct phases (Figure 2).
Between December 2007 and December 2015, it rose by more than 80 percent of GDP. About two-thirds of this debt was accumulated by non-financial corporations. Initially, most of these liabilities were incurred as part of the government’s CNY 4 trillion spending plan, which was designed to counter the depressive effects of the financial crisis. In subsequent years, financial innovation offered a wider variety of firms access to credit, as China’s shadow banking system grew in importance.
As the economy recovered from the crisis, policymakers increasingly focused on the financial risks posed by growing leverage. By 2017, addressing these financial stability risks became a key priority — one of the “”— along with alleviating poverty and tackling pollution.
During this second phase, between December 2015 and December 2019, the debt of the non-financial corporate sector was essentially unchanged as a percent of GDP. Households accounted for almost all the increase in indebtedness. Most of this was in the form of new mortgages.
The third phase of indebtedness began with efforts to extricate the economy from the slowdown caused by the pandemic. In just the first six months of 2020, the macro leverage ratio increased by 22 percent of GDP, or more than it had over the previous four years!
The government accounted for about half the increase in indebtedness during this phase. Between 2007 and 2022, the leverage of the government sector rose by 20 percentage points of GDP, more than half of which occurred since the outbreak of the pandemic.
Figure 2
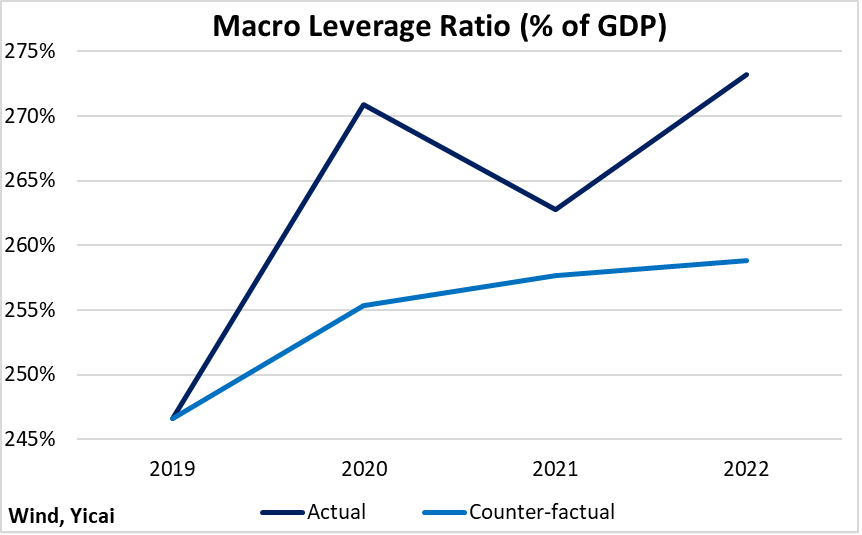
The leverage ratio is aggregate debt divided by nominal GDP. So, some of the rise in indebtedness during the third phase was caused by the pandemic-related slowdown in GDP growth.
To assess the contribution that slow growth made to increasing China’s indebtedness, I construct a counterfactual in which nominal GDP grows by 8.5 percent per year (5.5 percent real growth and a 3 percent annual increase in the price level) instead of the 7 percent actually recorded.
With the actual level of debt kept constant in the counterfactual scenario, I calculate that the debt ratio would have increased by 16 percent of GDP rather than the 27 percent of GDP that occurred (Figure 3).
Figure 3
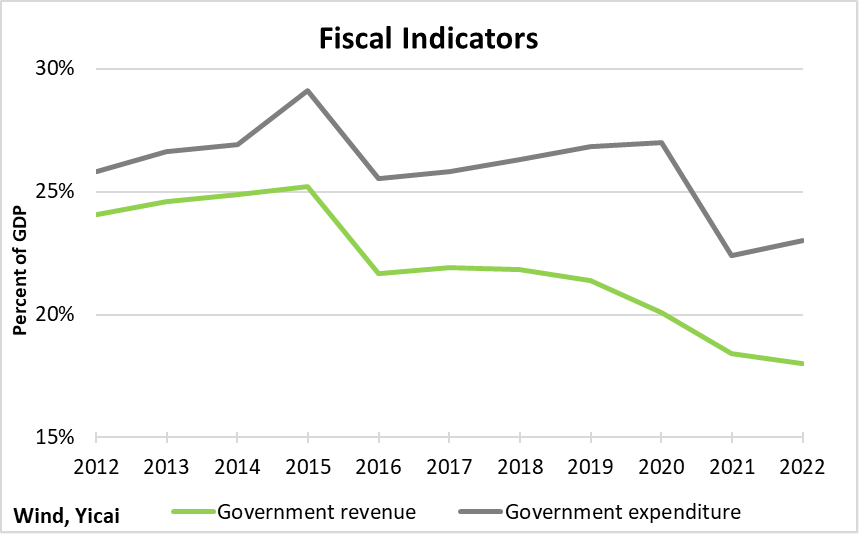
While borrowing by governments accounted for much of the increase in indebtedness in the third phase, it was not the case that on-the-books fiscal spending increased sharply. Indeed, government expenditures, as a percent of GDP in 2021 and 2022 fell below pre-pandemic levels. However, government revenue fell by even more (Figure 4).
Figure 4
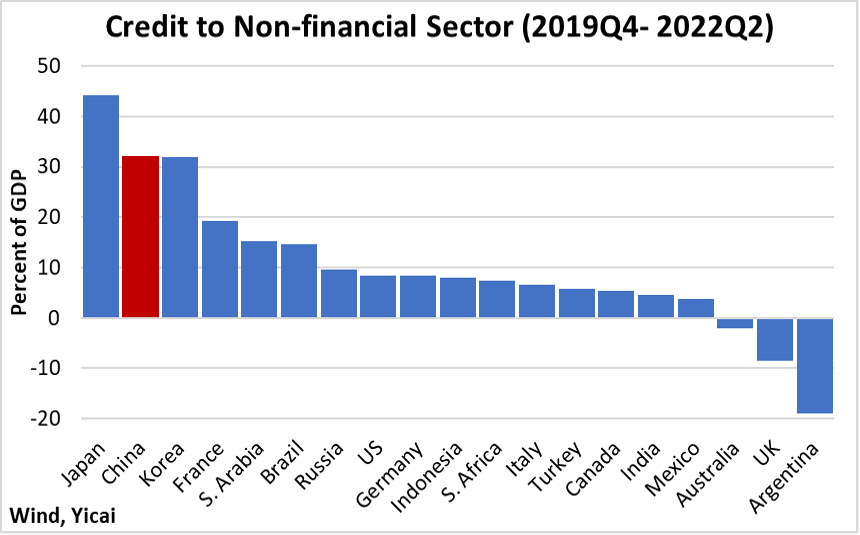
China was far from the only country that became more indebted during the pandemic. The data on credit to the non-financial sector by the Bank for International Settlements (BIS) show that leverage increased in sixteen of the nineteen G20 countries (Figure 5). However, China’s increase – 32 percent of GDP – was comparatively large.
Figure 5
According to the BIS’s data, China’s leverage ratio is high but, by no means, off of the charts. It is the fourth highest among the G20 countries ahead of Korea, and behind Canada (Figure 6).
Figure 6
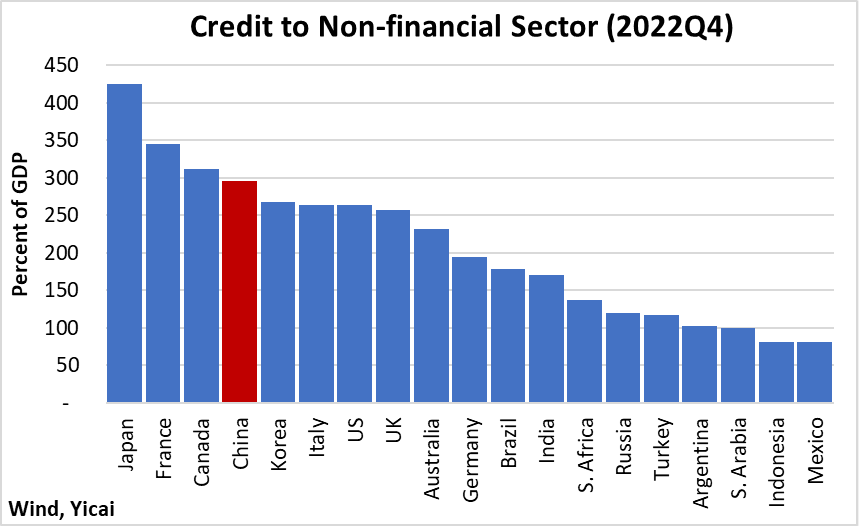
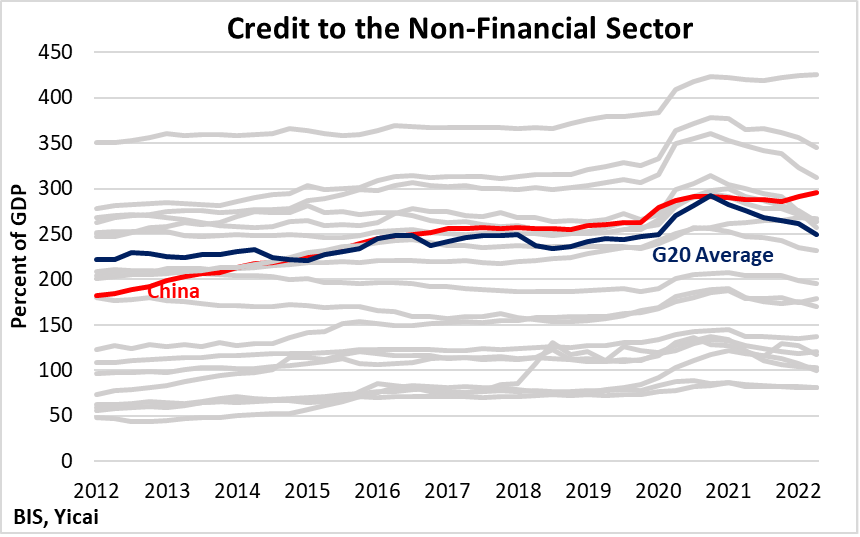
Figure 7 shows that while leverage has increased across the G20 countries over the last decade, the rise in China’s leverage has been relatively rapid. In fact, in 2012, its leverage ratio was only the 10th highest in this group of major economies.
Figure 7
The size of a country’s debt (relative to GDP) and the pace of its increase are key factors in assessing sustainability. Equally important is the quality of the debt – the ability of the debtor to make principal and interest payments. In this context, that indicate the aggregate debt of China’s local government financing vehicles (LGFVs) has reached CNY 65 trillion are disconcerting.
Local governments in China have been constrained in their ability to borrow and they set up LGFVs to finance infrastructure projects. The projects – like roads and bridges – can be useful but since tolls are rarely charged to users, they have limited ability to generate revenue for debt service. Instead of a careful analysis of balance sheets and income statements, LGFVs’ creditors often rely on an implicit guarantee that the local authorities will backstop these liabilities.
The reported CNY 65 trillion is a huge sum. It is equivalent to a third of China’s corporate debt and half of its GDP.
With the economic slowdown, some LGFVs have had to engage in high-profile debt restructurings. In January, Zunyi Road and Bridge Construction Group, the biggest LGFV in Guizhou Province, was able to get 21 banks to agree to a 20-year maturity for CNY 15.6 billion in loans. Zunyi will only pay interest for the first ten years.
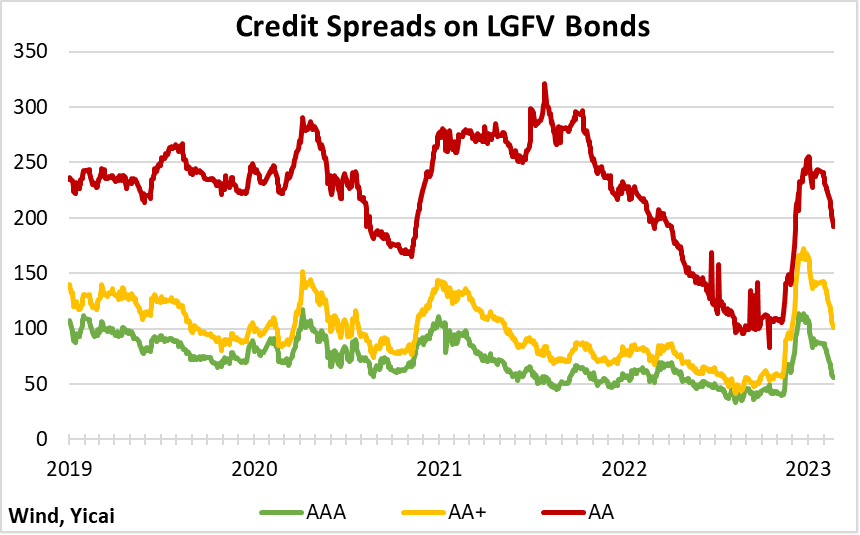
Zunyi’s restructuring sent shivers through the LGFV bond market and the spreads on LGFV debt, relative to government bonds, spiked (Figure 8). Subsequently, the spreads have returned to pre-pandemic levels but it is not clear if this reflects an assessment of improved creditworthiness as the economy reopens or the persistence of the implicit government guarantees.
Figure 8
The authorities are aware of the risk of LGFV debt and they have taken several to contain its growth. In 2013, CNY 14 trillion in LGFV debt was added to local governments’ balance sheets as part of a debt swap. In 2018, local governments were prevented from explicitly guaranteeing LGFV debt. In 2021, administrative and prudential measures were introduced to limit the most indebted LGFVs from further borrowing.
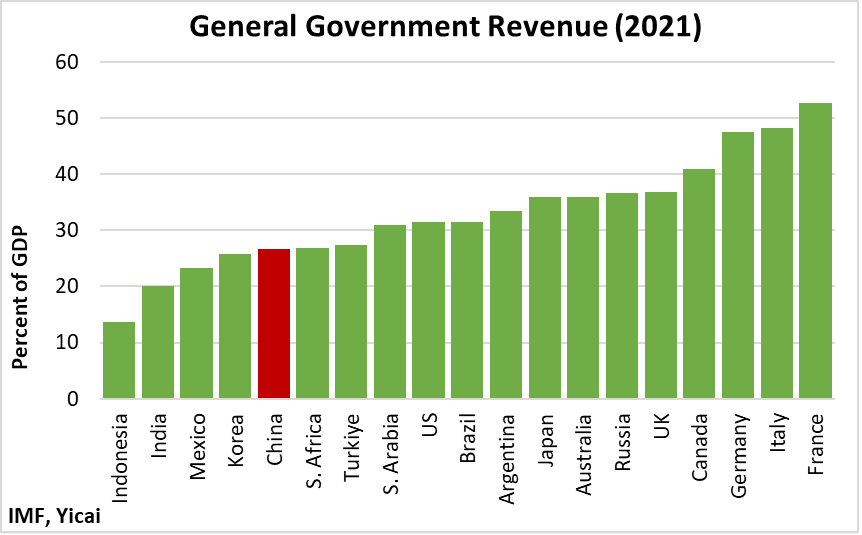
Since LGFVs are constrained in their ability to generate revenue from their infrastructure projects, the sustainability of their debt will ultimately depend on fiscal transfers from local governments. In comparison to the other G20 countries, China’s government revenue to GDP ratio is rather low (Figure 9). This points to the scope for revenue-enhancing tax reform.
In its recent report, the IMF offers suggestions for changes to the fiscal system that could enhance the sustainability of local government finances. These include reducing basic personal income tax allowances and providing credits to low-income wage earners; broadening the income tax base by removing deductions; greater central government transfers to local authorities; and introducing a recurrent property tax.
Figure 9
Increasing government debt to mitigate the effects of a slowdown in economic activity is orthodox Keynesian counter-cyclical policy. Now that the worst of the pandemic is behind us, I expect that policymakers will, once again, turn their attention to the “tough battle” of reducing financial risks and make the increase in China’s leverage less worrisome.


