 Property and Exports Weighed on the Economy in 2023
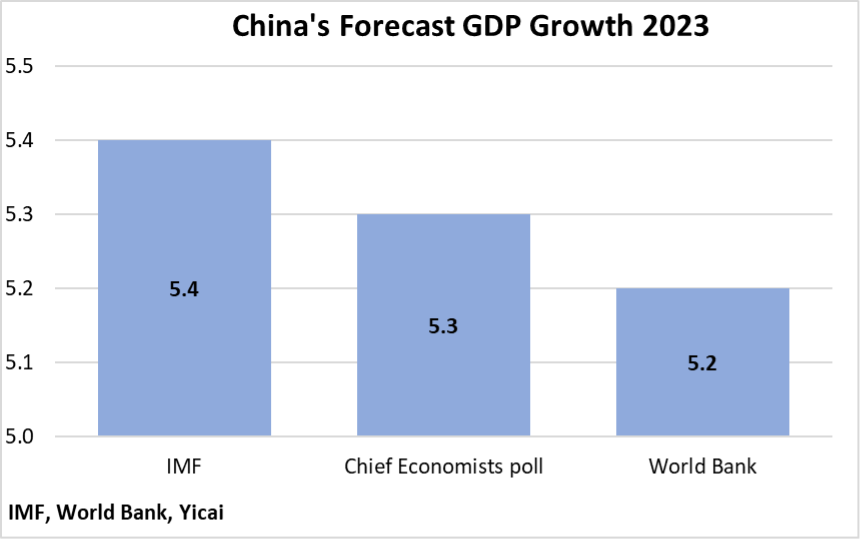
(Yicai) Jan. 18 -- The National Accounts just by the National Bureau of Statistics (NBS) were largely as expected. GDP came in at 5.2 percent year-over-year both for the fourth quarter and for the year as a whole. The outturn was in line with the forecasts of the Chief Economists polled by the , the and the (Figure 1).
Figure 1
To understand why 2023’s growth was considered a below-par result for China, we have to look through the economy’s extreme volatility during the pandemic period.
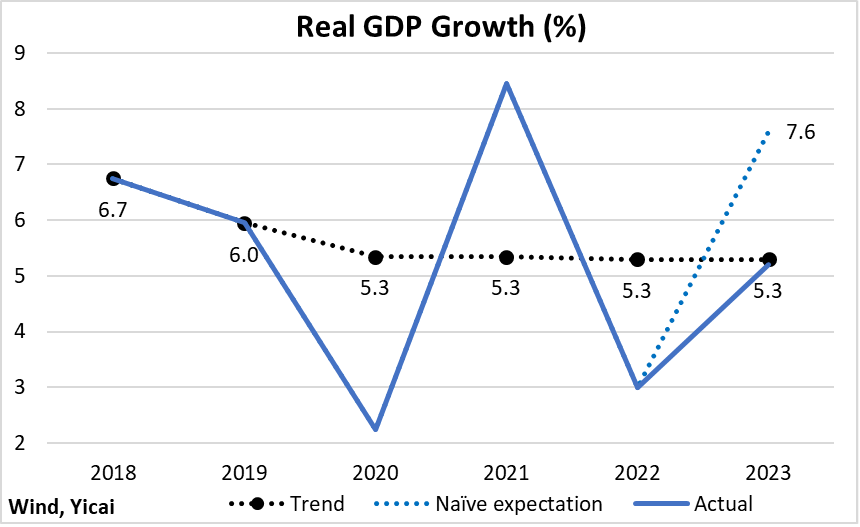
Figure 2 presents the annual growth of GDP between 2018 and 2023 (the blue line), the trend in GDP growth (the black dotted line) and a naïve expectation for what growth might have been last year (the blue dotted line).
The true trend growth of the economy is often only visible well after the fact. Still, looking back we see that the average of 2020’s growth (2.2 percent) and 2021’s (8.4 percent) was 5.3 percent, which is in line with the PBOC’s of China’s potential.
In 2022, the economy only increased by 3 percent. That means that it would have had to grow by 7.6 percent last year for the two-year average to remain at 5.3 percent and for the economy to return to its potential output.
Figure 2
Of course, this sort of analysis only really works in an artificial environment devoid of economic shocks. Last year, however, China’s economy was subject to two major shocks: a decline in net exports and a downturn in the property market.
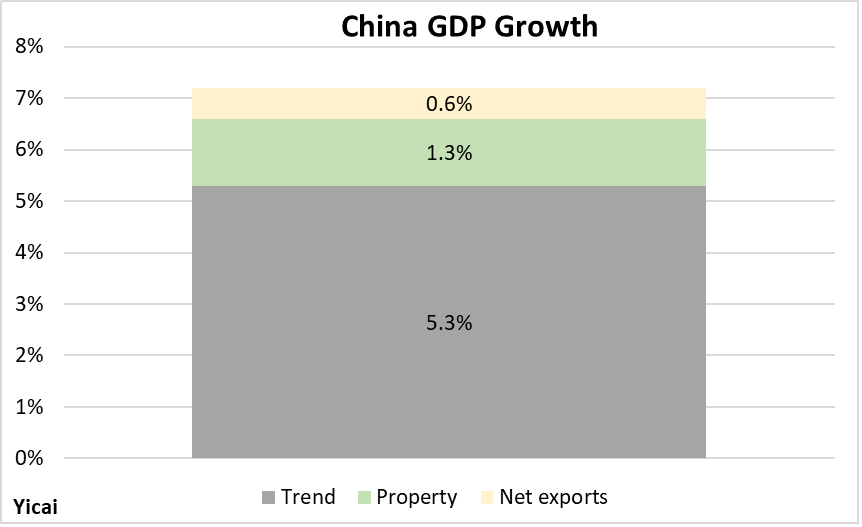
The NBS estimates that the decline in net exports took 0.6 percentage points off of growth in 2023. Using the trend in floorspace under construction, I estimate that the property market weakness cost the economy an additional 1.3 percentage points.
Putting the pieces back together, we start with trend growth at 5.3 percent and add in the two shocks and we get growth for 2023 of 7.2 percent, which is pretty close to our naïve expectation (Figure 3).
Our view of how rapidly the economy might grow this year depends, to a large extent, on how these two shocks evolve.
Figure 3
China’s export growth slowed in dollar terms – from 5.6 percent in 2022 to -4.6 percent last year – for three reasons.
First, tight monetary policy in China’s major trading partners is restraining aggregate demand and the need to import goods from abroad.
Second, the tariffs imposed by the US have made China’s exports more expensive. As a result, China is losing market share.
Third, during the pandemic, China’s exports were “pulled forward”. Since Covid affected China’s supply chains less acutely than those of other countries, Chinese exporters were able to fill the global supply shortfall. In 2023, production in China’s trading partners came back on stream and some of China’s export surge was reversed.
Figure 4 illustrates the short-term evolution of 12-month average imports in terms of indices with January 2022 indexed to 100. Global imports peaked in November 2022 and fell by 5 percent through September 2023. October-November data from the US and the EU indicate a stabilization as the year drew to an end. With interest rates in major economies peaking, it is reasonable to expect a modest pick-up in import demand this year.
Figure 4
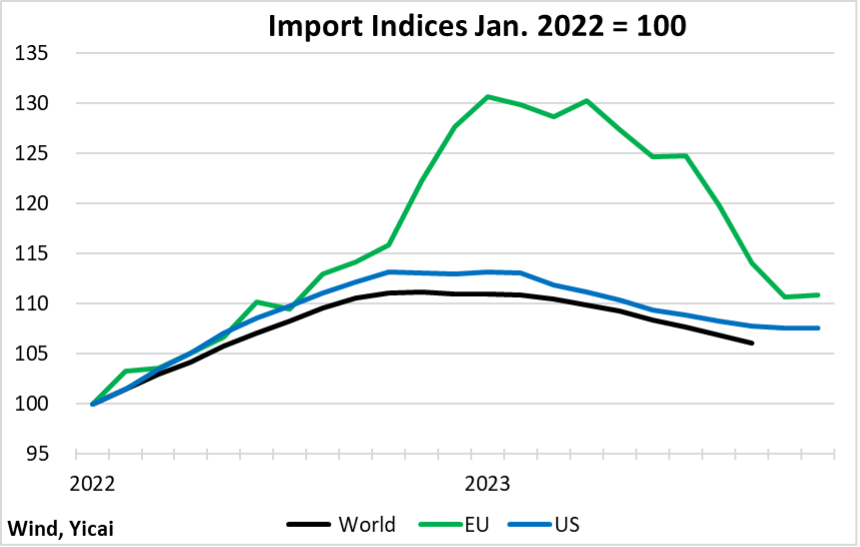
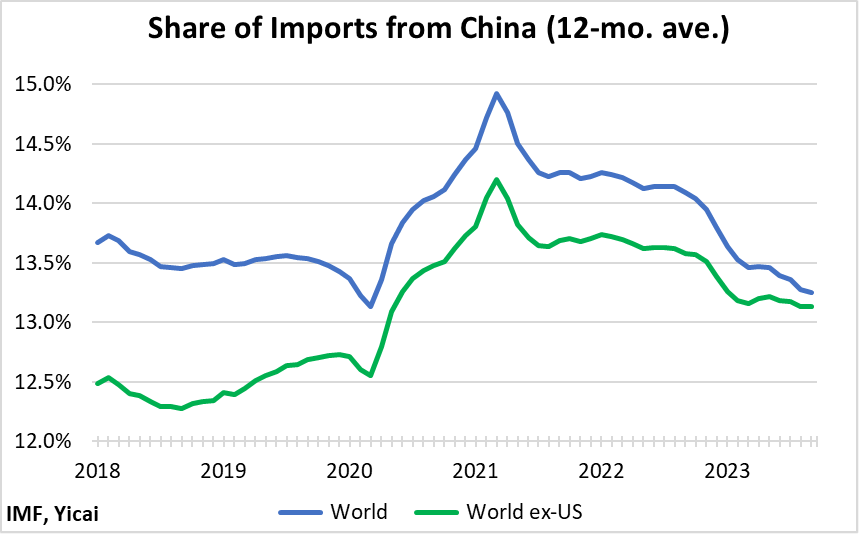
Figure 5 shows China’s share of the world’s imports (the blue line) and of the world excluding the US’s (the green line). The effect of the US tariffs can be seen in the way the two lines are converging. Both lines illustrate the pullback of China’s import share after a dramatic run-up during the pandemic period. The green line shows that this pullback has now stabilized in the world-excluding-the-US. The blue line shows that the effect of the tariffs increases over time as US importers are more able to source non-Chinese supplies.
Figure 5
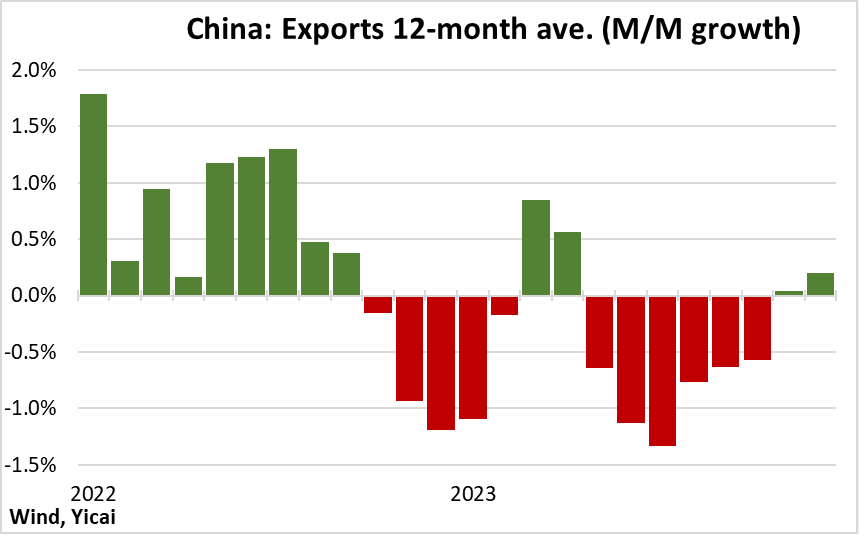
The ability of China’s exports to grow this year will depend on the extent to which increased demand can offset market share losses. The near-term trend gives us reasons to be optimistic. Figure 6 presents the month-over-month percent change in China’s 12-month average exports. After large declines in May through October, exports grew modestly in November and December. This provides a good starting point for 2024.
Figure 6
There are some preliminary indications that the real estate market could be bottoming out.
The growth rate of newly started homes is becoming less negative. In early 2023, the growth rate of starts was in the -30 percent range. By December, the fall had narrowed to -10 percent. The question is whether the positive trend in starts be maintained when sales of new homes continue to fall by 25 percent year-over-year (Figure 7).
Figure 7
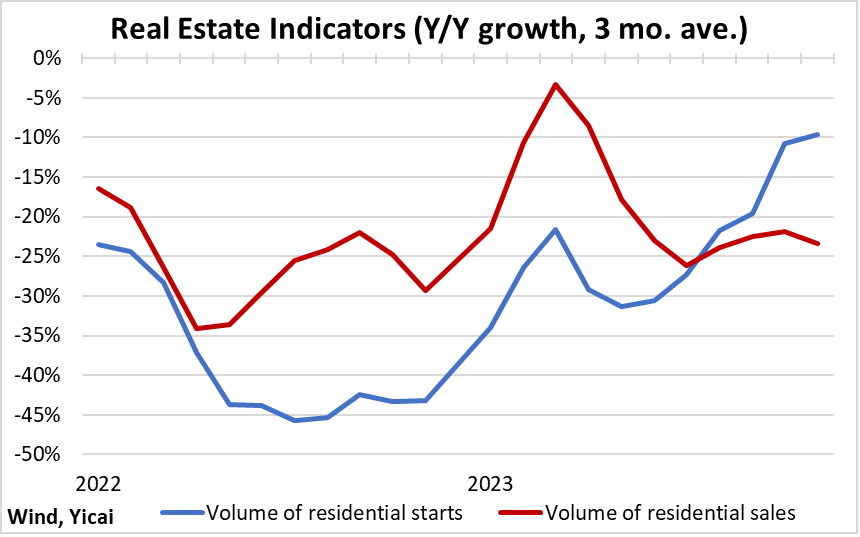
In the near term, perhaps the growth in starts (and housing activity) can buck the decline in sales.
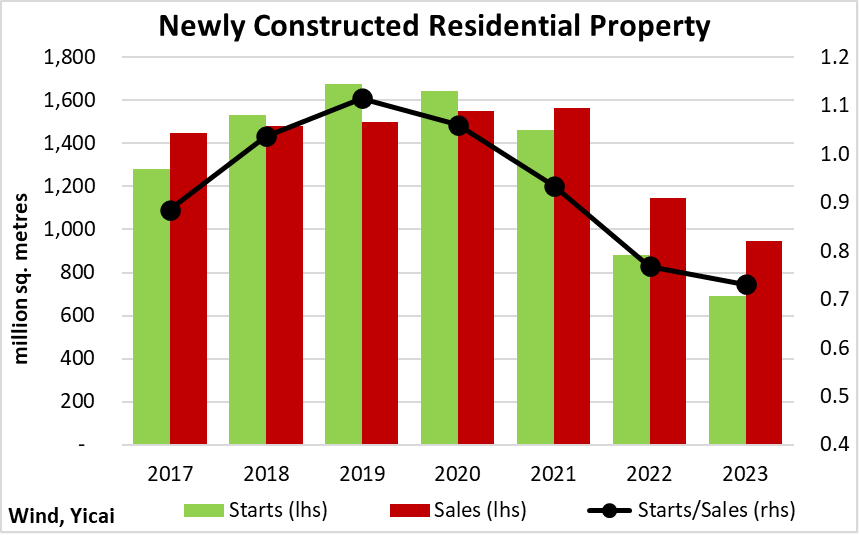
In 2022 and 2023, the fall in starts was much sharper than that of sales. On average, between 2017 and 2021, the starts-to-sales ratio was about 1 (Figure 8). In 2022-23, the ratio fell to 0.75. This means that although sales were weak, they could have supported a level of starts one-third higher. Next year, at least, we could see a rebound in starts, despite weak sales, to re-establish the equilibrium between the two.
Figure 8
There are two other developments that can support the economy this year.
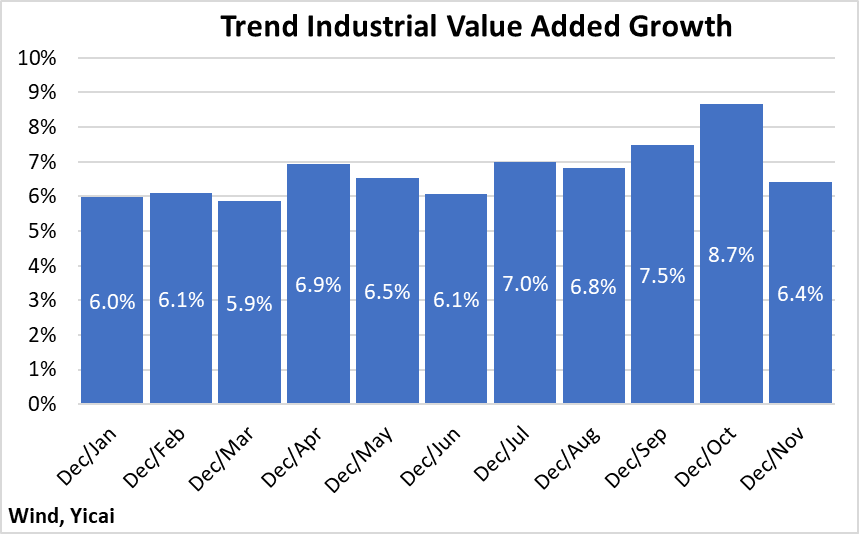
First, the near-term trend in industrial value added suggests that production could be stronger than it looks on an annual basis.
For the year as a whole, industrial value added grew by 4.6 percent, significantly slower than the 2017-19 average of 6.2 percent. Much of the weakness came early in the year. The near-term trends in industrial value added point to growth in excess of 6.2 percent in the second half of 2023 (Figure 9).
Figure 9
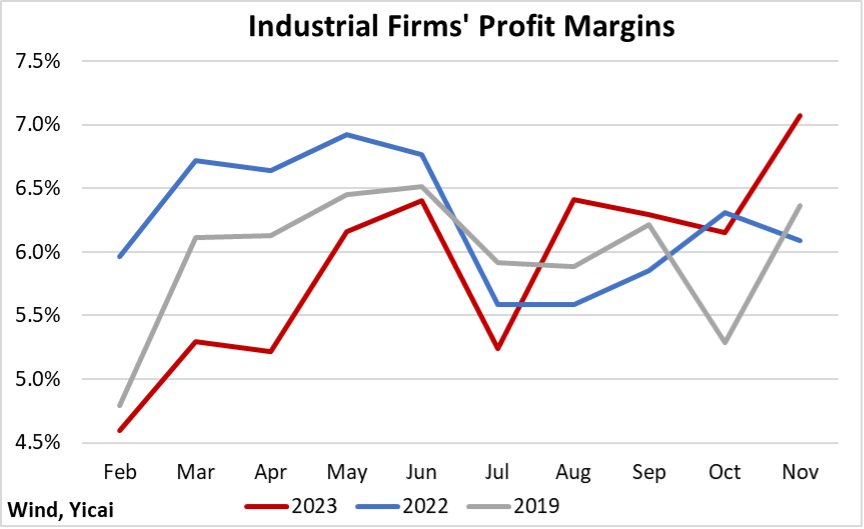
The turnaround in industrial value added is due to an improvement in profit margins, which are an important determinant of output growth. At the beginning of the year, profit margins were well below those of 2022 and 2019 (Figure 10). By August, that ordering had largely reversed.
Figure 10
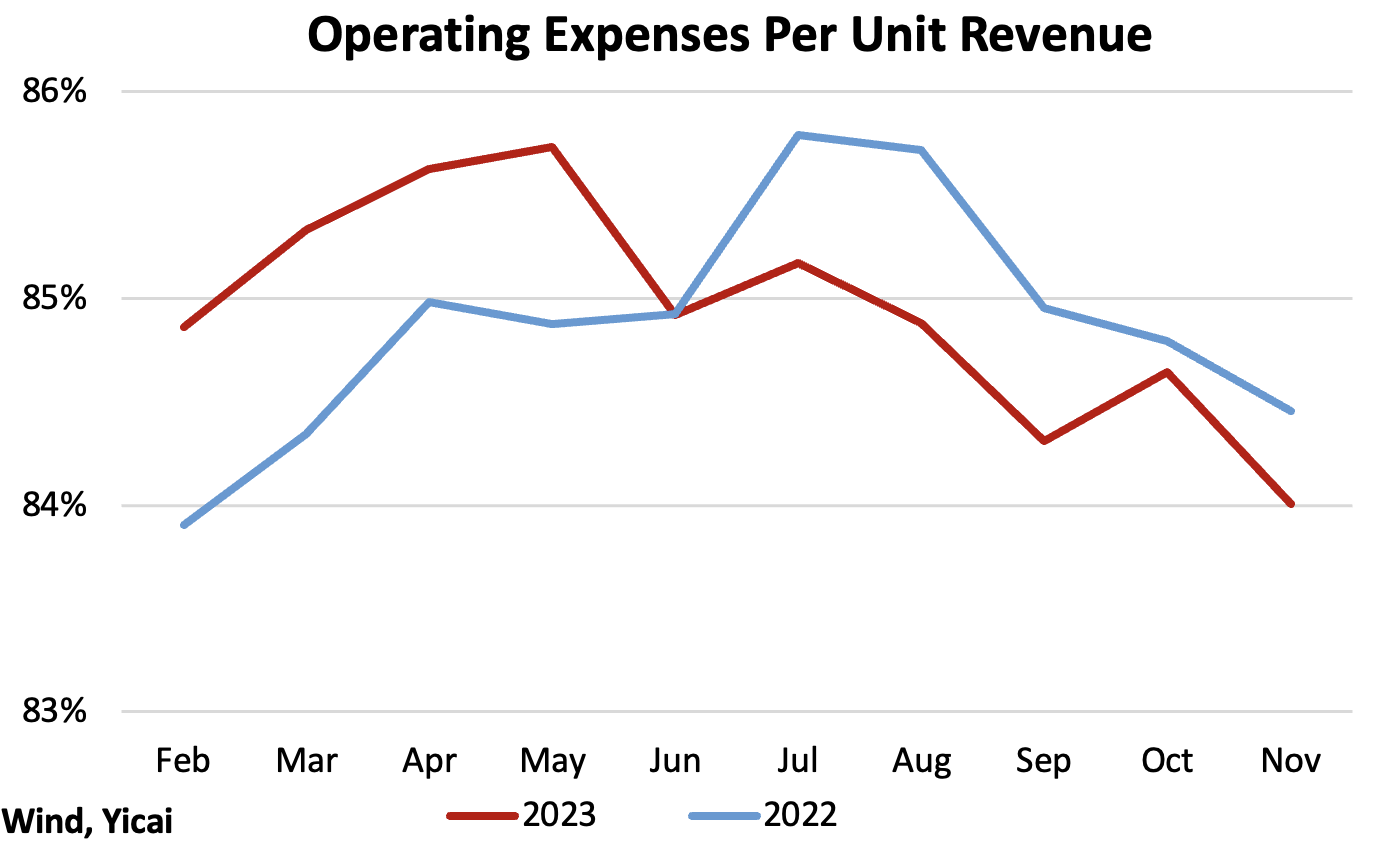
The improvement in margins came from firms’ efforts to cut costs. In the first half of the year, operating costs per unit revenue were higher than in 2022. Since July, they have been lower (Figure 11). To the extent that firms’ cost-cutting exercise has increased their efficiency, they enter 2024 well prepared.
Figure 11
The second supporting factor is that while consumption has largely rebounded, there is still some pent-up demand.
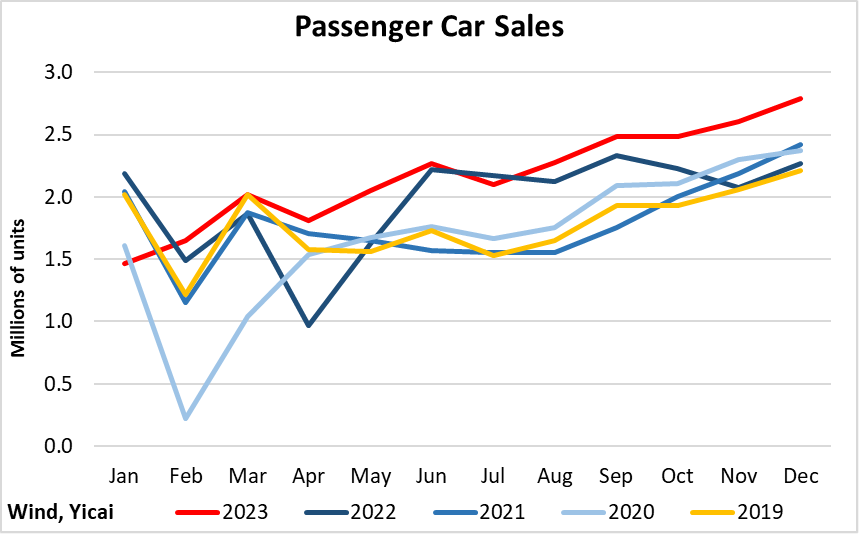
An example of the strength in consumer demand comes from passenger car sales. In the fourth quarter, they were 21 percent higher than the 2019-22 average (Figure 12). An automobile is a big-ticket durable and robust car sales are likely a sign of consumer confidence.
Figure 12
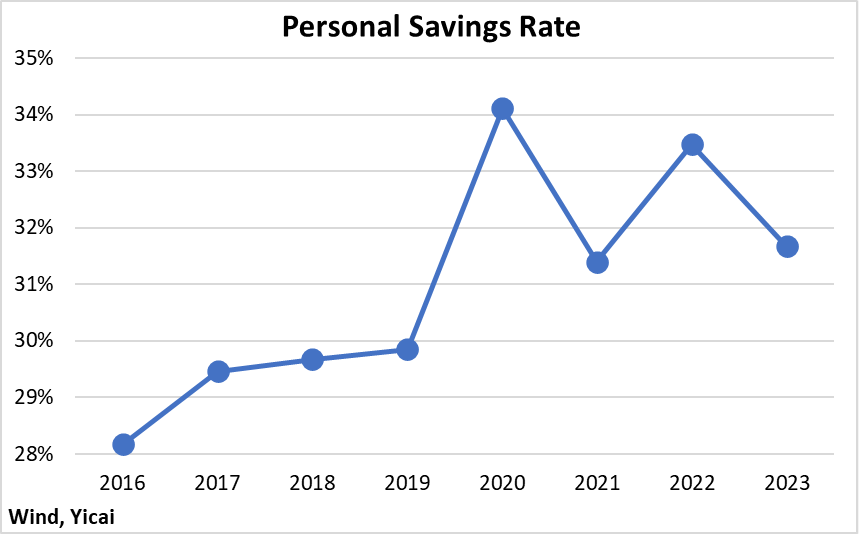
Sales of items related to new home purchases, such as appliances, furniture and home decoration, remain tepid. Thus, the weakness in the property market helps explain why the personal savings rate remains elevated albeit down from the pandemic peak in 2020 (Figure 13).
While high savings cut into consumption last year, they represent significant “dry powder” that can fuel consumer expenditures in the months to come.
Figure 13
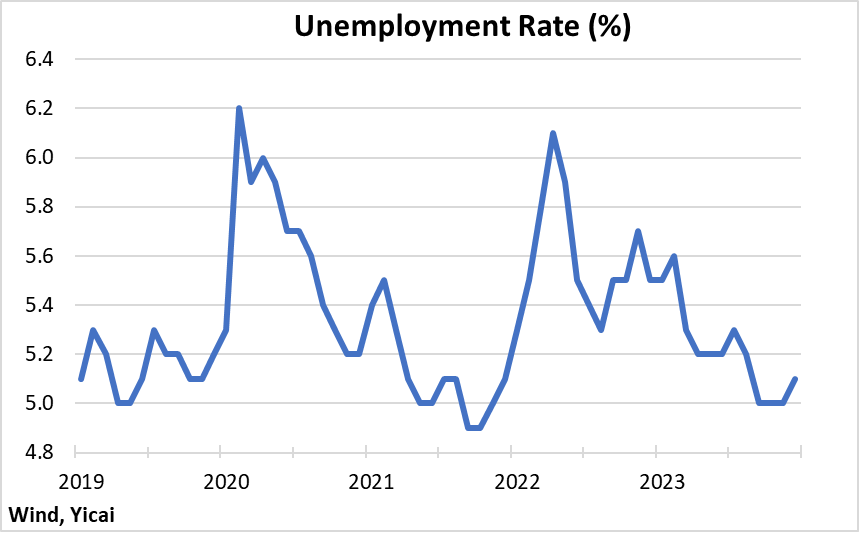
Despite below-trend GDP growth, the labour market remains buoyant. The unemployment rate is at pre-pandemic levels (Figure 14).
Figure 14
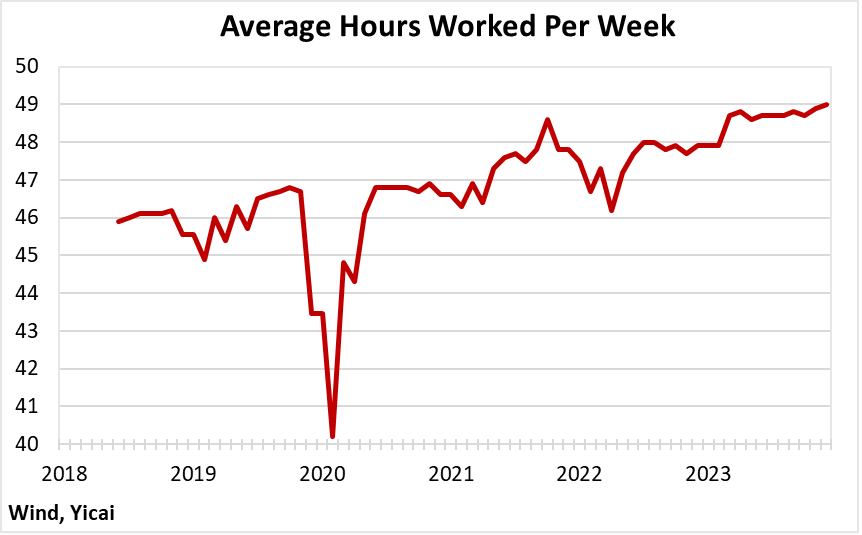
Moreover, the demand for labour remains strong. In December, the average worker put in 49 hours per week, up 3 hours from mid-2018 (Figure 15).
Figure 15
As long as labour conditions remain robust, I expect policy to prioritize financial stability over macroeconomic support. I believe that policymakers are rightly concerned about the run-up in economy-wide indebtedness in recent years.
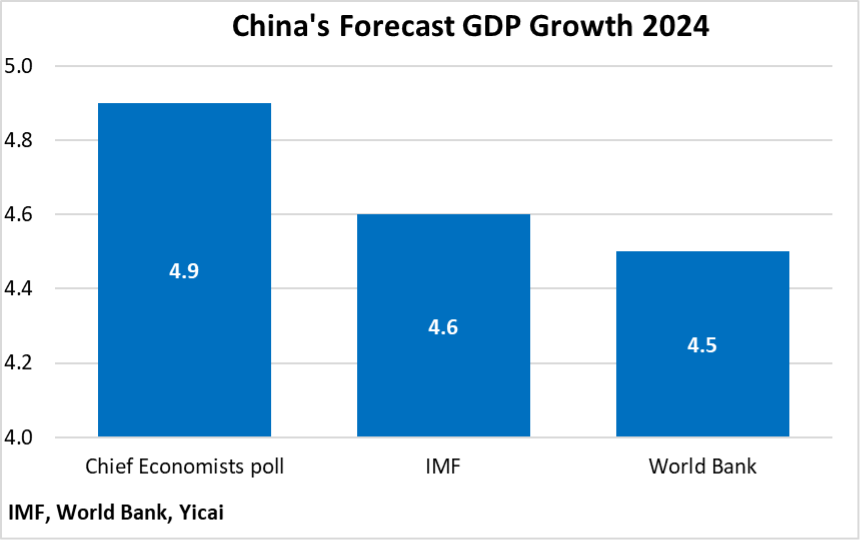
Before the National Accounts were released, expectations were for China to grow between 4.5 and 4.9 percent this year (Figure 16). I am, naturally, more optimistic and believe growth could reach 5 percent as residual property market weakness takes 0.3 percentage points off of potential growth of 5.3 percent.
All of these forecasts for China’s GDP imply much slower growth than before the pandemic. However, even at these rates – with the US set to grow at 1.5 percent and the Euro Area at 1.0 percent – China’s increasing gravity will continue to exert an ever-stronger pull on global economic activity.
Figure 16