 What Explains the Slowdown in China’s Industrial Activity?
(Yicai Global) July 17 -- China’s recovery has been slower than expected and economy-watchers are waiting impatiently for the government to announce additional .
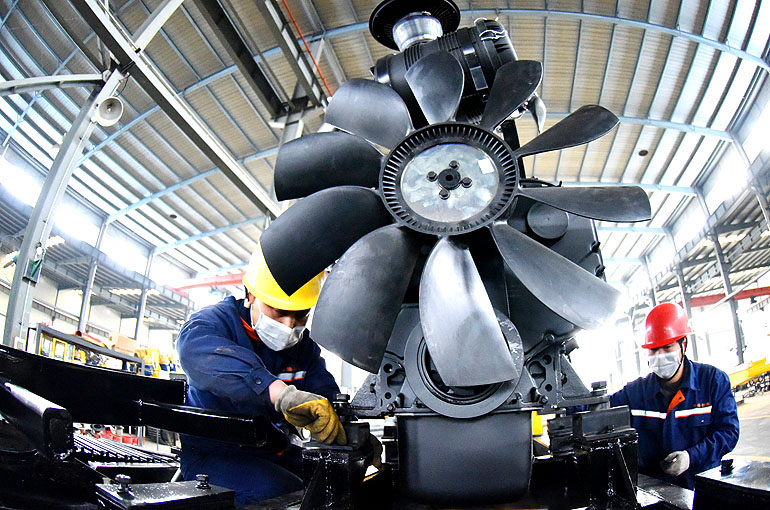
Like those of the Euro Area and the US, China’s economy seems to be running at two speeds. So far this year, the service sector has held up fairly well while the industrial sector seems to have stalled.
Figure 1 presents the purchasing managers’ indices for the manufacturing and service sectors of the three major economies in terms of their deviations from their 2018-19 averages. In China, the US and the Euro Area the manufacturing purchasing managers’ indices are weak and declining while those for services are more buoyant.
Figure 1
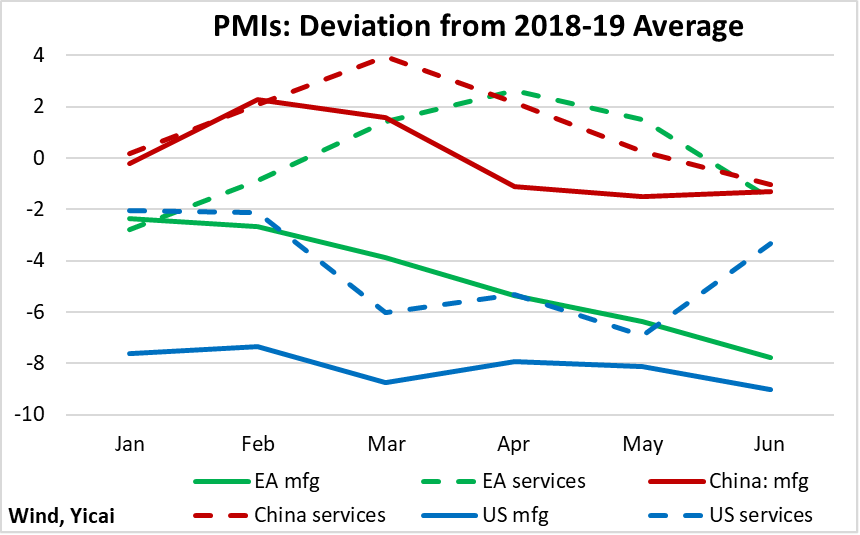
While all three economies are burdened with sluggish industrial sectors, there are important differences between them.
In the US and the Euro Area, the monetary authorities are trying to engineer economic slowdowns to keep inflation in check and short-term interest rates are well above pre-pandemic levels. However, in China, rates are lower than they were in 2019, as the authorities are trying to support aggregate demand.
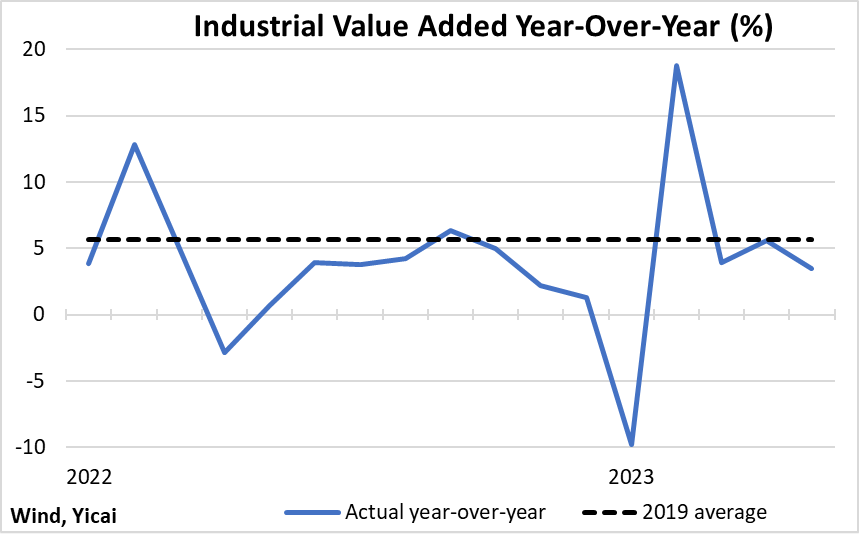
Looking through the volatility in the last year and a half, the growth of industrial value added in China has, despite supportive macroeconomic policy, been below its 2019 average (Figure 2). Indeed, May’s growth dipped to 3.5 percent, a marked deceleration from March and April.
What is holding back China’s industrial activity?
Figure 2
To some extent, China has been the victim of its own success.
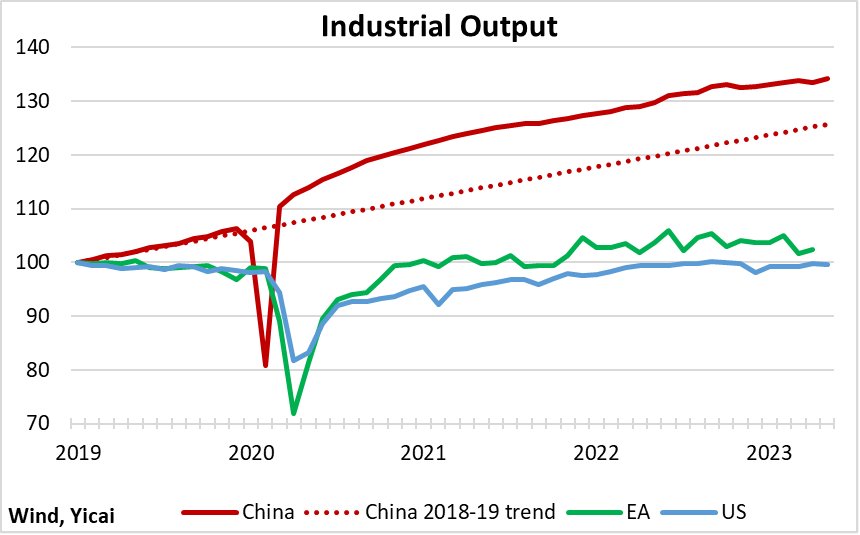
During the pandemic, Chinese industrial output was well above its 2018-19 trend. Its supply chains were less affected by Covid than those of its trading partners and its factories supplanted production elsewhere (Figure 3). As global production came back on stream and the Omicron variant took a toll here at home, the growth of China’s industrial output slowed.
Despite this slowdown, the level of industrial value added remains well above trend and is a third higher than it had been in January 2019. In comparison, industrial production in the US and the Euro Area has shown little growth over the period.
Figure 3
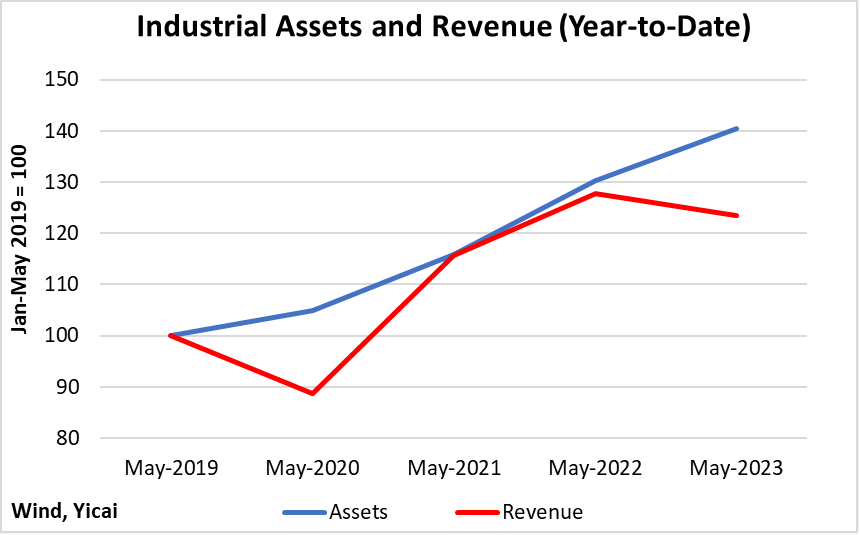
Chinese industrial firms responded to the strong demand for their products by expanding their plant and increasing their equipment. Industrial assets are 40 percent higher than they were four years ago (Figure 4). Unfortunately, sales have been volatile and only rose by 24 percent over the same period.
Figure 4
When revenue growth does not keep pace with that of assets, unit costs rise and firms’ profit margins come under pressure. To survive periods of low profitability, they cut back on their production (Figure 5). So, weak profitability explains much of the slow growth in industrial value added this year.
Figure 5
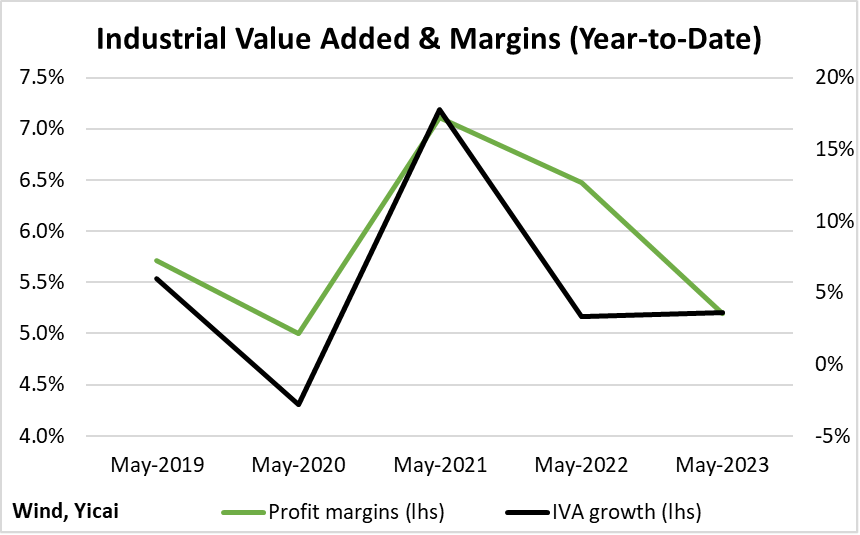
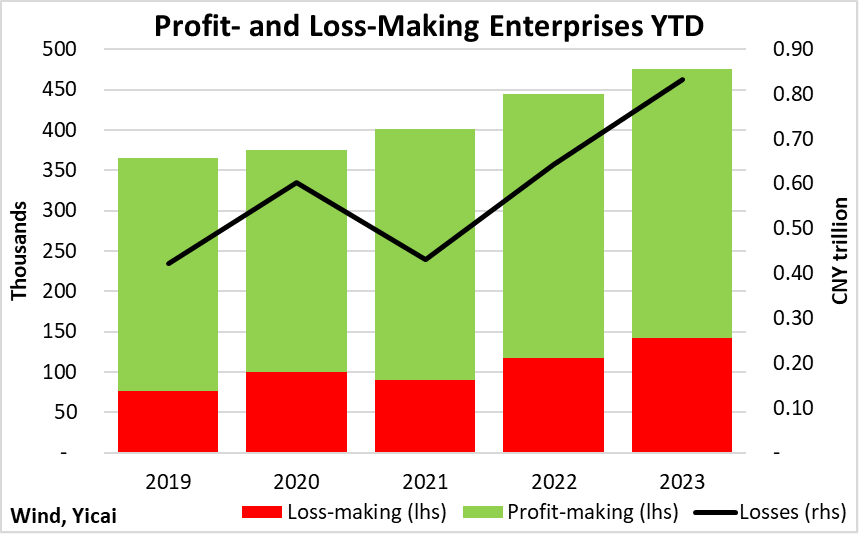
As Figure 5 shows, margins so far this year are slightly below those recorded in the January-to-May period of 2019. However, this profit squeeze does not appear to be affecting all firms equally. In 2019, only 21 percent of the large firms in this sample lost money. So far this year, 30 percent of the large industrial firms have incurred losses (Figure 6). Moreover, the amount of money lost has nearly doubled and exceeded CNY 0.8 trillion.
Figure 6
The increased severity of losses this year suggests that looking at the aggregate picture may miss important developments at the industry level. The National Bureau of Statistics reports production and profitability data for 41 industries. To simplify the analysis, I will look at a subset of 28 key industries which I will divide into four groups.
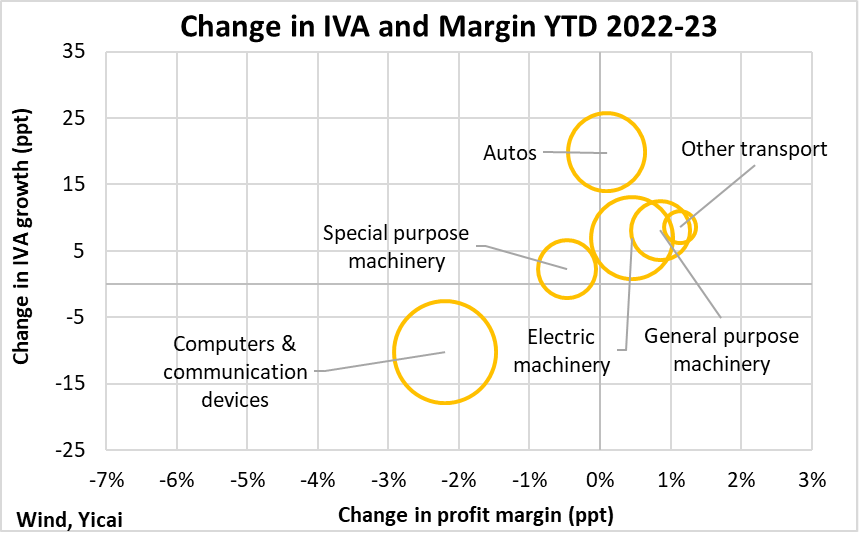
Let’s begin with a set of downstream industries which produce sophisticated finished products for consumers or businesses. Figure 7 presents the 2022-23 change in the growth of industrial value added (IVA) and in profit margins for these six industries. The size of each circle corresponds to the relative magnitude of assets of that industry within the group.
Of the four groups, this was the one which recorded the fastest acceleration of industrial value added from last year (+5.9 percentage points). It was also the only group not to experience a decline in margins (they were flat year-over-year). Given the buoyant conditions for this group, it is not surprising that it continued to expand rapidly. The assets of this group rose by 10.9 percent so far this year, compared to 6.8 percent for industrial firms as a whole.
The “computers and communication devices” industry saw both a large decline in industrial value-added growth and significant pressure on margins. This industry is rather unique as close to half of its output is exported. This is three times the share of the other industries in this group. Moreover, its output had grown relatively rapidly in the previous four years as a result of the work-at-home trend.
Figure 7
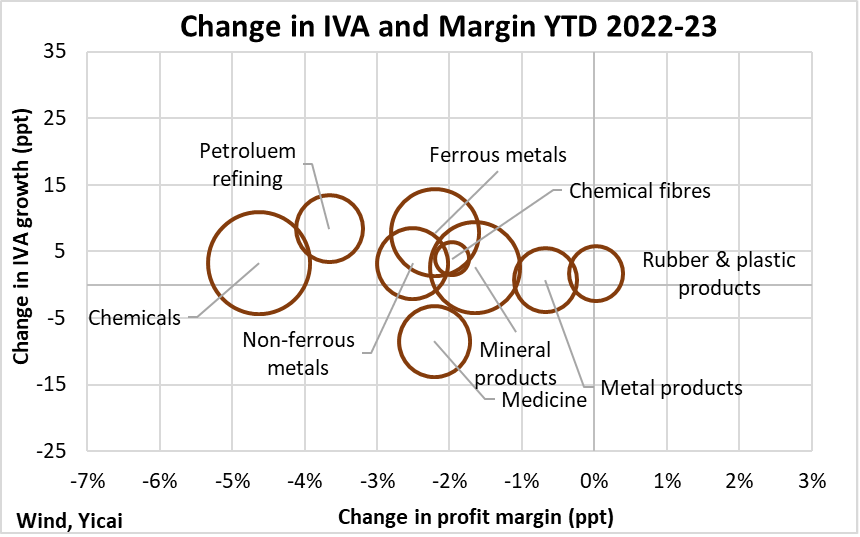
We turn next to nine mid-stream industries (Figure 8). On average, margins for this group were 2.2 percentage points lower than last year. The “rubber and plastic products” industry was the only one to eke out a modest gain in profitability. Industrial value added for the group accelerated by 2.6 percentage points, less than half as much as the sophisticated downstream industries in Figure 7. Asset growth was a modest 4.1 percent. Some of these industries, including ferrous and non-ferrous metal products and mineral products are likely suffering because of the downturn in the property market. The construction of housing demands large quantities of base metals and cement.
Figure 8
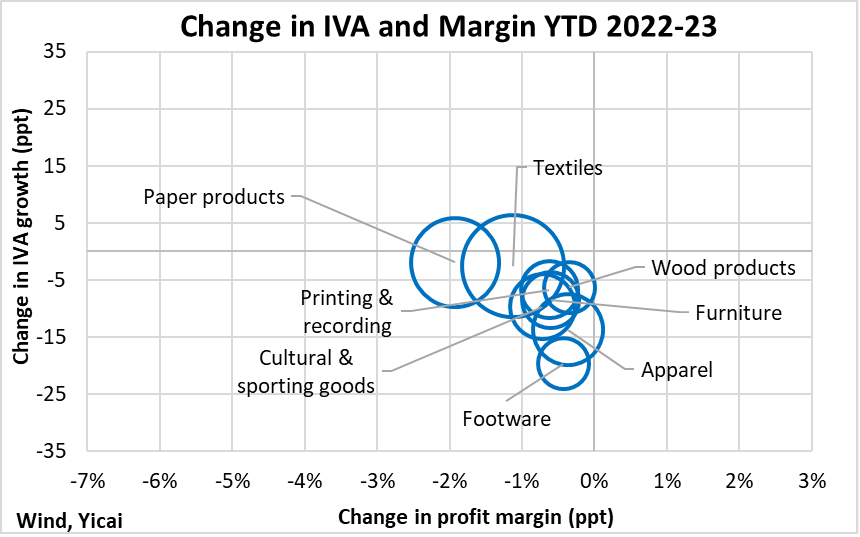
The slowing in industrial value added was quite pronounced (8.6 percentage points) for the eight industries in the labour-intensive/low-value-added group (Figure 9). Reduced production was consistent with a 0.8 percentage point shrinkage in their average profit margins. Of the four industrial groups, this was the only one in which assets fell (1.6 percent) from last year. The biggest decline was recorded for footwear (13.0 percent), which was also the industry with the greatest contraction in industrial value-added growth (19.7 percentage points).
While the performance of this group is painful to see, it reflects the process of China’s moving up the value chain. On average, this group’s margins are well below those of the sophisticated downstream industries depicted in Figure 7. From a macroeconomic perspective, the migration of industrial assets toward higher-margin industries is a good thing.
Figure 9
Industrial value added growth slowed for each of the five extractive industries shown in Figure 10 with the deceleration averaging 8.6 percentage points. On average, margins were compressed by 1.6 percentage points, but the “mineral mining” industry and the “non-ferrous metal mining” industry both experienced higher profitability.
Figure 10
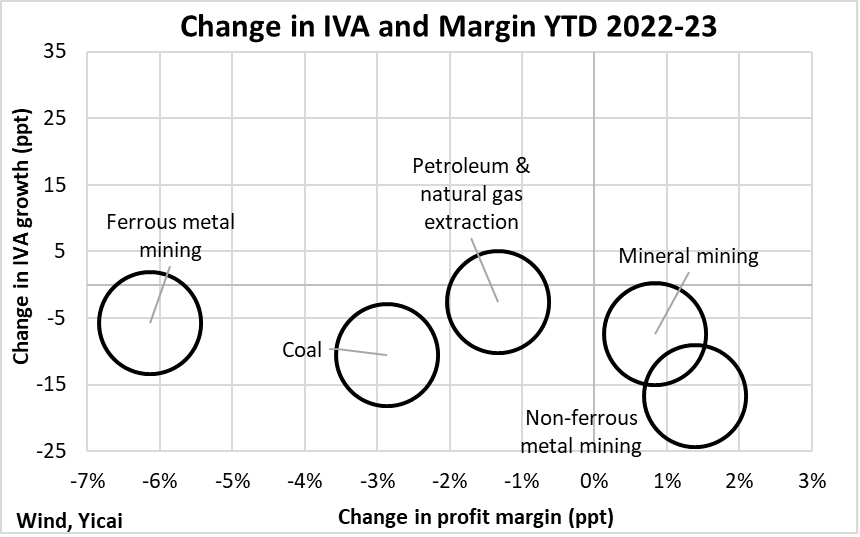
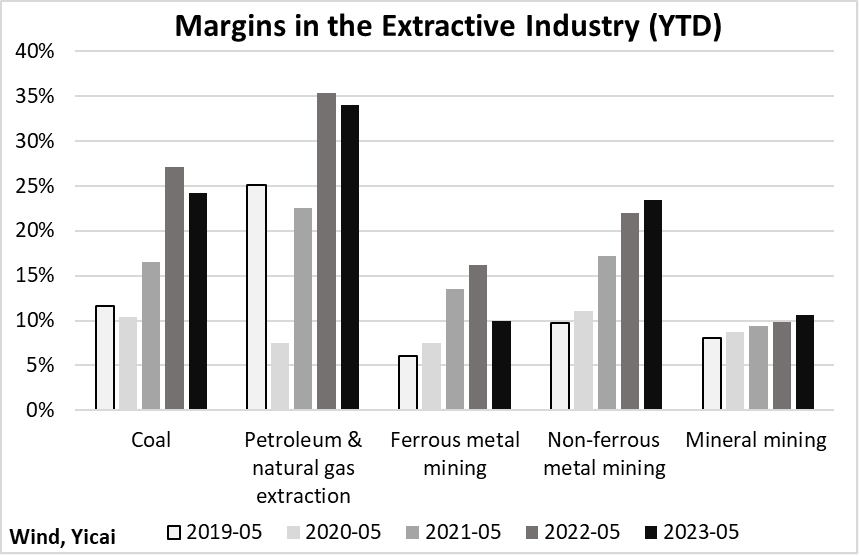
It is, perhaps, counter-intuitive that these extractive industries would increase their assets at the same pace as the sophisticated downstream industries despite worsening profitability. But it appears that while these industries’ margins are lower than last year, they remain well above those in 2019 (Figure 11). Firms in these industries must expect that profitability will remain high to justify expansion. Growing assets is ultimately incompatible with shrinking output, so something will have to give.
Figure 11
Where will China’s industrial sector go from here?
It is reasonable to expect that demand both at home and abroad will improve.
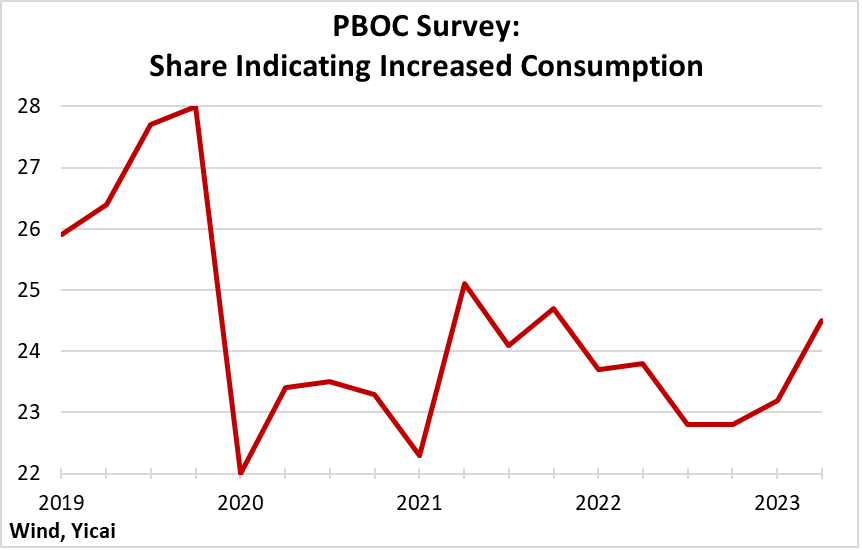
In the People’s Bank of China’s latest depositor survey, respondents indicated renewed interest in consumption (Figure 12). The share that said they were willing to buy more was still lower than in 2019. Nevertheless, if sustained, the improvement in consumer confidence is positive for domestic demand.
Figure 12
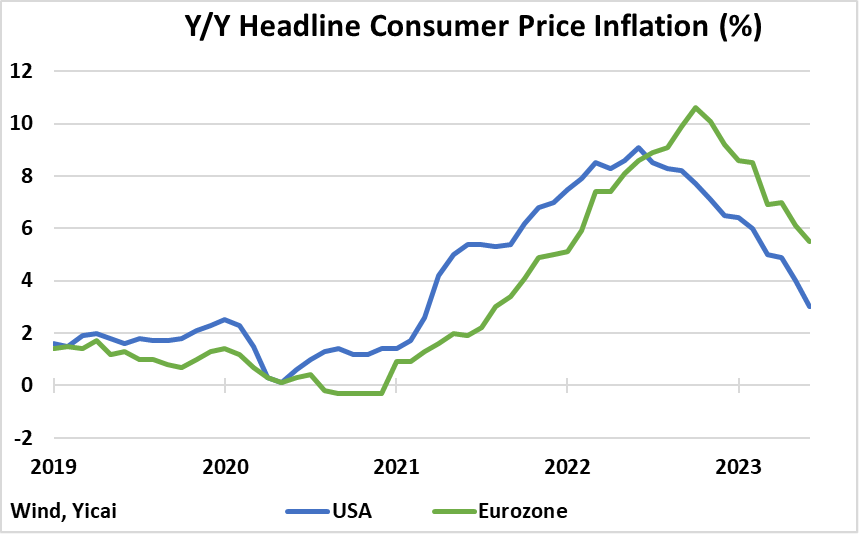
It looks like inflation in China’s trading partners has peaked (Figure 13). While interest rates may rise further, the end of the tightening cycle is nigh. Should the US and the Euro Area be able to bring inflation down and avoid descending into recessions, China’s exports would surely benefit.
Figure 13
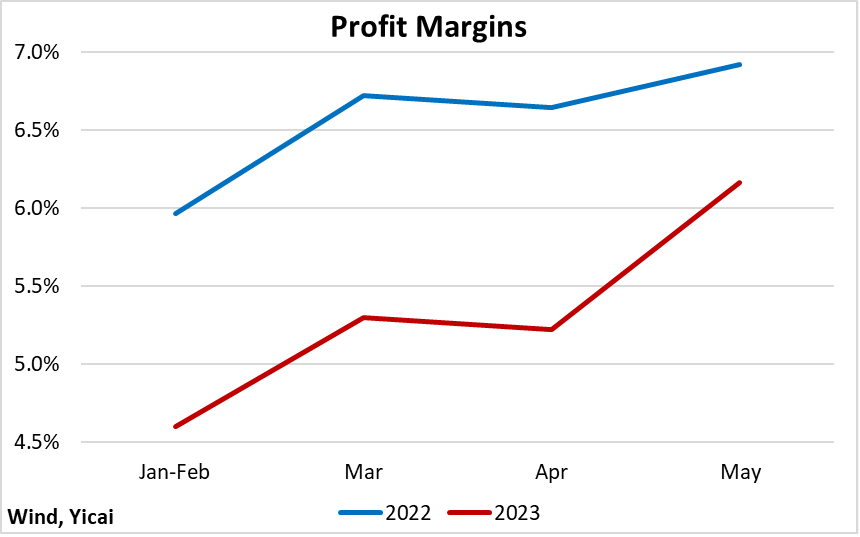
Finally, looking at the data on a monthly basis suggests a positive trend in profitability (Figure 14). While firms’ profit margins in May remained lower than last year’s, the gap appears to be closing. If profit margins return to normal, the growth in industrial value added should accelerate.
Figure 14
In summary, the growth of industrial value added is closely related to profitability. In general, when profitability is high, firms expand production. And they cut back when profits are squeezed. Industrial value added expanded rapidly during the early years of the pandemic. Despite the recent slowdown, the level of production is high relative to the US and the Euro Area and China’s own pre-pandemic trend. The buoyant demand for their products led firms to increase their capacity. More recently, sales have disappointed. The US and the Euro Area tightened monetary policy to reduce aggregate demand. In China, the battle against Omicron and the reopening gave rise to increased uncertainty over the economy’s future path.
At the industry level, the same broad pattern holds with output being tied to profitability. At one end of the spectrum, firms producing sophisticated downstream products have maintained profitability and are raising output and capacity. At the other, firms specializing in low-margin, labour-intensive goods are finding these times especially trying.
The data for May show encouraging hints of improving profitability. Moreover, with signs that demand could strengthen both here and abroad, the outlook for China’s industrial sector should brighten later this year.
 Mark KrugerBased in Shanghai, Mark Kruger holds Senior Fellow appointments at the Yicai Research Institute, the Centre for International Governance Innovation and University of Alberta’s China Institute. Between 2020 and 2023, Mark was the Opinion Editor at Yicai Global. Previously, he had a 30-year career with the Bank of Canada in the course of which he served as a Senior Advisor to the Canadian Executive Director at the IMF and the head of the Economic and Financial Section of the Canadian Embassy in Beijing.


