 Unraveling China’s Productivity Paradox
(Yicai) Nov. 10 -- China is the world’s leader in manufacturing. It contributes around 30% of global manufacturing value–added and as much as two–thirds of physical output in shipbuilding, electric vehicles, lithium batteries, commercial drones and solar panels. It employs cutting–edge technology, installing over half of the world’s industrial robots in 2024, with a robot density 50% higher than the US. It boasts over 30,000 smart factories, including autonomous “dark factories” operating without workers or lights around the clock. Tesla’s Shanghai Gigafactory produces twice as many vehicles per worker as its California plants.
Yet almost all available studies claim that China’s manufacturing labor productivity is significantly lower than that of the US, with estimates as low as a single–digit percentage of US levels. This seems a paradox: China’s manufacturing is globally competitive, yet not productive. Is China’s manufacturing efficiency an illusion?
The seeming paradox arises from flaws in research methodology. The estimates of China’s low productivity fail to account for the distinction between original design manufacturers and original equipment manufacturers. They also do not properly account for significant price differentials between the two countries. In industries where output can be measured in physical terms, a Chinese worker produces 2–3 times as much physical output as an American one. In nominal dollar value–added terms, however, the Chinese advantage narrows to about 20% due to price and purchasing power differentials. Measured properly, China is indeed a global leader not just in manufacturing output, but in manufacturing productivity.
Measurement flaws: apples vs oranges
Economists typically measure labor productivity by value–added per worker. Value–added is defined as revenue minus the cost of intermediate inputs. There are good reasons for using this measure. It enables comparison of output in different industries, such as furniture and computers, or within different segments of one industry (for instance a Honda Civic and Mercedes S–Class).
But value–added can also result from non–manufacturing factors, such as product design, branding, intellectual property related to the product (as opposed to IP embedded in the production process) and marketing. This monetary definition of value–added can also be affected by persistent price differentials across borders, such as those due to tariffs or different inflation rates. So the standard measure of value–added makes it difficult to isolate the true productivity of labor in the manufacturing process itself.
Consider two types of manufacturers: original design manufacturers (ODMs) like Apple and Nvidia and original equipment manufacturers (OEMs) like Foxconn and Taiwan Semiconductor Manufacturing Co. (TSMC). ODMs employ no manufacturing labor and derive all value from product design and procurement management. OEMs focus on physical production. Apple generates much higher value per employee by designing iPhones than does Foxconn which manufactures them. Nvidia, a semiconductor chip designer, produces much higher value per employee than TSMC which makes the chips for Nvidia.
Does this mean that Foxconn and TSMC are inefficient manufacturers? No. Both Foxconn and TSMC are among the most efficient and productive manufacturers in the world. Yet a conventional value–added measurement of labor productivity, by conflating ODMs with OEMs, produces the paradoxical result that the most efficient manufacturers have low manufacturing labor productivity.
Another issue with measuring productivity in nominal value–added terms is a significant price differential for identical products across different countries. Without properly accounting for price and purchasing power differentials, the value–added approach may not reflect true productivity.
Chinese workers are twice as productive
To better assess true manufacturing labor productivity, we need to use like–for–like comparisons. OEMs should be compared with OEMs in the same industry, and we need to measure per–worker physical output.
In this study, I examine five industries with significant producers in both US and China where physical output measures are available: shipbuilding, integrated steel mills, electric vehicles, solar photovoltaic modules andcement. Except for solar modules where industry–wide data are deemed reliable, labor productivity data was sourced from the annual reportsor 10–Ks of publicly listed companies. Electric vehicle data came from Tesla, which operates gigafactories in California and Shanghaiproducing identical models.
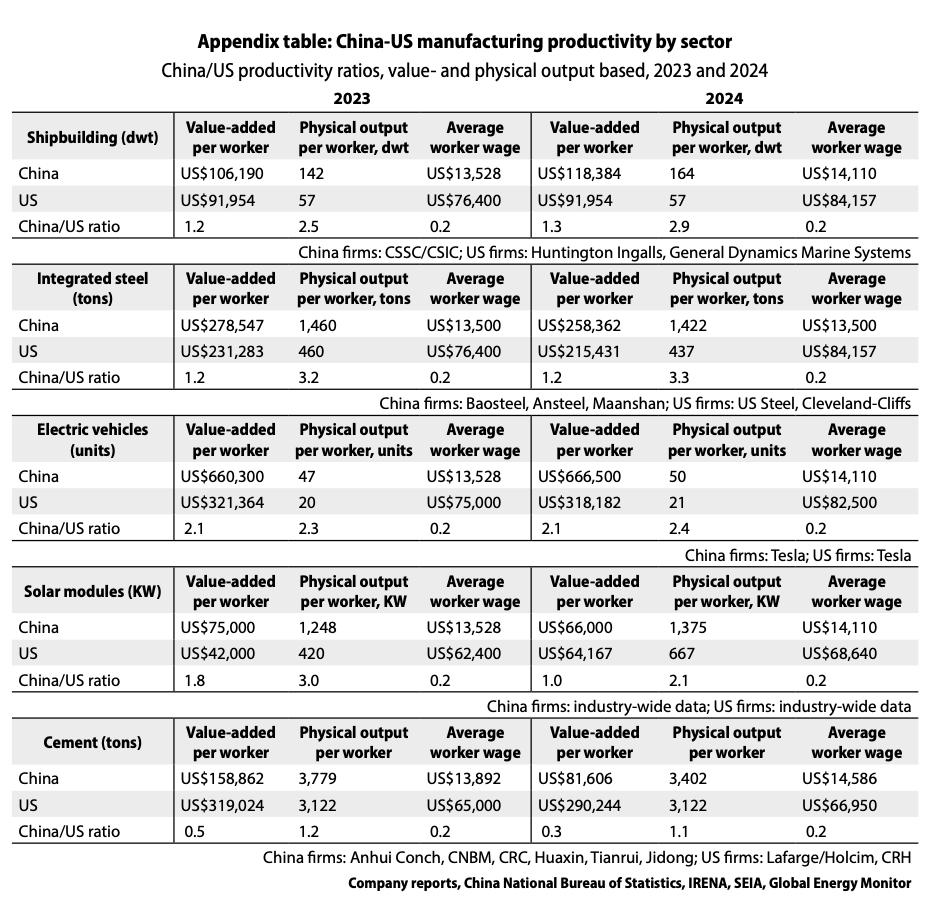
For each industry, labor productivity is measured in terms of both physical output and nominal value–added (without adjusting for price differentials). I also report average wages, as they are a proxy for labor’s contribution to productivity. All calculations were performed for both 2023 and 2024, as labor productivity can vary due to capacity utilization and price fluctuations.
The findings, summarized in the table below, are striking. In every industry China’s manufacturing labor productivity in physical output per worker was greater than that of the US, by an average of 2.4 times. In nominal value added terms, China’s advantage narrows to an average of 1.2 times. Cement is the outlier: China’s physical output per worker was slightly higher than in the US, but productivity in nominal value added terms was 28–50% of an American worker due to substantial price differentials. (Complete data for both years in all industries is in the appendix.)
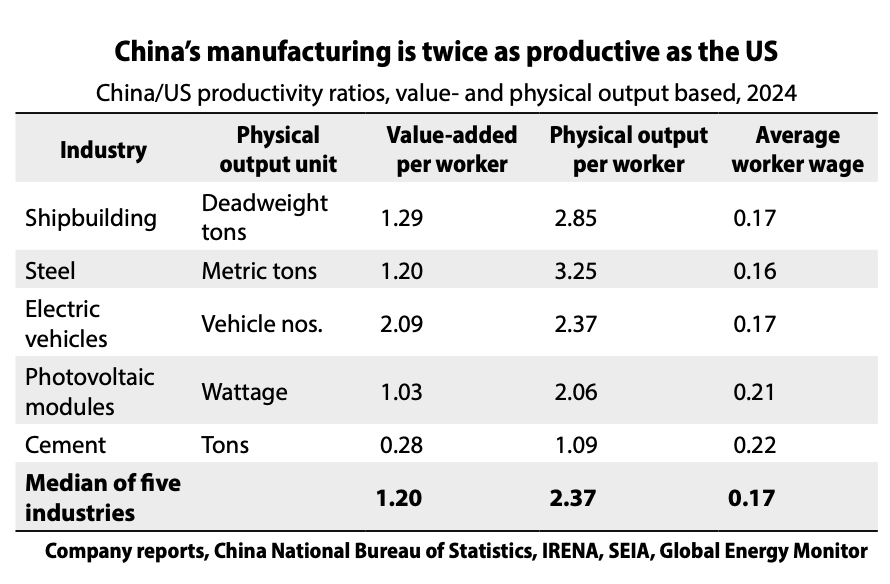
China’s higher labor productivity does not translate into higher wages than in the US. American workers are paid five to six times more than Chinese ones in nominal US dollar terms, although the purchasing power of a dollar is twice as high in China as in the US, according to the IMF. The difference in manufacturing wages between the US and China reflects the gap in national income levels rather than in manufacturing labor productivity alone. National income levels are determined by the productivity of the whole economy, not just by productivity in any specific sector such as manufacturing. Tesla exemplifies this: its Shanghai workers are twice as productive but paid 17–18% as much as their US counterparts in nominal US dollar terms.
Tariffs are bad for productivity
Trade barriers often elevate domestic prices above international market levels by shielding local producers from foreign competition, which can inflate revenue and thus boost value–added per worker in protected industries. But this does not equate to genuine improvements in labor productivity.
In fact, empirical studies consistently show that protectionism leads to lower productivity by reducing incentives for innovation, efficiency and resource reallocation. For instance, a 2019 IMF study found that tariff increases reduce labor productivity by about 0.9% after five years due to inefficiencies in labor use, while a 1999 analysis by Jeffrey Frankel and David Romer demonstrated that free trade boosts growth and incomes by enhancing productivity, while protectionism yields the opposite effect.
A common feature of all the industries in our analysis is that trade barriers effectively bar Chinese products from the US. These barriers contribute to prices being significantly higher in the US than in China, which partially explains the narrower US productivity gap in nominal value–added terms. Steel has one of the largest discrepancies between physical and value – based productivity. The Chinese and US steel industries are structurally different: over 90% of China’s production comes from integrated mills that convert iron ore into steel, whereas two–thirds of US production is in mini–mills that recycle steel scrap. My data compare only integrated mills. China’s integrated mills produce 3.2 times more steel per worker than US mills; yet per–worker value–added in nominal terms is only 1.2 times higher. This primarily stems from US steel prices being 75% above international prices due to tariffs.This protection has made the US steel industry progressively less efficient: US steel output per labor hour hasdeclined by 32% since 2017. The story is similar in cement, where the US price is US$148 per ton, versus US$55 in China.
Tariffs are not the only thing driving up US prices
Electric vehicles provide a clear comparison, as Tesla’s Shanghai and California Gigafactories produce identical Model 3 and Model Y vehicles. In 2024, Shanghai produced one million vehicles with 20,000 workers, while California produced 464,000 with 22,000 workers. Even in nominal value–added terms, Tesla’s Shanghai workers were twice as productive as their US counterparts. This despite the fact that Model 3 prices are 24– 32% lower in China due to competition from numerous other EV makers, whereas Chinese EVs are practically barred from the US market.
In solar modules, where China dominates the world market with an 80% global share and produces 70 times more wattage than the US, China’s wattage produced per worker was double that of the US in 2024, down from about three times in 2023. But nominal value–added per worker narrowed from about 1.8 times higher in China to near parity in 2024, reflecting a 60% price drop in China since 2020 due to intense competition and cost reductions, and elevated US prices due to tariffs and Inflation Reduction Act subsidies.
Other structural price differentials, aside from tariffs, further amplify US manufacturing output in nominal value–added terms. Price gaps for manufactured goods between the two countries far exceed the IMF’s average purchasing–power parity adjustment, which estimates that a dollar buys twice as much in China as in the US.
US drug prices, for instance, are typically 3–10 times higher than in other countries, and in some cases the discrepancy is even bigger. Loqtorzi, acancer drug developed by Shanghai Junshi Biosciences, costs US$280 per dose in China but US$8,892 in the US, a 30–fold markup. The US distributor, Coherus, classified as a manufacturer, captures 80% of this markup (after 20% license fees).
Accounting for ‘factoryless” producers
Another source of confusion is that Apple and Nvidia, along with many other US firms, are “factoryless goods producers” (FGPs), classified as “manufacturers” by American statisticians since around 2013. Approximately 30–40% of US manufacturing value–added, or US$700bn – $1trn out of US$2.9 trn in 2023, is outsourced abroad, with FGPs accounting for 12–15%, or US$348–435bn, according to various estimates. In contrast, less than 5% of China’s manufacturing value–added, or US$200–300bn out of US$4.7trn in 2023, is outsourced abroad.
While the US classifies FGPs as manufacturers, China does not. China’s National Bureau of Statistics emphasizes physical production in its manufacturing data, categorizing firms based on tangible output infacilities they own or operate. Before 2013, US FGPs were classified under wholesale trade or service sectors.If the US classified manufacturers the same way as China does by including only domestic physical production,US manufacturing value–added would shrink by 30–40%.
This is a major reason why comparing aggregate US manufacturing value – added divided by the number of employees with China’s is like comparing apples with a mix of apples and oranges. The two sets are simply not comparable.
China’s manufacturing advantage is real
China’s manufacturing efficiency is no illusion: its workers in many industries produce double or triple the physical output of US workers. The fact that Chinese manufacturing wage rates are 80% lower than those of the US does not reflect lower labor productivity. Conflating manufacturing and non–manufacturing and improperly accounting for price differentials may explain contrary findings in prior studies.
The combination of China’s superior manufacturing labor productivity and higher US wages drives US companies to outsource production to China. Focusing on design, product IP, branding and marketing while outsourcing manufacturing to the most efficient producers is a US strength, not a weakness.
US reindustrialization policies, such as pressuring Apple to assemble iPhones domestically, are unlikely to succeed as they swim against powerful economic tides. If implemented, they will reduce national income by shifting US workers into roles where they are less productive, and generate less value–added, than their foreign counterparts.
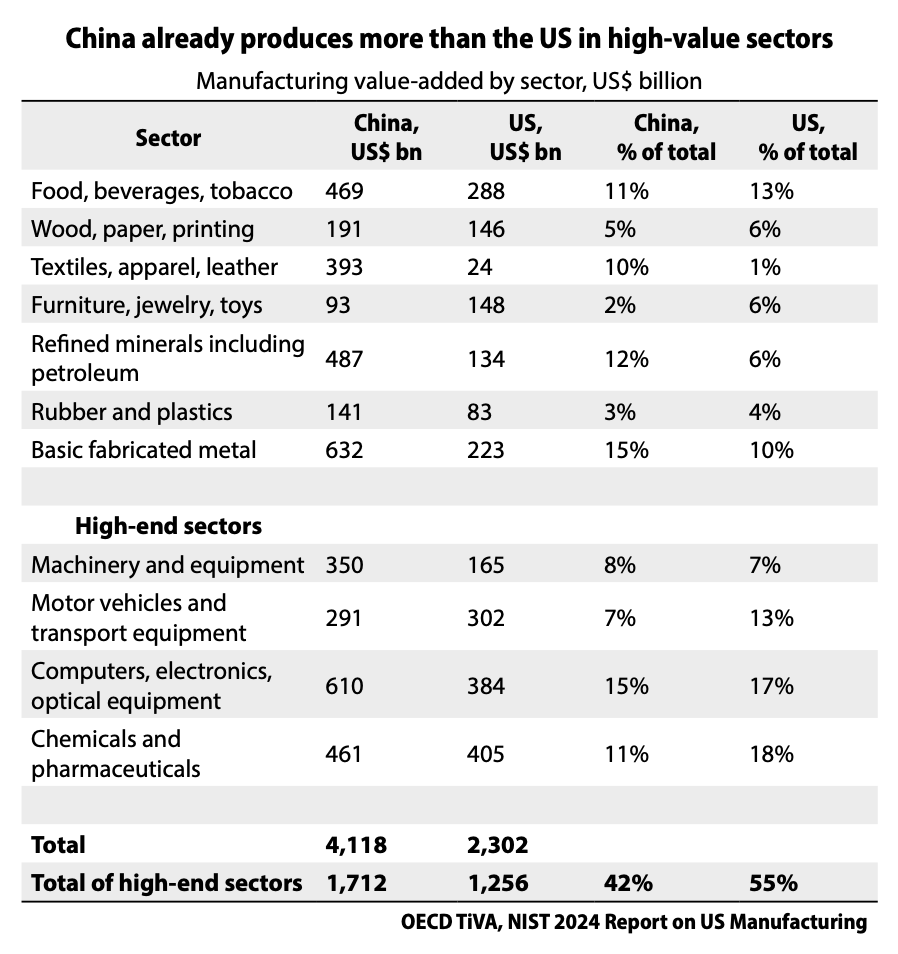
China is ascending the manufacturing value chain, relocating low–end production to lower–wage countries, following the path of advanced economies like the US and Japan. China already produces more than the US in high value sectors, which it would not be able to do if its manufacturing productivity were low. It is improving its manufacturing efficiency by adopting automation and AI–enabled smart manufacturing.
Both nations seek greener pastures for their industrial economies. China’s vision focuses on its manufacturing strengths. US reindustrialization can only succeed in the long run by aiming at top–end, high value–added manufacturing where it needs no trade protection. Globalization enables both to maximize comparative advantages. Decoupling risks suboptimal economic outcomes for both, especially for the US, which lacks the competitive edge in manufacturing that it once held.
(The author of this article is Shan Weijian, Executive Chairman and co-founder of PAG, an Asia focused private equity firm, and the author of Out of the Gobi, Money Games, and Money Machine.)


