 Inflation in China Bucks Global Trend
Wherever you look, inflation is on the rise.
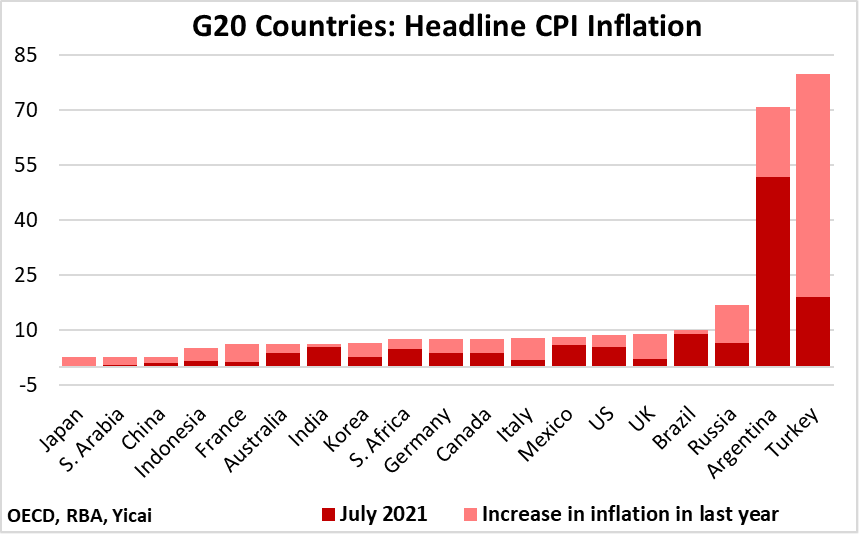
Last July, across the G20 countries, it averaged 3.8 percent. This year, the number is 7.5 percent (Figure 1).
Consumer price inflation in Chinais third lowest among the G20 countries. Its headline rate ticked up 1.7 percentage points to reach 2.7 percent in July. This rate of increase was the second lowest among G20 countries (after India).
There appear to be two key factors that are keeping China’sinflation low and stable: China is not overly-dependent on crude oil and natural gas and its labour supply has remained robust.
Figure 1
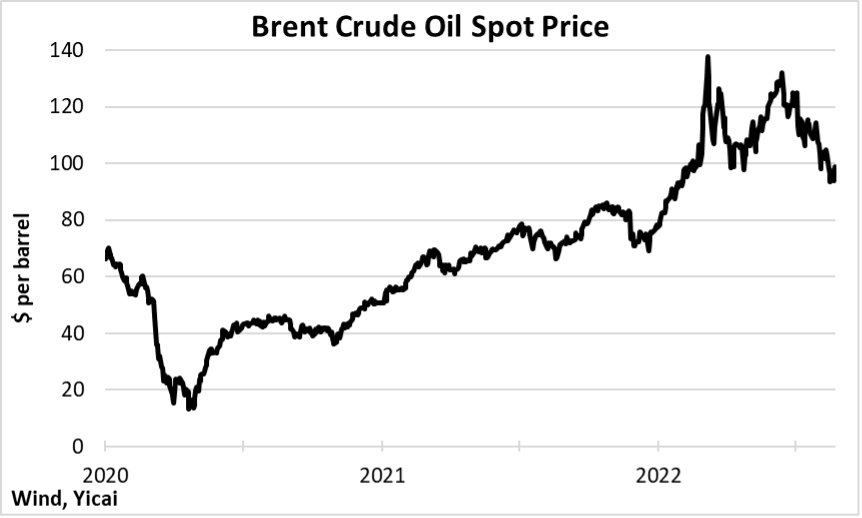
The rapid run-up in global oil prices has been a major contributor to inflationary pressures. While the price of Brent crude oil recently dipped below $100 and it is some 30 precent below its March peak, it is still more than 40 percent higher than this time last year (Figure 2).
Figure 2
Most crude oil is refined into gasoline, diesel and jet fuel, which propel cars, trucks, ships and planes. Consumers face the consequences of an increase in crude oil prices most immediately at the gas stations when they fill up their cars. But oil price increases also ripple through the economy as it becomes more expensive to get goods and people from Point A to Point B.
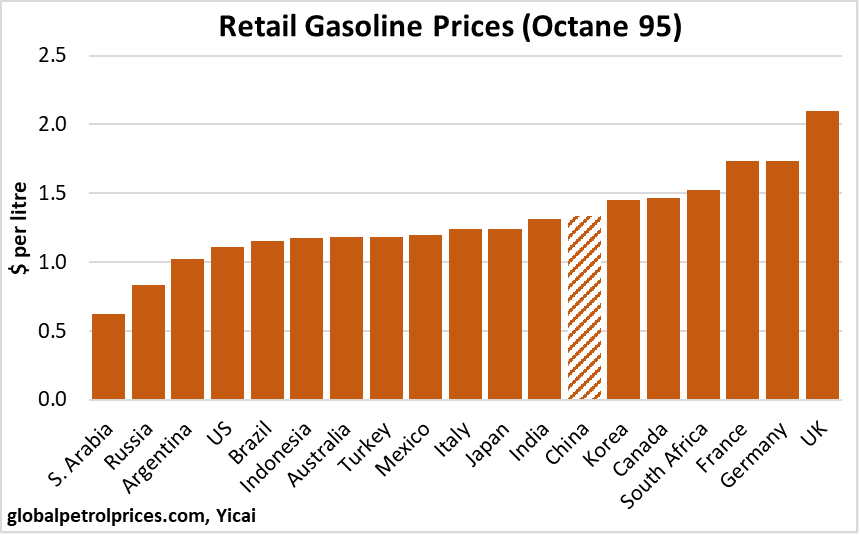
The retail price of gasoline varies considerably among G20 countries (Figure 3). A litre of high-octane gas sells for as much as $2.10in the UK and aslittle as $0.62 in Saudi Arabia, where the government . Cheap and stable gasoline prices are part of the reason that Saudi Arabia’s inflation is among the lowest in the G20.
At $1.34 per litre, Chinese gasoline prices are pretty close to the G20 average. They are about 20 percent higher than the US’s and 20 precent below those in France and Germany.
Figure 3
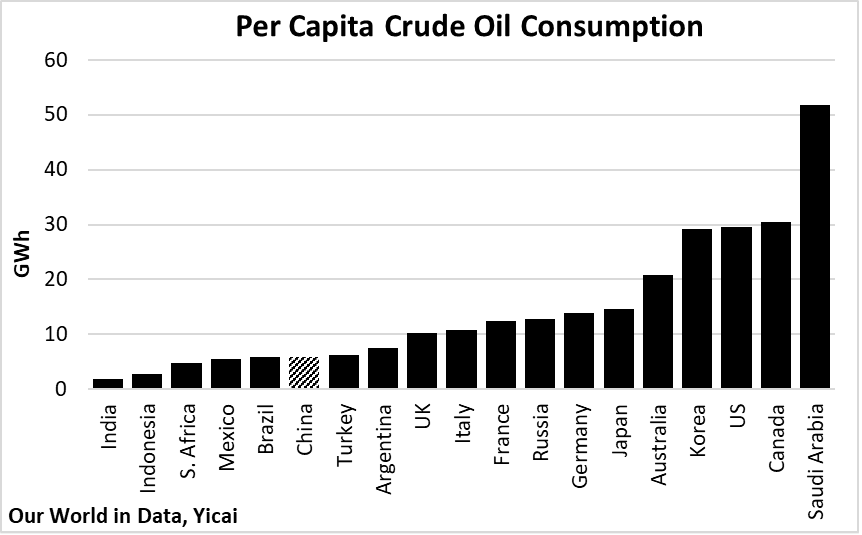
Eventhough Chinese gasoline prices are at the world level, the run-up in crude oil prices has had a relatively modest impact on inflation here. This is because China’s per capita consumption of crude oil is relatively modest, only 40 percent of the G20 average. Indeed, Chinese people only consume one-fifth as much crude as their Korean, American and Canadian neighbours (Figure 4).
Car ownership in China is not as widespread as in many of the other G20 countries. This keeps per capita oil consumption down. In addition, China has a relatively high share of vehicles that run on electricity rather than gasoline.
Figure 4
The price of natural gas is increasing even faster than that of crude oil.
The market for natural gas is not as globally integrated as crude oil’s and there can be large regional differences in prices. Thus, the price in Germany has tripled in the past year and is currently seven times as high as in the US.
The high price of natural gas is contributing to inflation in many, but not all, European countries. France, for example, is much less reliant on natural gas than Germany, Italy and the UK, as it generates a lot of nuclear power for its energy needs.
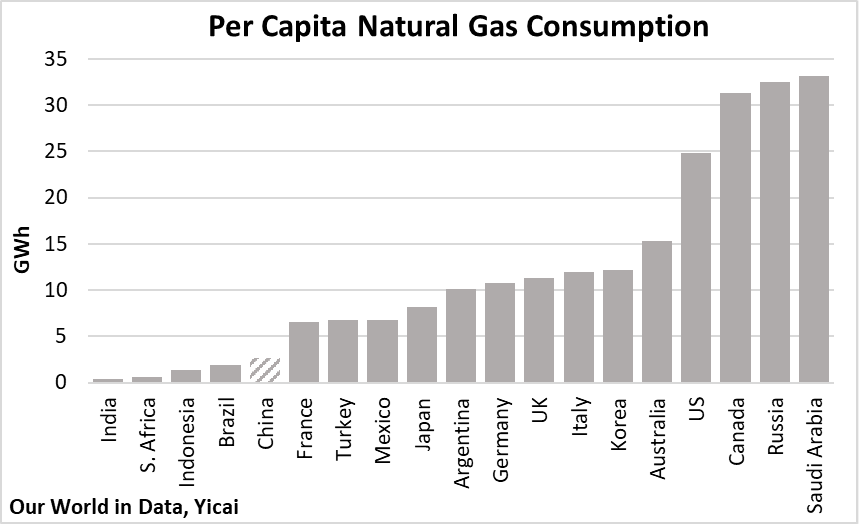
China is the world’s largest importer of liquified natural gas (LNG), which makes up close to of its gas imports (the rest coming via pipelines). Chinese LNG prices are up 27 percent year-over-year. However, China is much less reliant on natural gas than the European G20 countries (Figure 5). Per capita natural gas consumption is less than one-quarter that of Germany, Italy and the UK. This will limit the passthrough of higher LNG prices to headline inflation.
Figure 5
In China, energy prices have been kept in check, in part, by significant increases in supply. According to National Bureau of Statistics Fu Linghui,China raised the output of raw coal, crude oil and natural gas by 12, 4 and 5 percent, respectively, in the year-to-July.
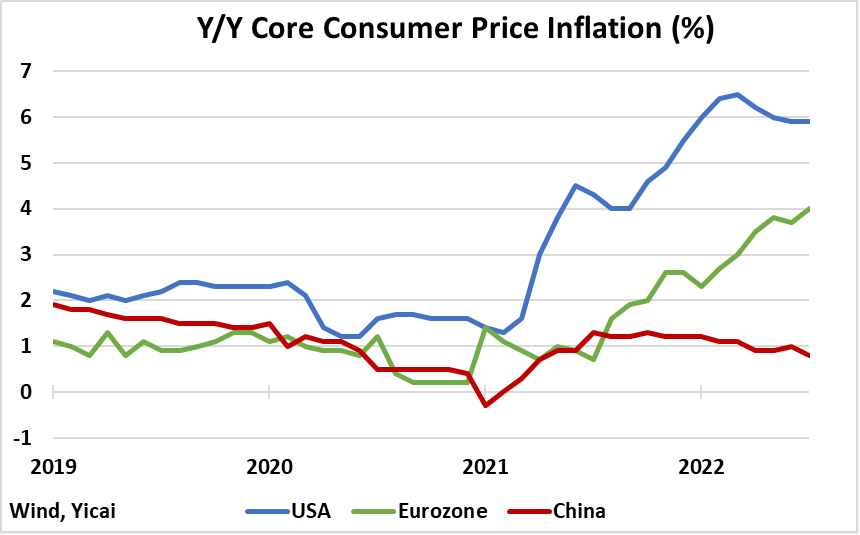
But rising energy prices are only part of the global inflation story. Looking at measures of “core” inflation, which strip out the effects of volatile food and energy prices, we still see a marked acceleration of price pressures in the US and Europe (Figure 6).
Figure 6
Economic theory holds that sustained increases in core inflation ought to be the consequence of aggregate demand exceeding aggregate supply. Wage growth is one of the key channels through which the supply-demand imbalance affects core inflation.
Since the outbreak of the pandemic in the first quarter of 2020, the global economy has registered below-trend growth. It is easy to see how Covid has reduced the demand for services. What is less obvious isthe pandemic’s impact on supply, in particular the supply of labour.
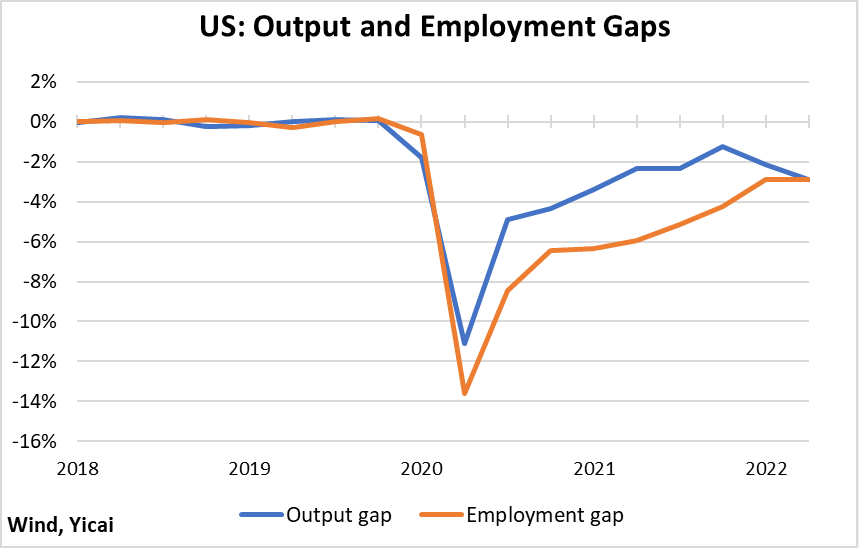
Figure 7 presents a simple measure of the US’s output gap: real GDP as a percent of what it would have been had GDP continued to grow at its 2018-19 trend.This output gap opened wide in the second quarter of 2020and closed to -1 percent in the fourth quarter of last year. With GDP falling in each of the first two quarters this year, the output gap widened to -3 percent.
Figure 7also compares the output gap to an employment gap: actual employment expressed as a percent of what employment would have been had it continued to grow at its 2018-19 trend.
Since the second quarter of 2020, the US’s employment gap has been larger (more negative) than its output gap. This suggests that labour demand exceededlabour supply. It implies that wage growth should have accelerated. And US wage growth has, indeed, accelerated. Between the second quarter of 2020 and the second quarter of 2022, annual wagegrowth averaged 6.3 percent. In 2019, a year in which US labour markets were already considered tight, wage growth only averaged 3.1 percent.
Figure 7
It is instructive to compare the US’s experience with Europe’s.
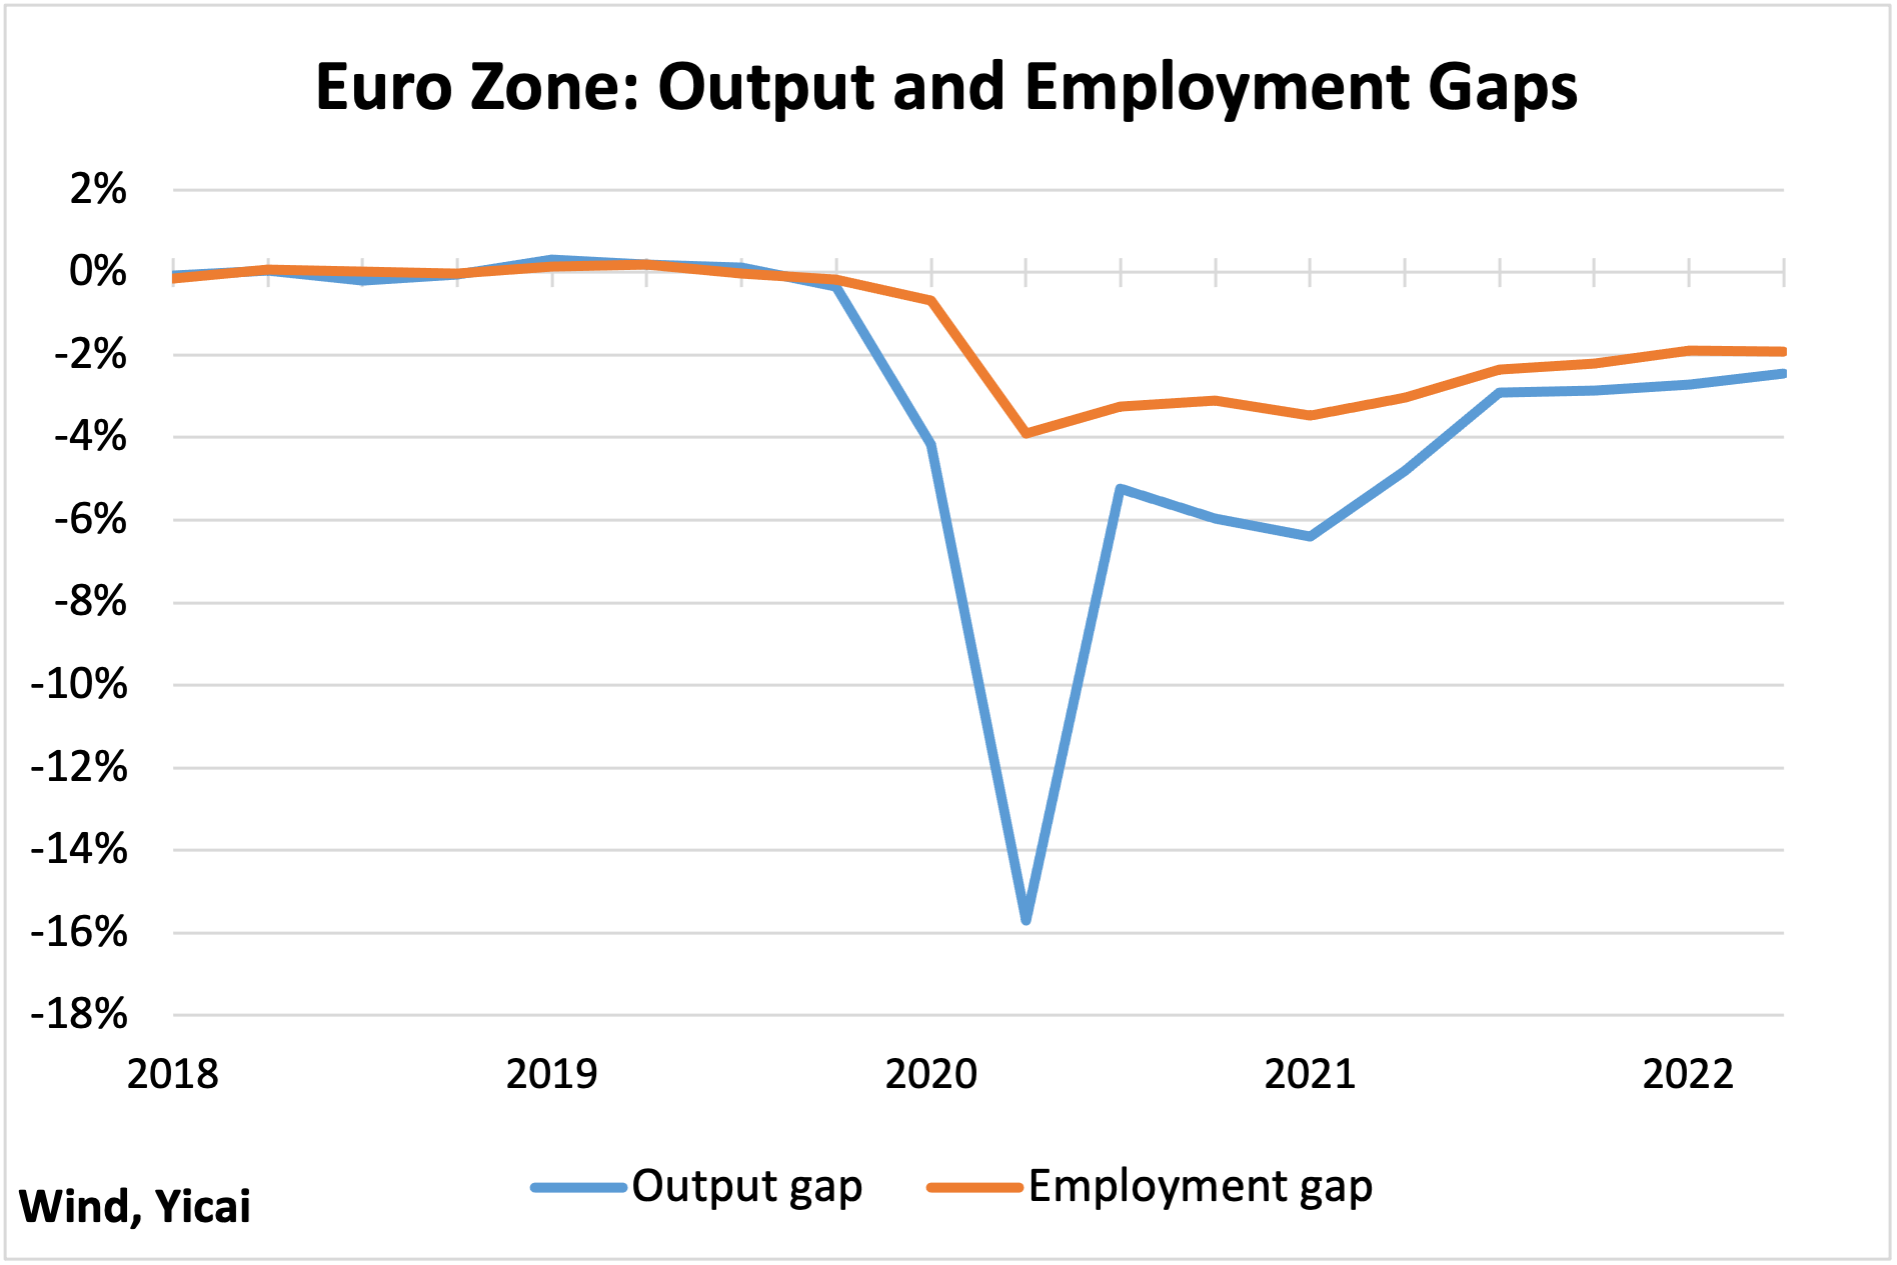
Figure 8 presents the output and employment gaps for the Euro Zone. In contrast to the US, Europe’s employment gap was smaller (less negative) than its output gap. This suggests that aggregate demand fell more than aggregate supply and it implies that European wage growth should have decelerated. And European wage growth did decelerate, slightly, to 2.2 percentover 2020Q2 and 2022Q1, from 2.5 percent in 2019.
Figure 8
Why did employment fall so much more in the US than in Europe?
Covid infection rates in the US and Europe have been broadly comparable. However, Americans have been 20 percent more likely to die from the virus than Europeans. The relatively poor availability of health care in the US likely explains the higher death rate.
Moreover, European firms allow their workers to take paid leave than those in the US. Thus, Americans were more likely to drop out of the labour force in order to manage their symptoms, or care for others, than Europeans. There is analysis that suggests that Covid-related effects may have caused US employment to drop by as much as , or about 4 percent. This would explain a lot of the US’s employment gap.
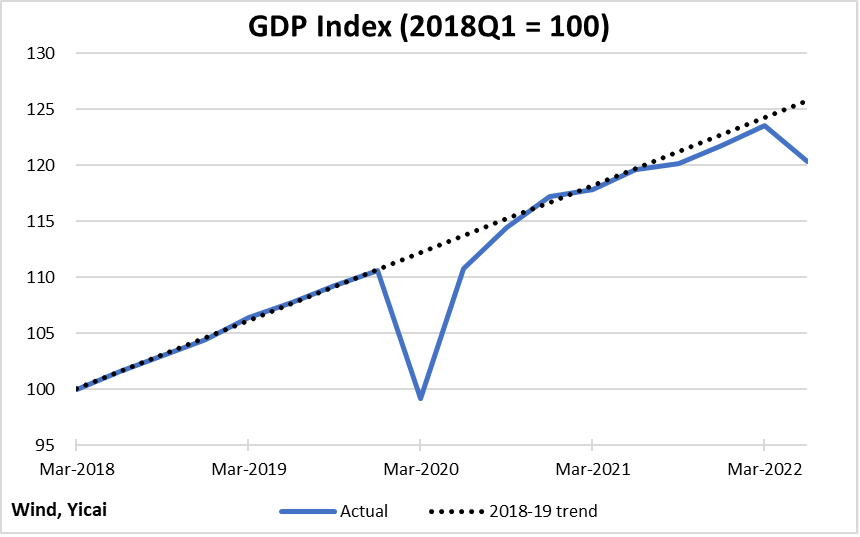
China’s output gap has a rather different profile from the “U” shape we see in the US and Europe. It opened, closed rapidly and recently reopened (Figure 9).
Figure 9
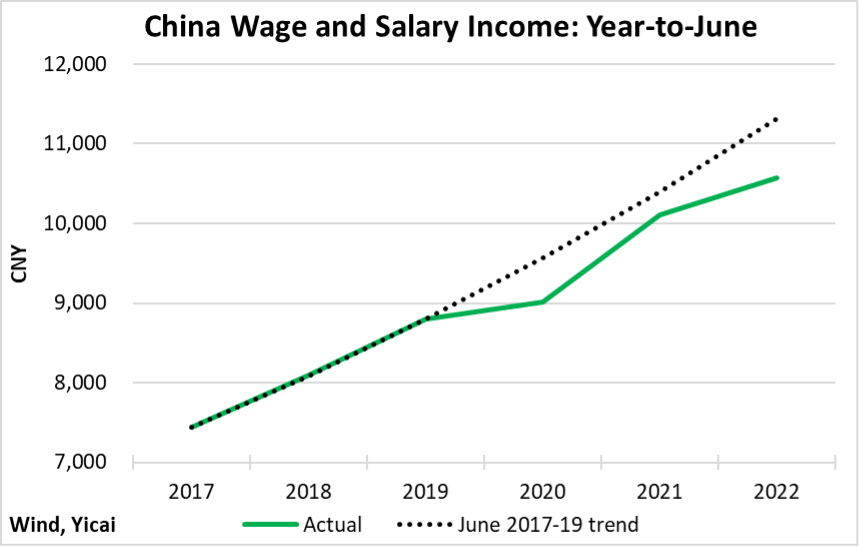
China’s National Bureau of Statistics does not provide the data we need to create an employment gap. Nevertheless, the income data from its household survey show a significant deceleration in wage growth since the outbreak of the pandemic.
Figure 10 plots the level of per capita wage and salary income earned in the first half of the year between 2017 and 2022. Between the first half of 2017 and the first half of 2019, wage and salary income grew by close to 9 percent annually.Between the first half of 2019 and the first half of 2022, its annual growth slowed to 6 percent. This is a more rapid deceleration than we saw in Europe.
The level of wages in the first half of this year was 6 percent below trend. This leads us to infer that labour supply did not drop by as much as labour demand. The resilience of China’s labour supply is consistent with the rates of Covid-related infection and death being much lower here than in other G20 countries.
Figure 10
Although crude oil prices have begun to decline, inflation is likely to remain a pressing problem in many G20 countries. For example, Citigroup expects that rising natural gas prices will push the to almost 19 percent in January, 2023.
China’s low per capita consumption of natural gas means it is unlikely to suffer the UK’s fate. Moreover, with its labour supply remaining robust, China will avoid the sort of wage-price spiral that threatens to take hold in the US.
 Mark KrugerBased in Shanghai, Mark Kruger holds Senior Fellow appointments at the Yicai Research Institute, the Centre for International Governance Innovation and University of Alberta’s China Institute. Between 2020 and 2023, Mark was the Opinion Editor at Yicai Global. Previously, he had a 30-year career with the Bank of Canada in the course of which he served as a Senior Advisor to the Canadian Executive Director at the IMF and the head of the Economic and Financial Section of the Canadian Embassy in Beijing.


