 Is Covid Immobilizing China?
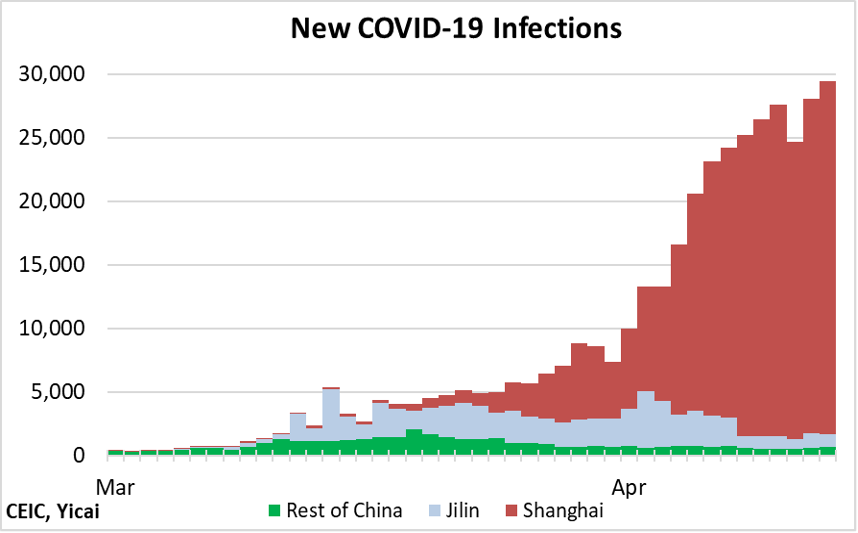
(Yicai Global) April 15 -- The latest data show close to 30,000 new Covid infections in China, with Shanghai accounting for all but some 1700 of them (Figure 1).
Figure 1
As a result of daily testing, they continue to find positive results among my neighbours in our 18-story apartment building. One middle-aged lady had been among our building’s volunteers. She had been active in supplying us with home-test kits, registering us for the tests that were administered by the public health officials and bringing packages of food and other deliveries to those of us who are less mobile.
As she only tested positive recently and hadn’t been allowed to leave our compound for close to a month, it looks like one of our neighbours must have infected her. She has been removed to a quarantine center, while her husband is being put up at a hotel for “close contacts”.
So, volunteering is risky business. Yet implementing China’s “Zero-Covid” policy would be impossible without people stepping up and helping out. I am so proud that my wife, Feifei, decided to fill in for the infected “Auntie” who is now recovering in a converted exhibition center. Here’s a picture of Feifei, in her protective suit, getting ready to pass out test kits to our building’s residents.

No new deaths from Covid have been recorded in China in recent weeks. And the vast majority of the cases are asymptomatic. So, the big question on everyone’s mind is the extent to which the lockdowns will impact the economy.
One recent estimate that is making the rounds uses to estimate the cost of the lockdown.The authors, economics professors in China, the US and Hong Kong, model the effect of imposing a one-month, full-scale lockdown on China’s four most economically important cities: Beijing,Guangzhou, Shenzhen and Shanghai. They find that such a lockdown would reduce the incomes of those cities’ residents by 61 percent that month. Putting those key cities out of commission would cause China’s aggregate monthly GDP to fall by 12 percent, essentially taking one percentage point off of annual GDP growth.
The authors also estimate that if all Chinese cities were locked down, monthly GDP would essentially be cut in half. This would be equivalent to 4.4 percent of annual GDP and would bring targeted growth of 5.5 percent for 2022 down to just 1.1 percent.
With the infection rate outside of Shanghai really very low, it is hard to imagine the Chinese authorities imposing a lockdown on the entire country. Still, given Shanghai’s experience, local officialshave been taking pre-emptive measures. For example, in-person classes for the city’s primary and middle schools as of April 11 and they have begun the construction of a makeshift hospital in the Pazhou exhibition center, just in case.
Gavekal, an independent investment research firm, scoured local government websites and found that, as of April 10,eighty-seven of China’s 100 largest cities had imposed some sort of . These 87 cities account for some two-thirds of China’s GDP.
The restrictions that Gavekal found vary in intensity and it is difficult to know how much impact they will have on economic activity. To get a sense of how much local restrictionsmatter for GDP, we turn to the traffic congestion data supplied by Amap (高德). I have long relied on the Amap app to get me where I need to go. It is accurate and user-friendly. In addition to making sure I don’t get lost, Amap also compiles traffic congestion data for a large number of Chinese cities. These data tell us how much longer it takes to travel during the rush hour peak, compared with times when traffic is flowing smoothly.
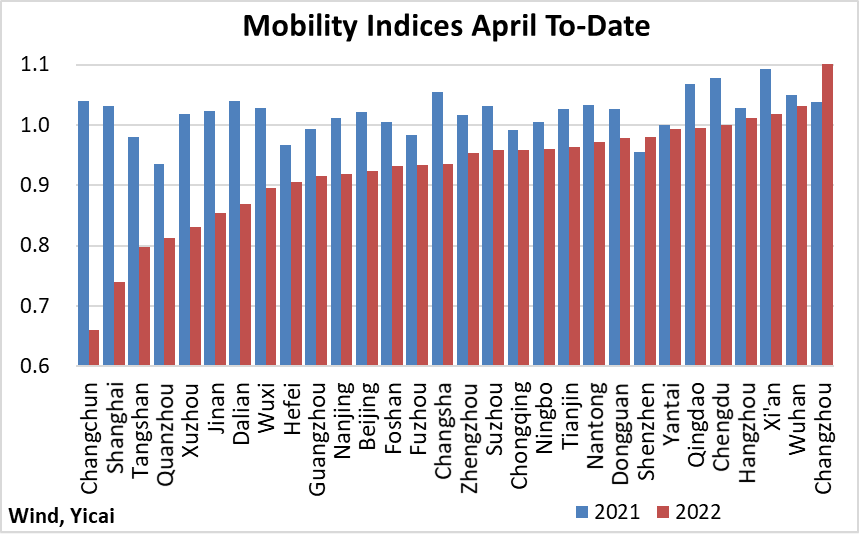
I have taken Amap’s traffic congestion data for China’s 30 largest cities and expressed each of them as a ratio to their 2019 averages. The numbers show that traffic congestion during the first two weeks of April this year was well below what we saw in 2021. On average, across the 30 cities, the index was 0.93, compared to 1.02 last year.
It comes as no surprise that traffic congestion fell the most in Changchun (which is the largest city in Jilin Province) and Shanghai. What is, perhaps, more striking is how widespread the slowdown has been. Of the 30 cities, only in Shenzhen and Changzhou (a city of 5 million in southern Jiangsu Province) is traffic more congested than last year(Figure 2).
Figure 2
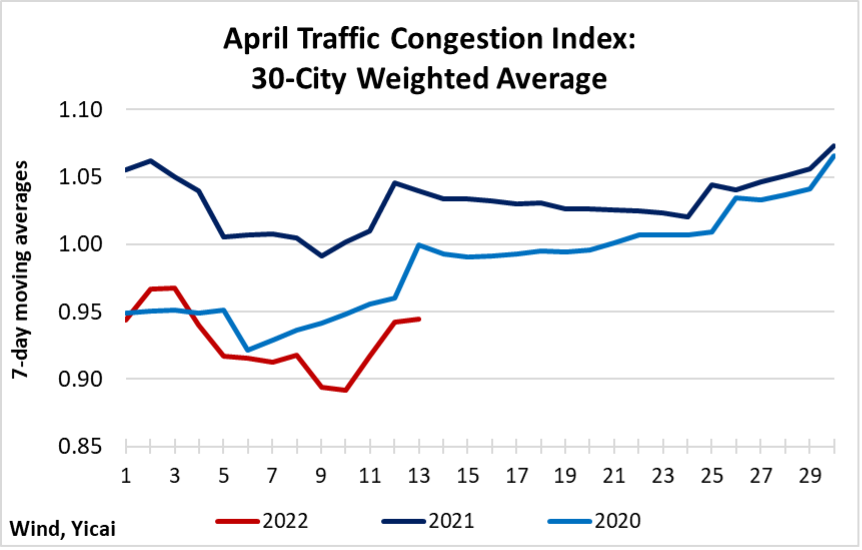
To account for some cities being more economically significant than others, I create an index in which each city’straffic congestion is weighted by its municipal GDP. Figure 3 presents the indices for April 2020-22. The Tomb Sweeping Festival (清明) occurs in April and that’s why there is a decline in traffic congestion in the first third of the month (the data are presented as seven-day averages). While the data for 2022 show a post-holiday pickup, the index remains well below 2021 and 2020 levels. Covid-related restrictions are clearly taking their toll on traffic congestion. However, the weakness in April this year is a far cry from the outbreak in January-March 2020 when the index was below 0.80 for 39 consecutive days.
Figure3
I like Amap’s data because it gives a broad sense of how the economy is evolving and it is not tied to a specific industry or sector. Moreover, because the information is available for a large number of cities, I think it is rather representative of the country as a whole. The data are also timely. I got yesterday’s data today.
I want to lever Amap’s data to get a sense of how strong the economy will be this month. To do that, I will exploit the relationship between the changes in traffic congestion and in GDP that we have seen between 2017 and 2021.
China’s National Bureau of Statistics (NBS) only releases GDP on a quarterly basis. We will get the report on the first quarter’s outturn on Monday. I create a monthly “GDP Indicator” based on the NBS’s monthly industrial value-added and service activity data and an estimate for output in the agricultural sector.
I have created a simple model which predicts the year-over-year change in monthly GDP based on the annual change in traffic congestion and a weighted average of the NBS’s manufacturing and non-manufacturing Purchasing Managers’ Indices.
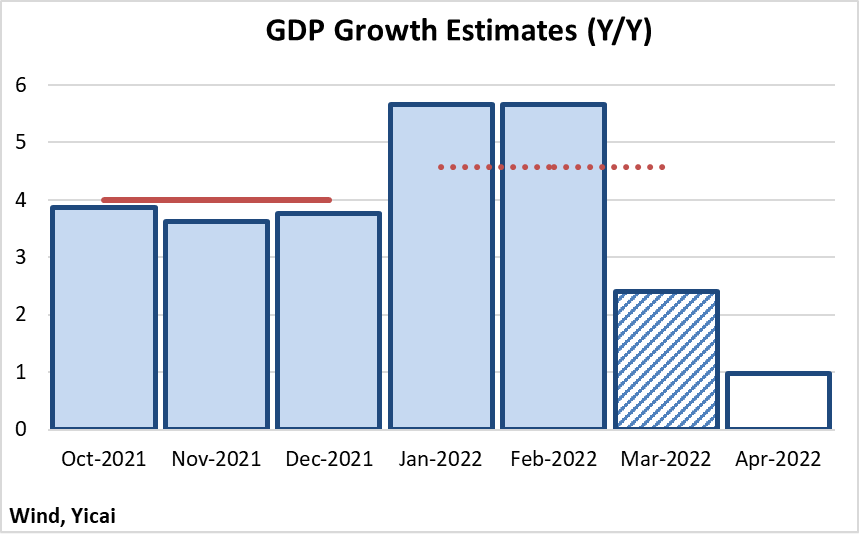
My model suggests that monthly GDP growth will slow from 5.7 percent in January-February to 2.4 percent in March. This will bring growth for the first quarter to 4.6 percent (the red dotted line in Figure 4), which would be a modest improvement over the 4.0 percent recorded in 2021Q4.
So far in April, the traffic congestion data are 9 percent below those of April 2021. If I assume that this gap persists to the end of the month and if the PMIs fall further, then GDP growth in April would slow to between 0-1 percent year-over-year.
Figure 4
My family is pretty much resigned to being locked down until late April. It is easier for us to get food delivered now and a wider variety of choices have become available as logistics have improved. While I am unable to leave my apartment building, I try to stay in shape by walking up and down the stairs. We are getting by.
With the help of its many volunteers, it is entirely possible that, by month-end, Shanghai can sharply reduce the number of infections while preventing their spread to other regions. This would put the economy in an excellent position to begin its rebound in May.
 Mark KrugerBased in Shanghai, Mark Kruger holds Senior Fellow appointments at the Yicai Research Institute, the Centre for International Governance Innovation and University of Alberta’s China Institute. Between 2020 and 2023, Mark was the Opinion Editor at Yicai Global. Previously, he had a 30-year career with the Bank of Canada in the course of which he served as a Senior Advisor to the Canadian Executive Director at the IMF and the head of the Economic and Financial Section of the Canadian Embassy in Beijing.


