


 Is the Chinese Economy Firing on Just One Cylinder?
(Yicai) Oct. 29 -- When economists analyze the National Accounts, they focus on the contributions the components of aggregate demand make to GDP growth. Consumption and investment represent domestic demand, while net exports (exports minus imports) reflect foreign demand. China’s National Bureau of Statistics recently reported that GDP grew by 4.5 percent in the third quarter, up from 4.3 percent in Q2 (Figure 1). Net exports made an outsized contribution during the quarter, accounting for 1.8 percentage points of the total (39 percent).
Figure 1
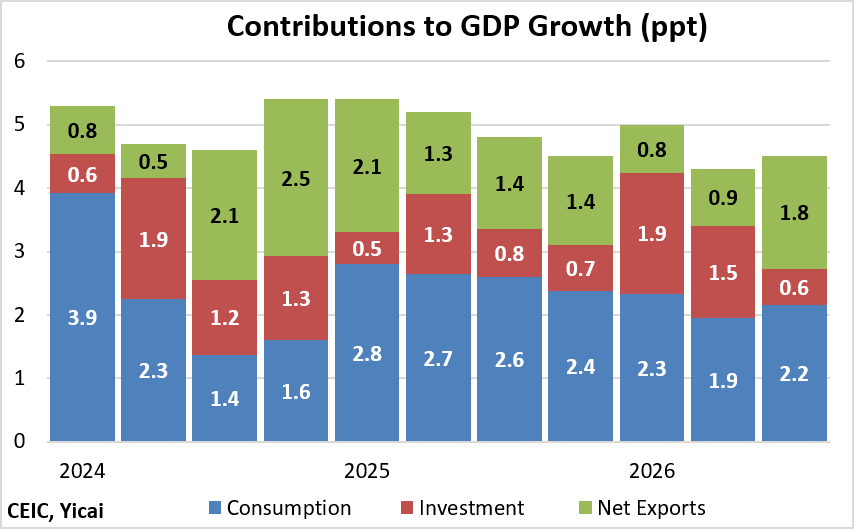
Indeed, as Table 1 shows, the share of GDP growth that has come from net exports has climbed steadily over time.
Table 1
Demand Components’ Shares of GDP Growth
Consumption | Investment | Net Exports | Total | |
| 2026Q3 | 48% | 13% | 39% | 100% |
| 2024Q1-2026Q3 | 48% | 23% | 29% | 100% |
| 2020-2025 | 48% | 33% | 19% | 100% |
| 2010-2019 | 59% | 42% | -2% | 100% |
Source: CEIC, Yicai (totals may not add due to rounding)
A number of forces are restraining domestic demand: the downturn in the property market, a retrenchment of local government finance, the campaign against “involution,” the removal of purchase incentives for new cars, a fiscal stance that has turned contractionary and an income distribution tilting toward higher-saving households.
The decline in fixed asset investment deepened across all components in the third quarter, with the aggregate falling by 7.2 percent in the first three quarters, compared with a 5.7 percent decline in the first half.
Table 2
Fixed Asset Investment Year-to-Date (Y/Y) %
2026Q2 | 2026Q3 | Change | |
| Real estate | -18.0 | -20.6 | -2.6 |
| Manufacturing | -1.2 | -2.1 | -0.9 |
| Infrastructure | -2.4 | -4.2 | -1.8 |
| Total | -5.7 | -7.2 | -1.5 |
| Memo | |||
| Total ex-real estate | -2.7 | -4.2 | -1.5 |
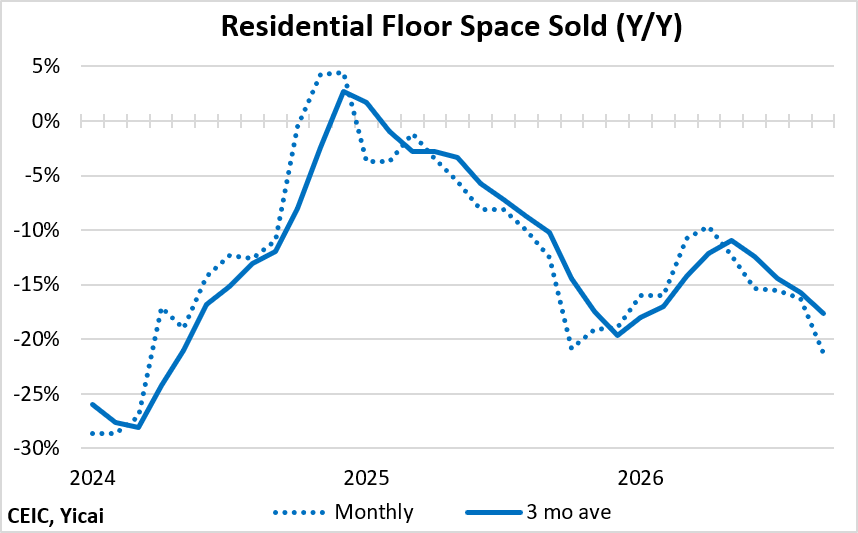
Real estate investment, already very weak, fell further as the property downturn accelerated. The volume of new home sales fell 21.3 percent year-over-year in September, its fastest rate of decline since February 2024 (Figure 2). As a result of weak demand for new housing, investment in real estate fell 20.6 percent in the year to September, more sharply than the 18.0 percent decline in the first half.
Figure 2
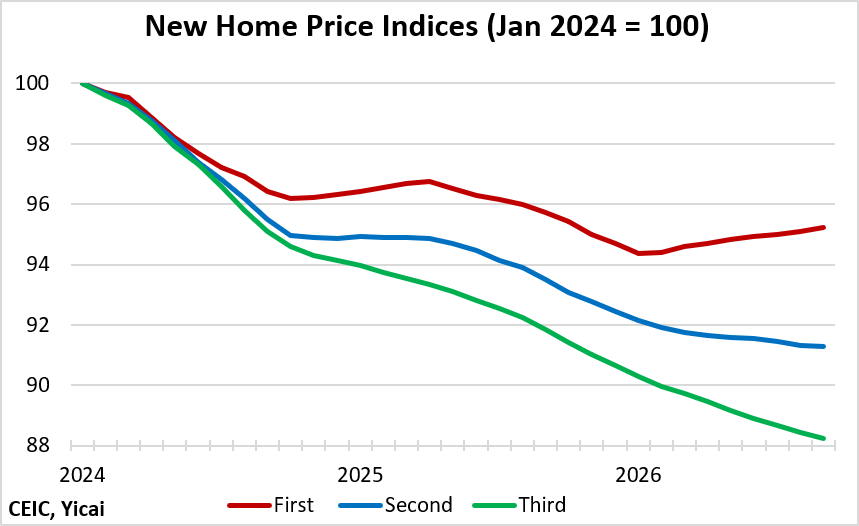
There is some good news in first-tier cities where new home prices appear to have bottomed out. In September, they were about 1 percent higher than in January 2026. Prices in second- and third-tier cities are still falling and were 1 percent and 2 percent below their January levels, respectively (Figure 3).
Figure 3
The property market weakness not only weighs on overall investment spending, it also depresses consumption. It does so directly through a reduced need to furnish new homes and indirectly through the wealth effect – as property prices fall households feel poorer and are less inclined to spend.
The government is eager to put a floor under the market.
The housing reforms announced on August 28 should make the sector safer, but they may take some time to support demand. By shifting sales toward completed homes and ring-fencing each project’s cash flow under a single lead bank, they are designed to safeguard home buyers’ deposits and bring back confidence.
On September 29, the authorities announced a plan to subsidize the mortgage payments of new homes priced CNY 1.5 million or less. The subsidy is 1 percentage point annualized on the loan principal, for up to five years, with eligible principal capped at CNY 1 million per household. This is estimated to reduce mortgage interest costs by about one-third.
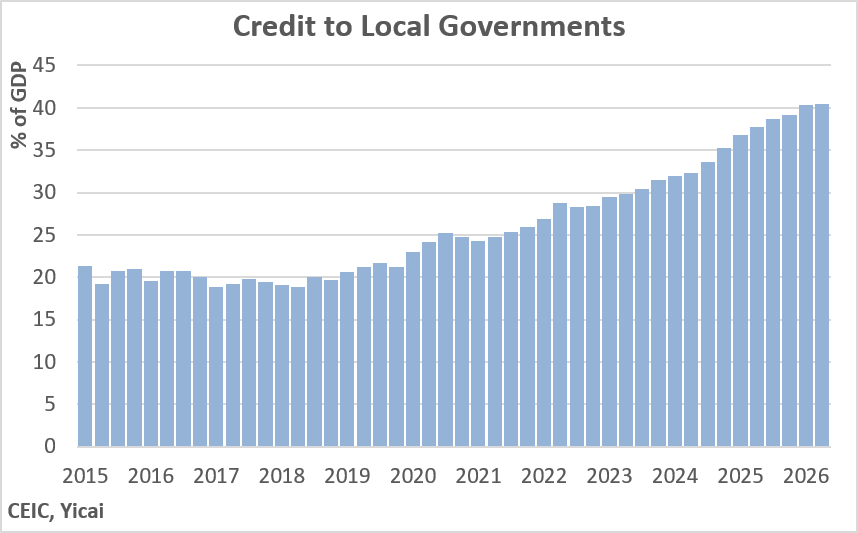
Local governments are under pressure to shore up their finances and this plays a role in the slowing of infrastructure investment. Local government borrowing has expanded rapidly. Before the pandemic, credit to local governments had been stable at some 20 percent of GDP. As at mid-2026, the share was twice as high (Figure 4). Some of this increase represents the recognition of “hidden debt” and is a step forward in fiscal transparency. Even so, falling land sales revenue has led local governments to borrow more. Money that once went into new projects is going to repay debt and clear arrears owed to contractors. Local government austerity is one reason why infrastructure investment fell 4.2 percent in the year to September.
Figure 4
The decline in manufacturing investment is, in part, related to Beijing’s campaign against “involution-style” competition, which has pushed firms toward capacity discipline rather than continued expansion. Manufacturing investment slowed significantly after this campaign began, especially in targeted sectors (steel, coal, cement, photovoltaics, batteries and EVs). So far this year, it is down by 2 percent, compared to a decline of 1 percent in the first half.
Turning to consumption, much of the weakness in retail sales so far this year has been due to falling purchases of cars. Automobiles are a relatively large consumption item, accounting for 5-7 percent of overall retail sales in recent years (Figure 5).
Figure 5
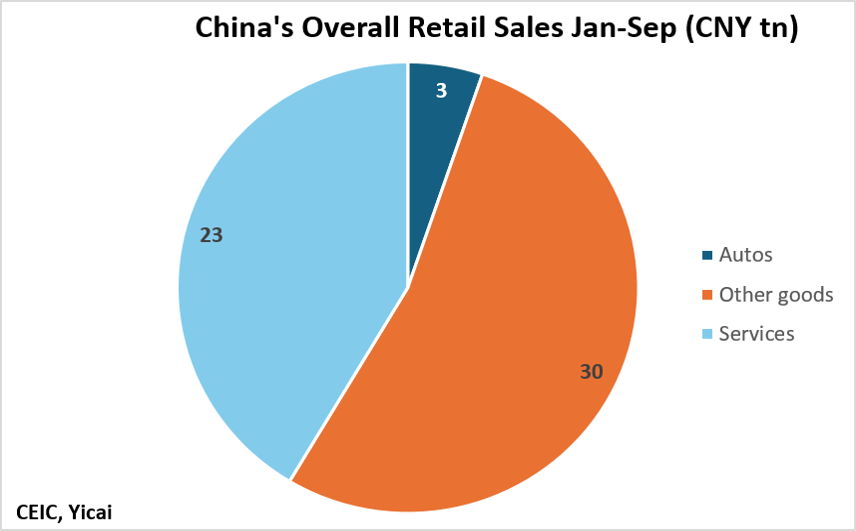
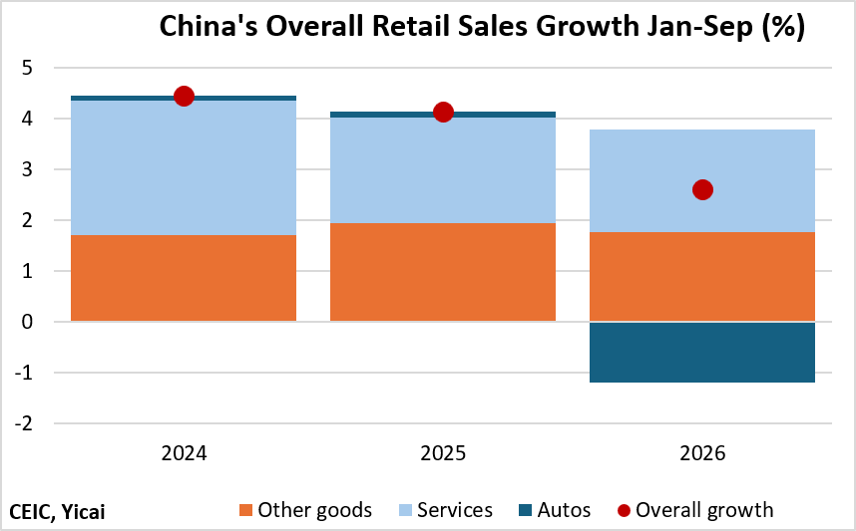
The scaling back of trade-in subsidies and purchase-tax exemptions for new energy vehicles explains much of the 18 percent decline in the value of auto sales so far this year. This sharp fall has had an outsized effect on the growth of overall retail sales (Figure 6). Outside autos, retail spending is growing at close to 4 percent year-over-year, only marginally slower than during the same period in the last two years.
Figure 6
Contractionary fiscal policy has also dampened consumption.
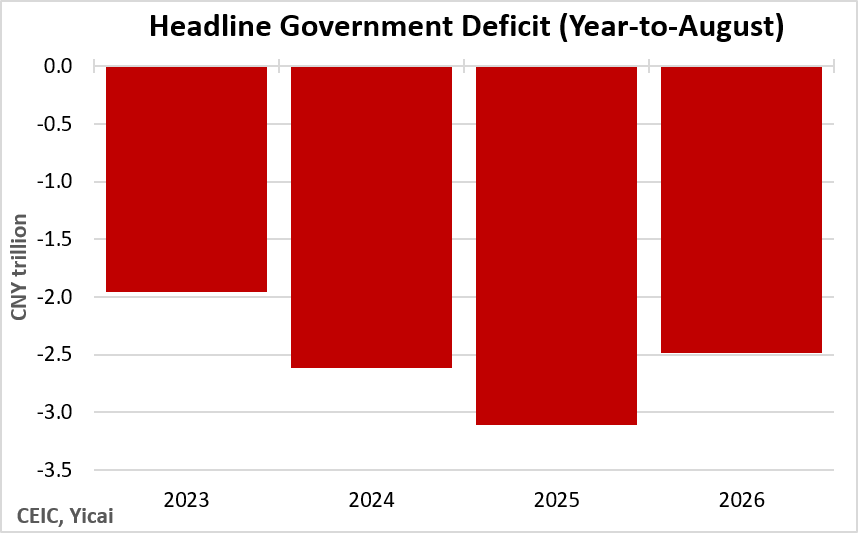
The government budget planned for a deficit of 4 percent of GDP this year, the same as in 2025. In the year-to-August, the deficit was CNY 2.5 trillion, compared with CNY 3.1 trillion a year earlier (Figure 7). The difference, CNY 0.6 trillion, represents a fiscal drag of about 0.7 percent of GDP (at annual rates).
The smaller deficit is the result of expenditure compression. Government revenue has grown by 5.7 percent so far this year, faster than the 4.2 percent budgeted. However, spending is only up 1.2 percent, year-over-year, against a 4.4 percent budgeted increase.
The squeeze is sharpest at the local level, where expenditure is up just 0.3 percent despite revenue growth of 3.1 percent.
Figure 7
Income gains are flowing disproportionately to wealthier households, which also tends to depress consumption.
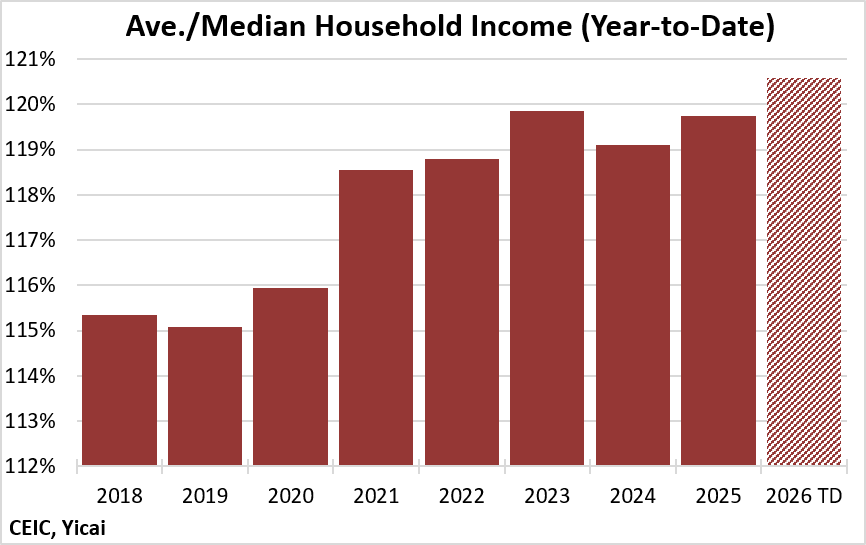
In the first three quarters, average per capita disposable income rose more rapidly (+5.3 percent) than that of the median household (+4.6 percent). As a result, average income rose to nearly 1.21 times the median. This points to a skewing of the income distribution toward wealthier households and the continuation of a recent trend. The ratio had been stable at about 1.15 before the pandemic but jumped in 2021 and has continued to rise since then (Figure 8).
Higher-income households spend a smaller share of each additional yuan earned. An income distribution more skewed toward the wealthy is a contributing factor to the rise in household savings.
Figure 8
Exports and imports both grew by just under 30 percent year-over-year in the third quarter. Much of the strength was due to the AI investment boom and was reflected in a doubling of trade in integrated circuits and computing equipment (Tables 3 and 4). Excluding these products, exports were up by 19 percent, while imports grew by 12 percent.
Table 3
Export Growth 2025Q3—2026Q3
Item | 2026 Q3 | Change | % |
| Electronic integrated circuits | 124 | +70 | +128% |
| Automatic data processing machines & parts | 94 | +41 | +79% |
| Subtotal | 218 | +111 | +104% |
| Other exports | 1,029 | +165 | +19% |
| Total exports | 1,247 | +276 | +28% |
Table 4
Import Growth 2025Q3—2026Q3
Item | 2026 Q3 | Change ($bn) | % |
| Electronic integrated circuits | 201 | +87 | +76% |
| Automatic data processing machines & parts | 69 | +48 | +234% |
| Subtotal | 271 | +136 | +101% |
| Other imports | 611 | +65 | +12% |
| Total imports | 882 | +200 | +29% |
Source: CEIC, Yicai
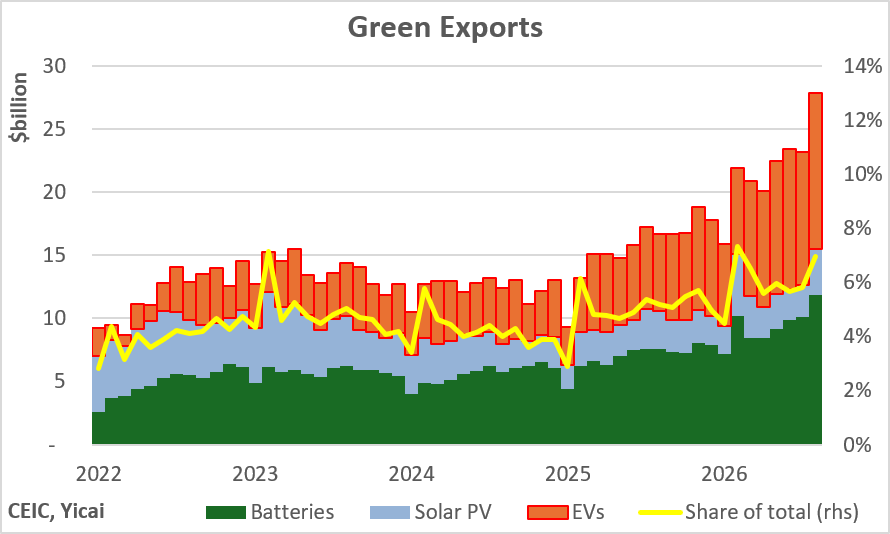
Outside of AI-related products, China’s “green exports” – EVs, solar PV and batteries – continue to be a source of strength, growing by 50 percent year-over-year in the quarter (Figure 9). EV exports in September were double those of a year ago.
The January agreement between Brussels and Beijing allows for the replacement of countervailing duties on battery EVs with minimum import prices, which would raise revenue per vehicle rather than cap volumes. In October, the two sides agreed on a growth profile for Chinese hybrid exports. Together, the arrangements reduce the threat of new EU tariffs on hybrids and offer a route out of existing duties on EVs, so exports to Europe look set to keep rising.
Figure 9
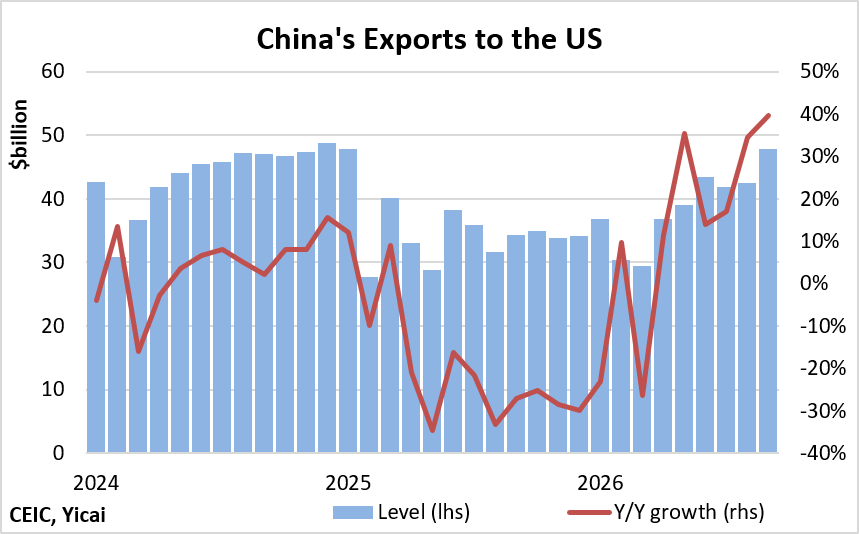
China’s exports to the US grew 30 percent year-over-year in Q3. This was twice as fast as those to the EU. In September, exports to the US reached their highest level since December 2024 (Figure 10). This rebound reflected the elimination of the International Emergency Economic Powers Act (Liberation Day) tariffs in February, which had been particularly onerous for China. They were replaced by a series of new duties, which were lower overall and discriminated less against Chinese products. The revised tariffs made China’s exports relatively less expensive in the US market.
Figure 10
There are reasons to be optimistic about the economy’s prospects to year-end.
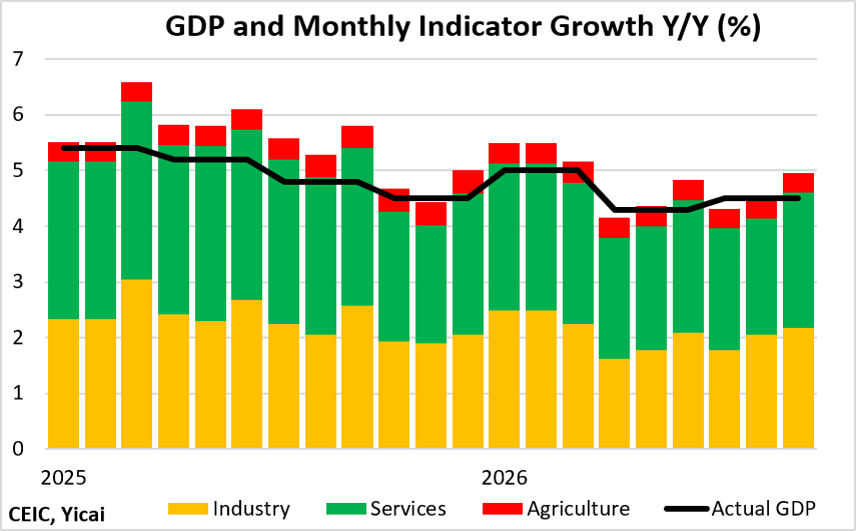
First, the monthly data suggest that momentum increased through the quarter. Our monthly GDP indicator reached its highest level since March (Figure 11).
Figure 11
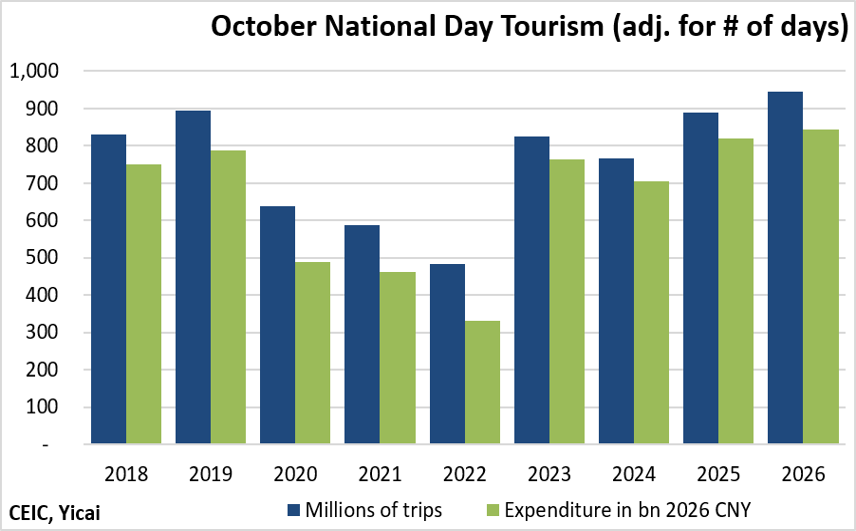
Second, tourism activity during the October National Day increased modestly. Adjusting for the number of days off, person-trips increased by 6 percent and spending rose by 3 percent in real terms, both reaching new highs (Figure 12).
Figure 12
Third, we expect the government to achieve its 4 percent deficit this year, which means that we should see significant fiscal support in the fourth quarter that will boost domestic demand.
Growth in the first three quarters was 4.6 percent and it seems likely that the economy will achieve its target of growing between 4.5 and 5.0 percent this year.
So, is the Chinese economy running on just one cylinder?
Not entirely, but one cylinder is doing far more than its share of the work. In the third quarter, net exports contributed nearly as much to growth as consumption, and investment barely helped. The danger is that a growing trade surplus provokes a protectionist backlash that shuts down the net export cylinder and leaves the economy sputtering.
Thankfully, that risk has receded over the past few months. Relations with Washington are the warmest in years. At President Xi’s state visit in September, the trade truce was extended to January 2027. Moreover, a Board of Trade was created to explore reciprocal tariff cuts. The US and China also agreed to set up an AI safety channel and improve military crisis communications. Two more meetings between Presidents Trump and Xi are planned before year-end.
Beijing and Brussels have likewise reached understandings on EVs and hybrids, and China has agreed to fast-track export licences for rare earths and permanent magnets.
While the geoeconomic picture remains fluid, here too, the momentum is positive.
 Mark KrugerBased in Shanghai, Mark Kruger holds Senior Fellow appointments at the Yicai Research Institute, the Centre for International Governance Innovation and University of Alberta’s China Institute. Between 2020 and 2023, Mark was the Opinion Editor at Yicai Global. Previously, he had a 30-year career with the Bank of Canada in the course of which he served as a Senior Advisor to the Canadian Executive Director at the IMF and the head of the Economic and Financial Section of the Canadian Embassy in Beijing.