 Recovery Continues Despite Consumers' Caution
(Yicai Global) Oct. 23 -- On October 19, China’s National Bureau of Statistics (NBS) the National Accounts for the third quarter of 2020. At 4.9 percent year-over-year, growth was a marked improvement on the 3.2 percent recorded in Q2. Yet, it remained just over a percentage point slower than in 2019.
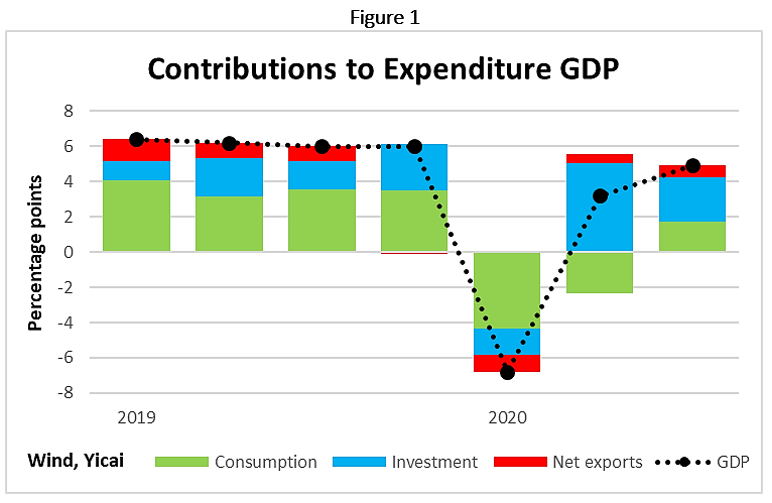
The glass-half-full, glass-half-empty state of the economy is summarized in Figure 1. It shows that consumption dynamics are the key to understanding the evolution of the economy this year.
In the third quarter, consumption contributed 1.7 percentage points to GDP growth. Consumption had been a significant drag on growth in the two previous quarters, so this turnaround means the recovery is becoming more sustainable. Nevertheless, consumption’s contribution in Q3 was only half as large as in 2019 and this weakness explains why growth in the quarter remained below the rates we saw last year.
To decipher consumption’s behavior, we need to understand what is happening in China’s labour markets. Let’s begin with the migrant workers. This group is important because the migrants are very sensitive to changes in economic conditions. They are often the first let go in bad times and the first hired during booms.
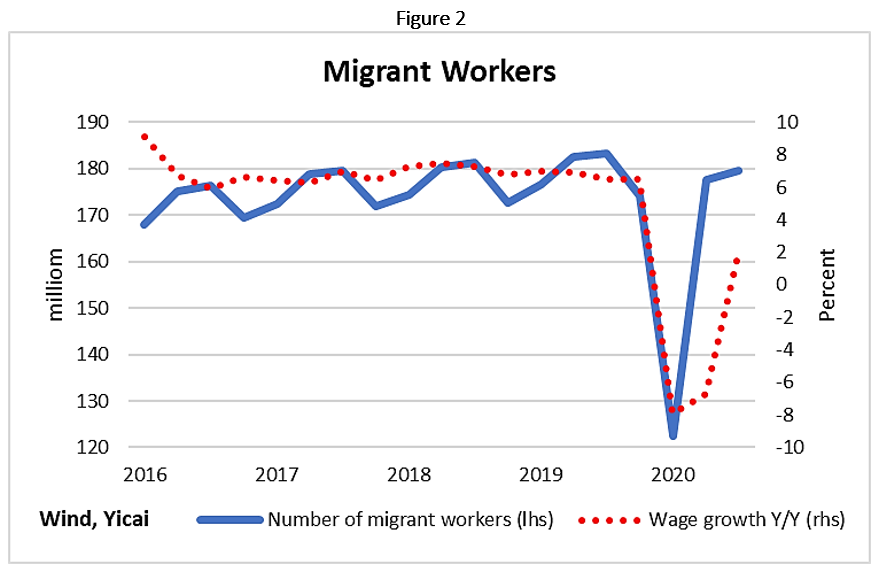
Figure 2 shows that the number of migrant workers has largely recovered following a 30 percent year-over-year drop in Q1. In the third quarter, the number of migrant workers was down 1 percent from last year’s level. The number of migrants has been increasing by about 1 percent per year in recent years, so the “migrant worker gap” is about 2 percent.
The weak demand for migrant workers is reflected in low wage growth. Migrants’ wages grew by 2 percent year-over-year in Q3, down appreciably from the 6-7 percent growth we saw between 2016 and 2019. Fewer migrant workers with lower wage growth is one of the factors weighing on consumption.
Let’s turn to the formal urban labour market. So far this year, close to 9 million new jobs were created, essentially meeting the target the government set during the National People’s Congress in May. Nevertheless, job creation over the first 9 months is about 20 percent below recent years’ experience. This suggests that there is a significant gap in the formal urban labour market as well.
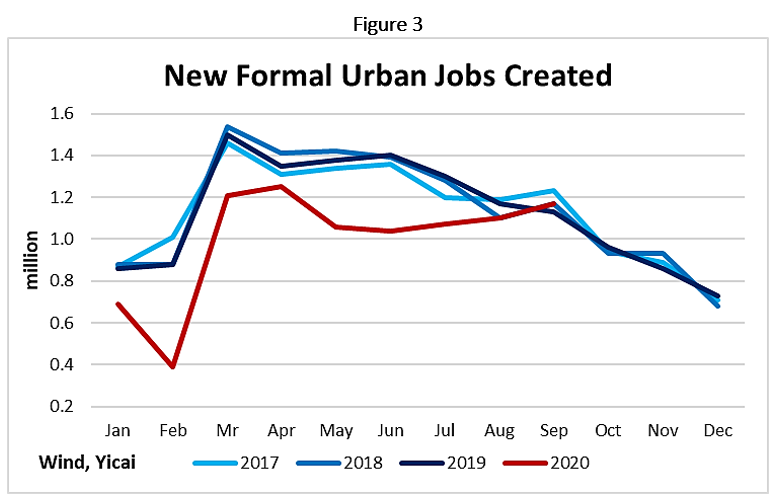
Figure 3 shows the monthly pace of job creation and suggests that the worst is behind us. The amount of jobs created in September was on par with what we have seen in the past. If the momentum in the economy holds up, job creation in the fourth quarter could exceed past trends. This would reduce the labour market gap and support consumption.
The data paint a picture of a labour market which has recovered from the devastation in Q1, but which is not yet back to normal. These labour market developments have had a deep impact on personal income and expenditure.
With still sizable labour market gaps, it is not surprising that real income growth in Q3 remains sluggish. Figure 4 shows that, adjusted for inflation, national per capita disposable incomes grew by 4.4 percent in Q3, compared to 6.5 percent over 2016-19. Incomes had fallen by close to 4 percent in Q1.
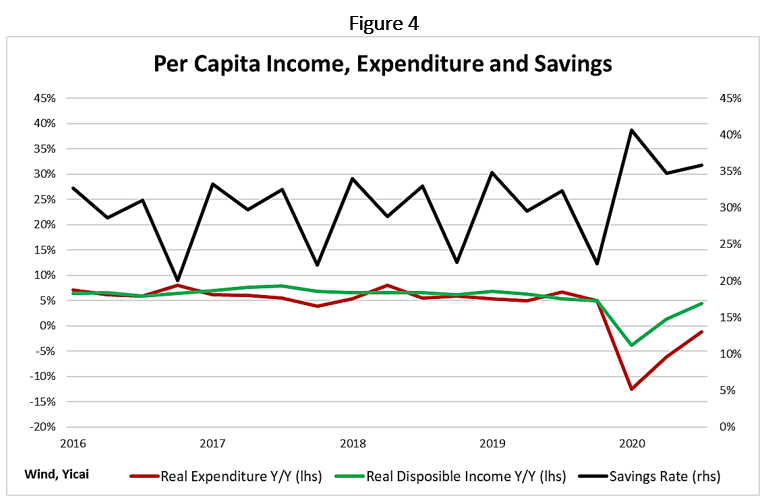
Figure 4 also shows that real incomes and real expenditures typically track each other fairly well. However, this year they decoupled. Real per capita expenditures were down 1 percent in the third quarter. While this was an improvement on the 13 percent decline in Q1, it is a far cry from the 6 percent growth we saw over 2016-19.
This year, personal expenditures were hit by a double whammy. First, they suffered from below trend income growth. Next, the unprecedented uncertainty about the shape of the recovery led households to become more cautious and increase their savings. Figure 4 shows that the savings rate this year has averaged 37 percent. This is 5 percentage points higher than the January-September average over 2016-19.
The weakness in personal spending is rather straightforward, given what is happening in the labour markets. The mystery is how consumption could have made a positive contribution to growth in Q3, given the contraction in real per capita expenditures.
The answer may lie in the definition of “consumption”. Chinese statisticians include both current household and government expenditures in the “consumption” category. In 2019, households accounted for 70 percent of consumption, while governments spent the remaining 30 percent.
The fiscal accounts for Q3 show an acceleration in government spending to 7 percent year-over-year from -6 percent in Q2. About 70 percent of these expenses are typically considered consumption on a National Accounts basis. Thus, it is likely that government spending offset a portion of the weakness of household expenditures.
With the Q3 National Accounts in the books, the question on everyone’s mind is: what will Q4 look like? So far, the information we have points in opposite directions.
The NBS that consumption during the Golden Week that followed the October 1 National Day celebrations was not especially strong. Tourist travel was only 80 percent of last year’s level and spending on retail and catering was only up 5 percent in nominal terms.
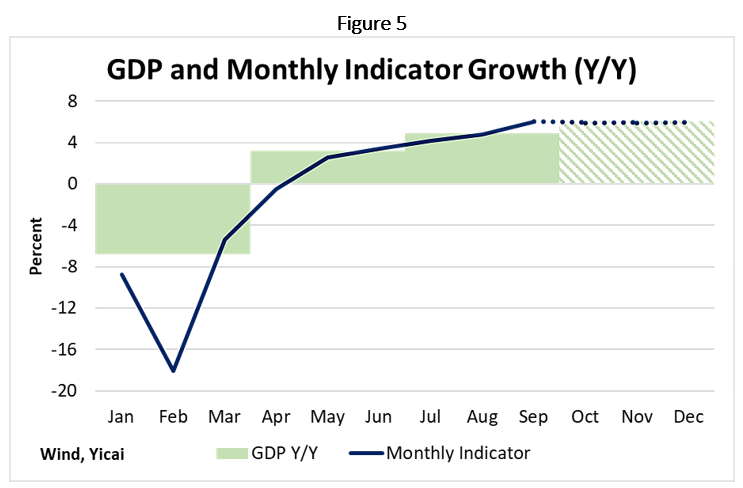
However, economic activity, as measured by our Monthly Indicator, accelerated significantly in September, as a result of very strong growth in Industrial Value Added (Figure 5). September’s level of activity could be maintained to year-end, as the composition of output gently rotates from industry to services. This would bring Q4 growth to 6 percent.
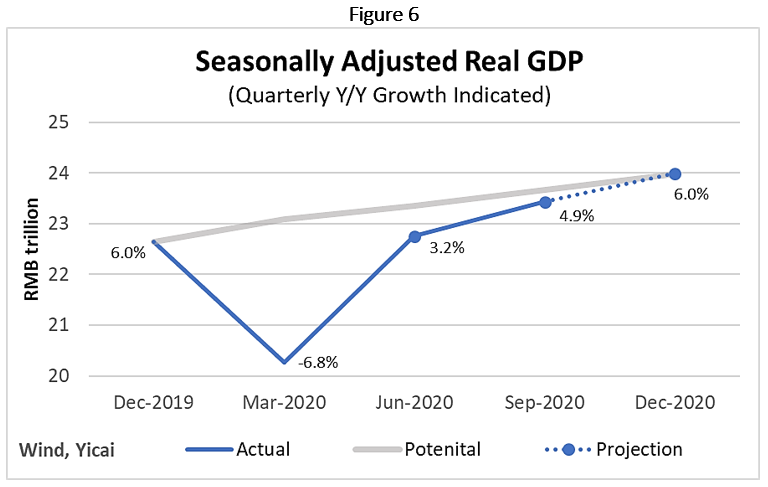
Should the economy evolve as our projection suggests, the recovery would be complete. The difference between potential output – how much the economy could produce if it were at full capacity – and actual output would narrow from 1 percent in Q3 to 0 at the end of the year (Figure 6).
GDP growth for the year as a whole would be 1.9 percent. Both the and People’s Bank have also suggested growth this year will be around 2 percent – and that’s good company for a forecaster to be in.
 Mark KrugerBased in Shanghai, Mark Kruger holds Senior Fellow appointments at the Yicai Research Institute, the Centre for International Governance Innovation and University of Alberta’s China Institute. Between 2020 and 2023, Mark was the Opinion Editor at Yicai Global. Previously, he had a 30-year career with the Bank of Canada in the course of which he served as a Senior Advisor to the Canadian Executive Director at the IMF and the head of the Economic and Financial Section of the Canadian Embassy in Beijing.


