 The Year Ahead for the Chinese Economy
(Yicai) Jan. 28 -- The National Bureau of Statistics (NBS) recently reported that the Chinese economy reached its target of 5 percent growth in 2025. This was no mean feat, given that US tariffs on Chinese imports rose from 19 to 48 percent and that the domestic property market continued to undergo a significant correction.
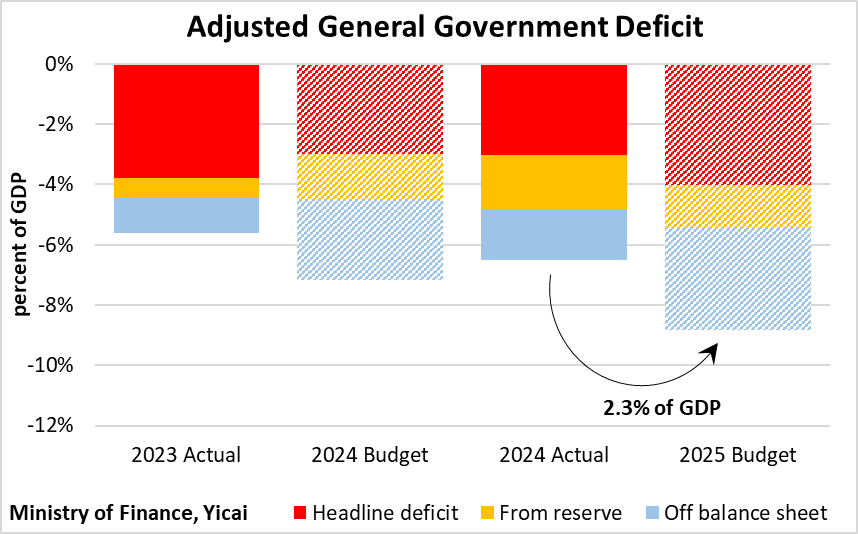
China’s resilience was due, in large part, to substantial fiscal stimulus. According to the budget document, the adjusted general government deficit would increase by 2.3 percent of GDP from the actual outturn in 2024 (Figure 1).
Figure 1
Looking ahead, the big difference between where China stands now, compared to a year ago, is the more favourable geopolitical environment.
Due to the capriciousness of US trade policy, world leaders are renewing their ties with China. So far this month, Beijing has hosted Lee Jae Myung (the first South Korean President to visit since 2019) and Mark Carney (the first Canadian Prime Minister since 2017). Later this month, Keir Starmer will make the first visit by a British Prime Minister since 2018. And German Chancellor Fredrich Mertz is planning a trip to China this spring as well.
As a result of these visits, we can expect bilateral disputes to be resolved and trade and investment to be facilitated. Warmer relations with the rest of the world should boost confidence both in China and abroad.
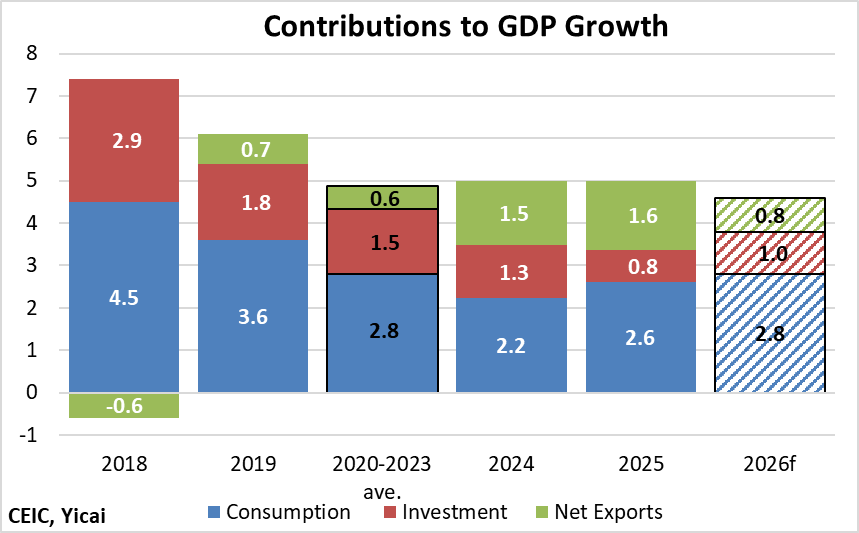
Looking at the macroeconomic data for 2025, we see that the sources of growth were highly unusual, with net exports making a very large contribution and investment quite a small one. While 2025 resembled 2024 in this regard, over 2010-23, net exports’ average contribution was zero, while investment accounted for 40 percent of China’s GDP growth.
The IMF’s Managing Director, Kristalina Georgieva, doesn’t think it is sustainable for China to rely on net exports as a significant source of growth. In her view, “As the second largest economy in the world, China is simply too big to generate much growth from exports and continuing to depend on export-led growth risks furthering global trade tensions.”
I disagree with Ms. Georgieva. Since Chinese exporters are selling in a broader array of markets and continue to upgrade the quality of their products, I believe China’s export growth will remain robust for years.
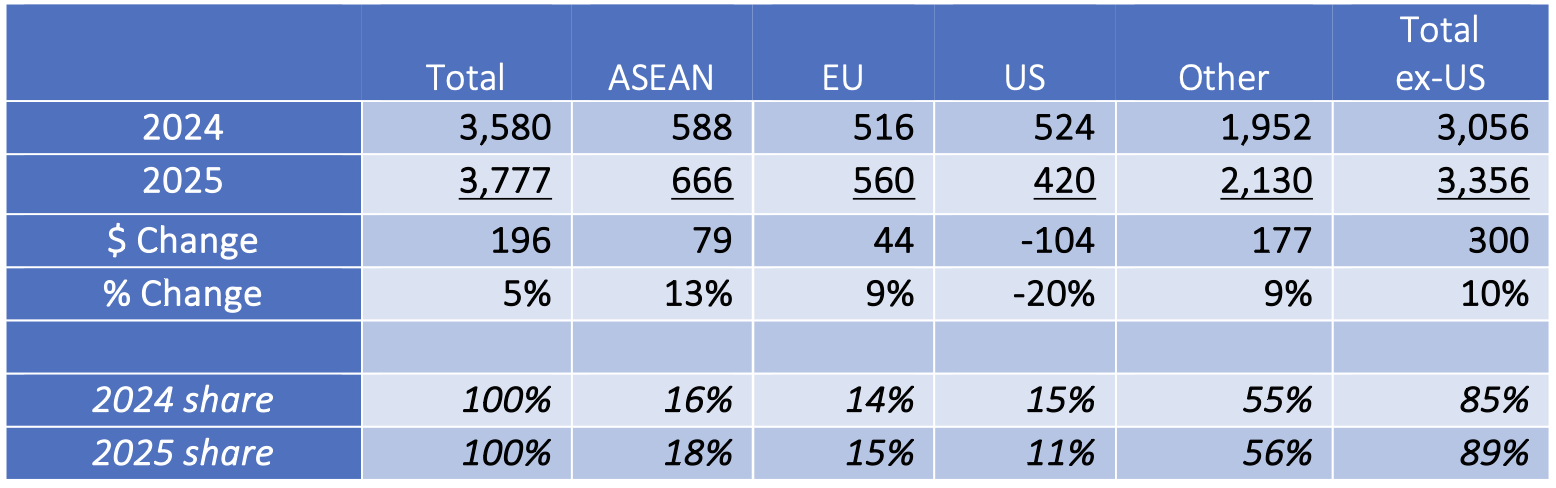
For example, China’s exporters showed surprising resilience in the face of the massive increase in the US’s tariffs. While China sells more to the US than to any other single country, the vast majority of China’s sales go to other markets. China was able to more than offset the 20 percent drop in sales to the US by increasing exports to all other markets by 10 percent.
Table 1
China’s Exports by Destination ($billion)
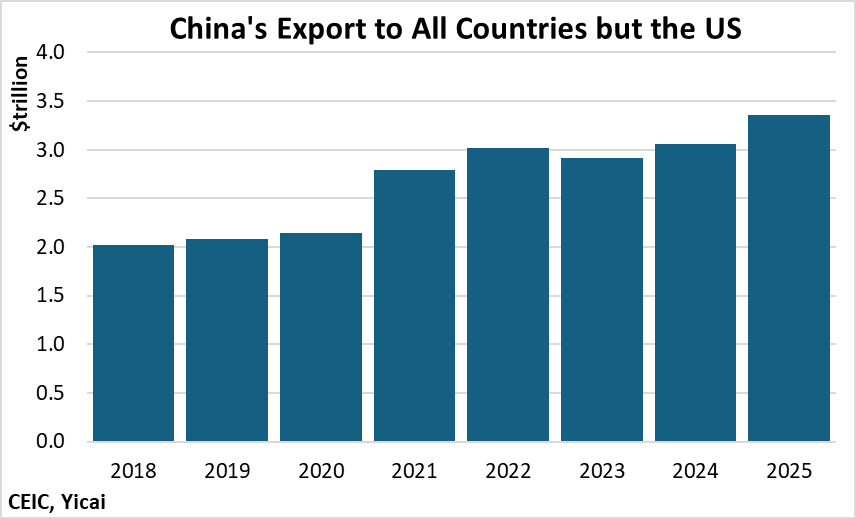
It does not seem that countries other than the US have become saturated with Chinese goods. Between 2018 and 2024, China’s exports to these countries rose by 7 percent per year. Last year, they rose by 10 percent (Figure 2).
Figure 2
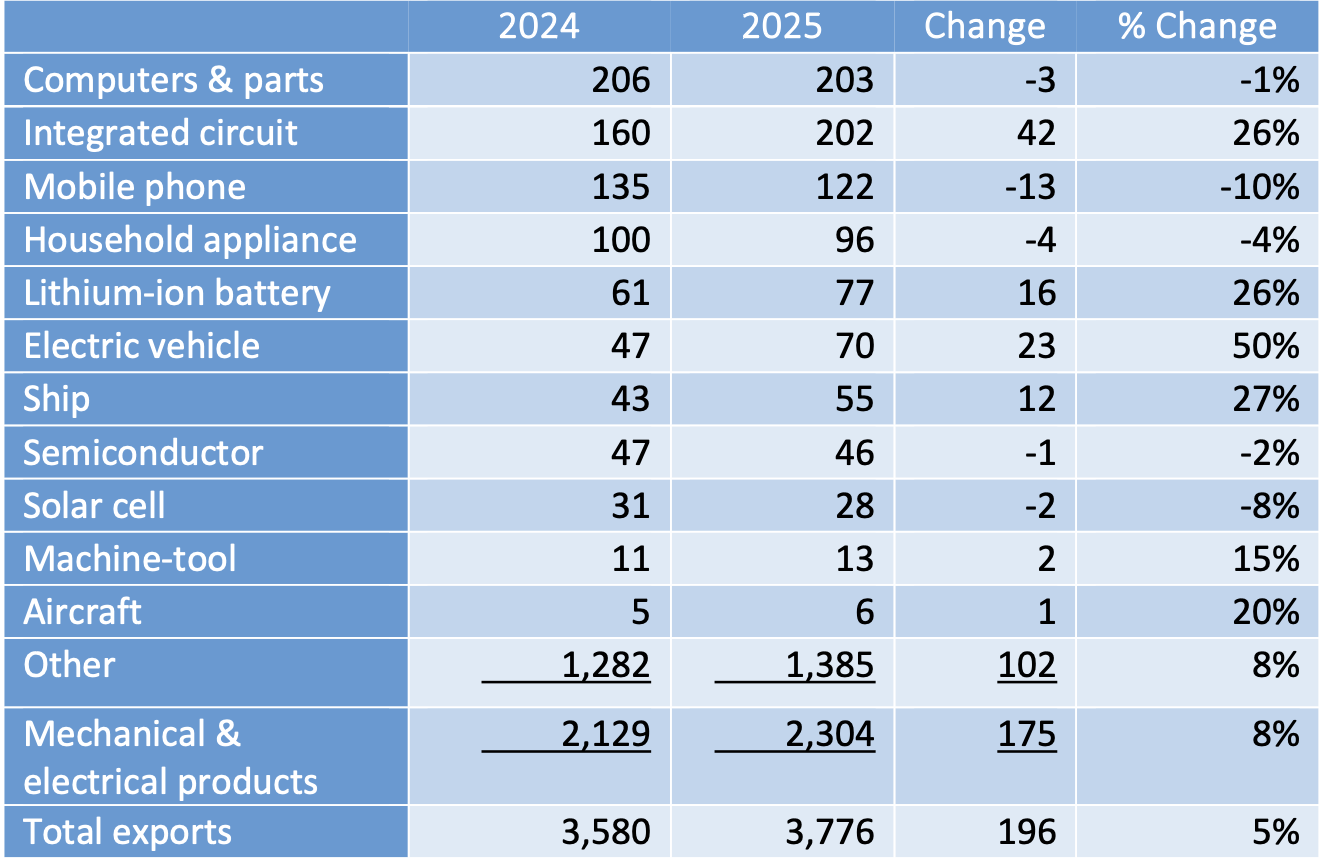
Moreover, China’s product array keeps changing. Because of its manufacturing prowess, China’s exports can pivot in respect to changing demand patterns. For example, in 2025, demand for consumer goods – mobile phones, computers and household appliances – was weak and sales of these products fell (Table 2). But the demand for producer goods – integrated circuits and lithium ion batteries –
was strong. In addition, exports of electric vehicles (EV) and ships rose rapidly.
Table 2
Mechanical and Electrical Product Exports ($billion)
Taking EVs as an example, it seems that the medium-term prospects are good for Chinese exporters. Industry experts see plenty of room for China’s EV exports to grow, potentially doubling between 2024 and 2030. China is also working to diffuse protectionist pressures in these markets. It is negotiating a framework with the EU to set minimum prices for EVs so as to avoid paying tariffs. And its carmakers are increasingly constructing auto plants in foreign countries, providing knowledge transfer and employment.
Given the competitiveness of China’s manufacturing sector, I believe that net exports will make a positive, albeit somewhat smaller, contribution to growth in 2026.
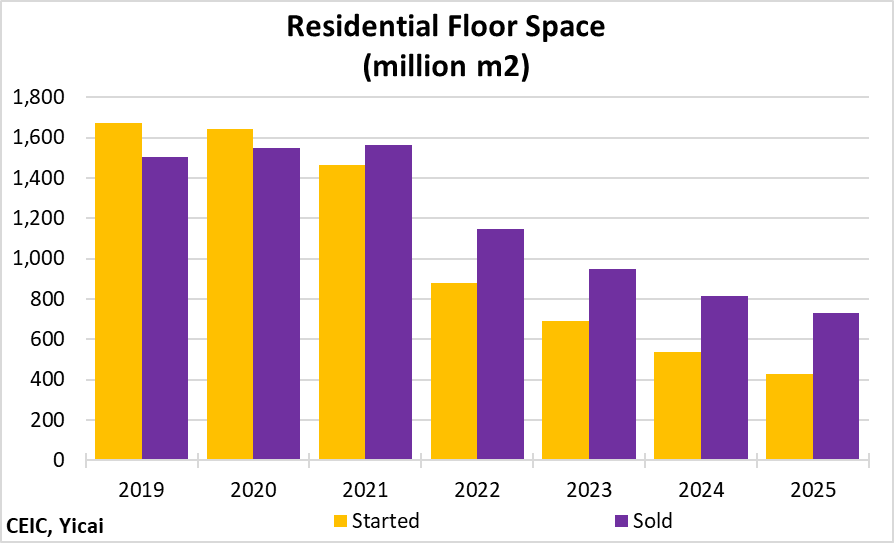
The correction in the housing market shows no sign of bottoming out. In 2025, the volume of residential floor space sold fell by 10 percent to 733 million square meters. This is less than half the amount sold, on average, in 2019-21 (Figure 3). The correction in the volume of housing starts was even more precipitous, down 20 percent year-over-year. At 430 million square meters, starts last year were only 27 percent of the 2019-21 average.
Figure 3
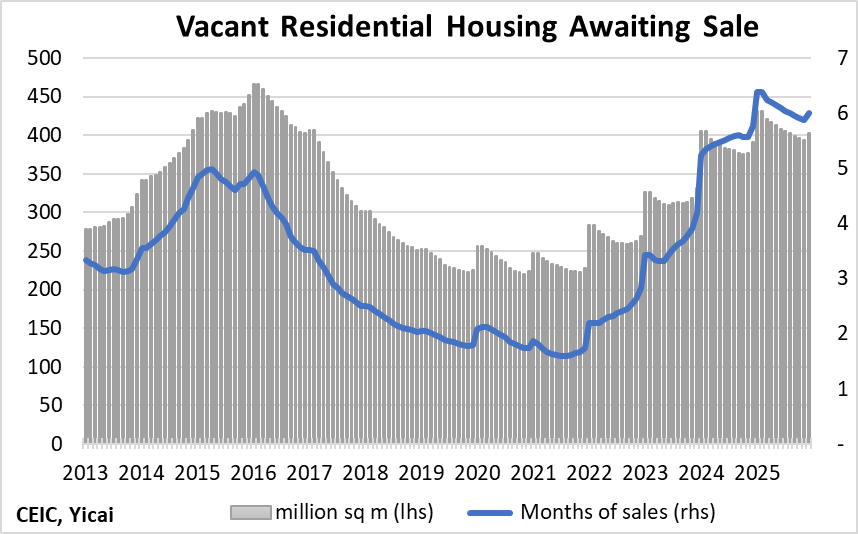
It is hard to envision the market turning around this year. Inventories of vacant housing waiting to be sold remain elevated. At 6 months of sales, they are twice as high as their 2012-2023 average (Figure 4).
Figure 4
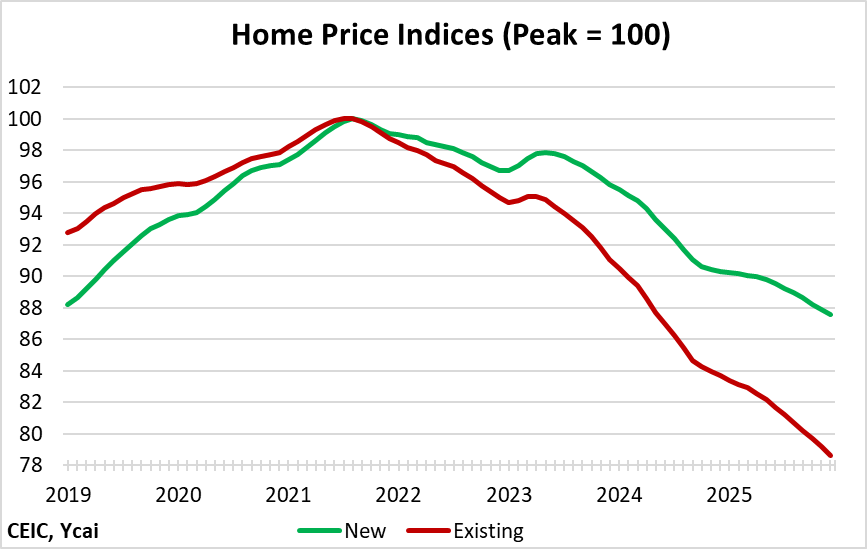
These high inventories are putting downward pressure on home prices. New and existing home prices fell by 3 and 6 percent, respectively, in 2025. Since their peak in mid-2021, new home prices have fallen by 12 percent while existing home prices are down 21 percent (Figure 5).
Figure 5
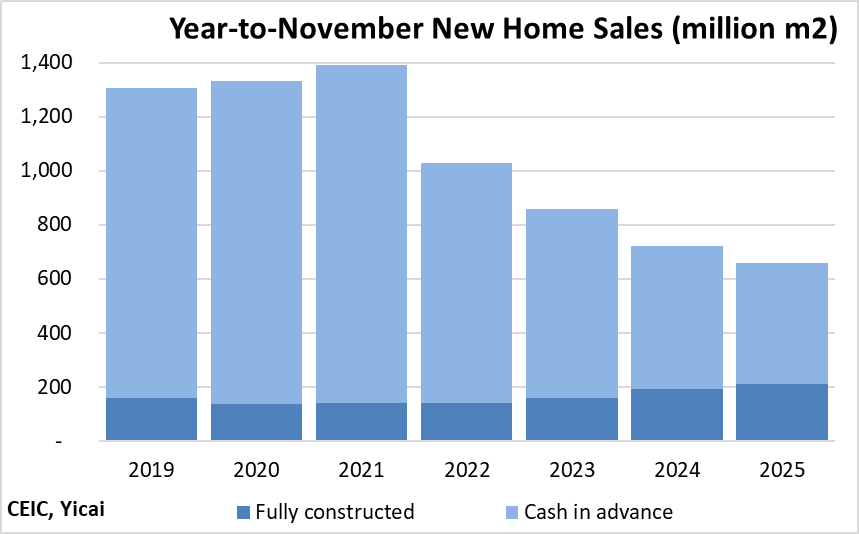
With many of its largest property developers facing financial difficulty, prospective home buyers have lost faith in China’s cash-in-advance model, in which developers receive the full value of the new home before construction begins. Indeed, buyers are showing an increased preference to purchase fully constructed homes. Last year, the purchase of fully constructed homes accounted for a third of all sales, up from 10 percent in 2021 (Figure 6). To revive confidence in the market, the government could enhance the oversight of its escrow accounts. Recent research suggests that better monitoring could significantly reduce the incidence of unfinished building projects and the loss of buyer funds.
Figure 6
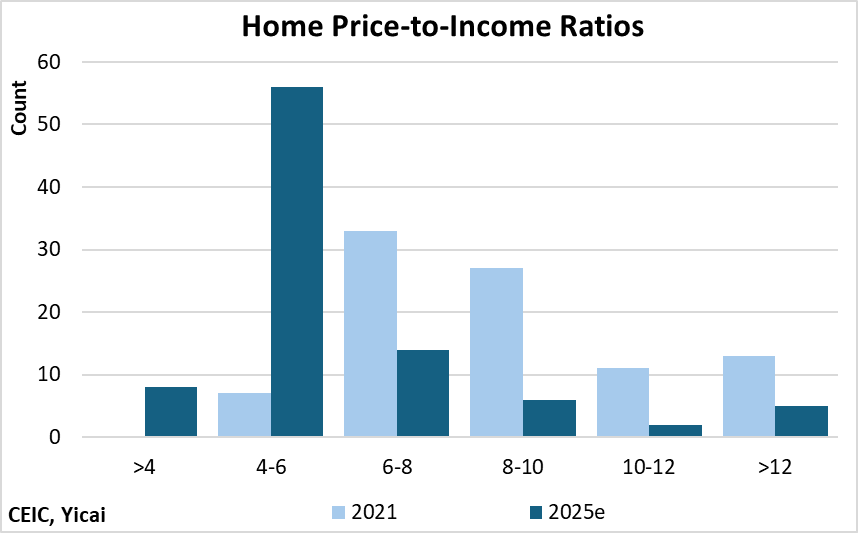
There is a silver lining to the correction in the property market: housing has become more affordable. Looking across 91 cities, the median home-price-to-household income ratio fell from 8.6 in 2021 to 5.3 in 2025 (Figure 7). While there still are 7 Chinese cities in which the price-to-household income-ratio exceeds 10, that’s down from 24 cities in 2021.
While the fall in home prices has eroded the wealth of Chinese households, more affordable housing reduces a source of financial pressure for those entering the housing market and could help boost sales in the future.
Figure 7
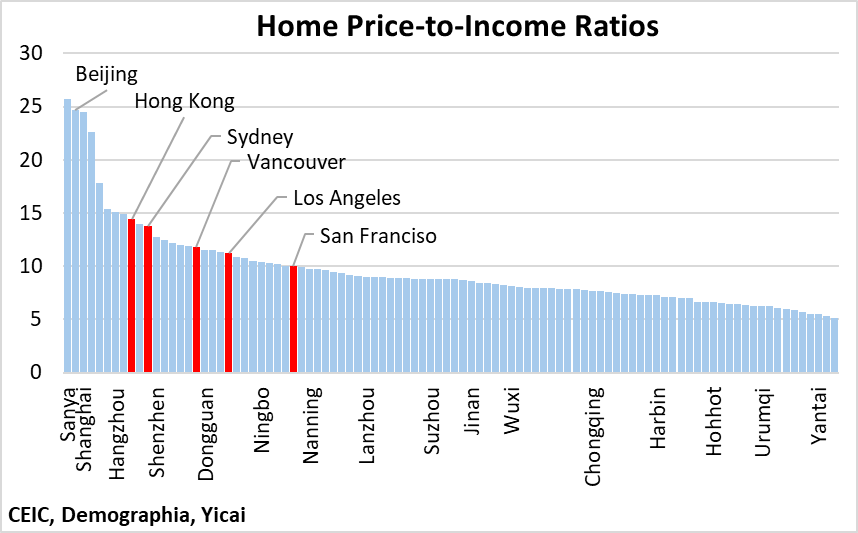
Even though home prices have fallen significantly, the cost of owning a home in China is very high. There are 8 Chinese cities in which the home price-to-income ratio is higher than Hong Kong, which is known for its expensive housing (Figure 8). And in 24 of the 91 Chinese cities, the price-to-income ratio is higher than San Francisco’s.
Figure 8
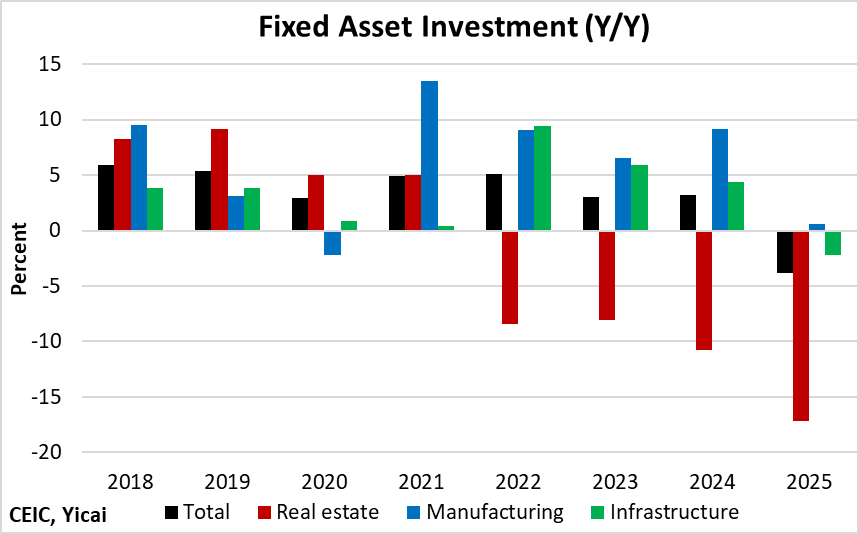
The weak housing market is a major contributor to the fall in fixed asset investment. Investment in real estate fell for the fourth consecutive year, with last year’s fall being the steepest (Figure 9).
In previous years, weak housing investment had been more than offset by robust investment in manufacturing and infrastructure. In 2025, however, the authorities emphasized the prevention of financial risk and prioritized the proceeds of local bond sales being used to reduce indebtedness. This left less funding available for infrastructure investment.
In addition, the authorities became increasingly concerned about destructive competition (内卷) last year, and they discouraged firms from undertaking investments in a number of over-capacity industries. These policies depressed manufacturing investment.
Figure 9
Policies to both increase the soundness of local government finances and prevent destructive competition are likely to continue through 2026. This means that none of the three investment sectors is likely to experience strong growth.
The good news is that even as fixed asset investment shrank (in nominal terms), industrial value added grew at 6 percent (in real terms), suggesting that China has more than enough capacity to sustain robust factory output.
Consumption remains China’s primary growth driver, accounting for more than half the growth in GDP in 2025. I estimate that consumption grew by 4.6 percent in 2025, up from 3.9 percent in 2024, but still somewhat below the 5 percent recorded over 2020-23.
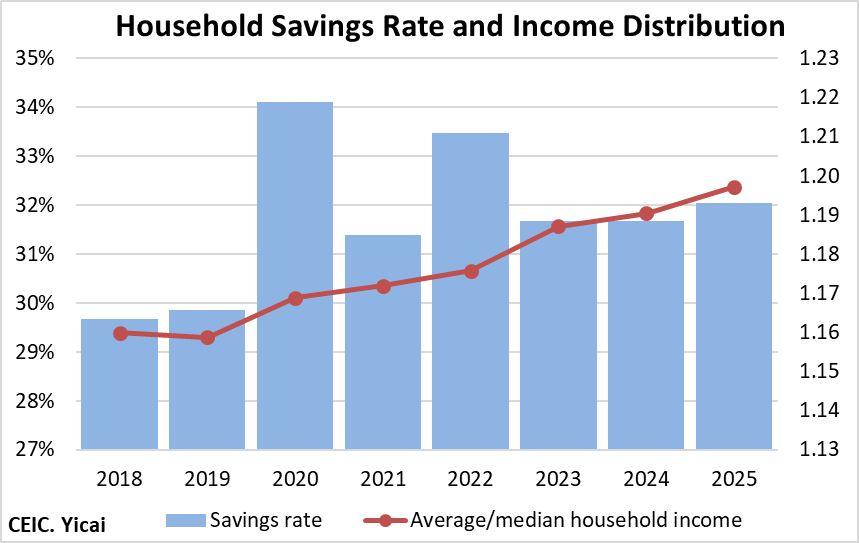
It is notable that savings rates ticked up last year and remain well above pre-pandemic levels. Households’ increased propensity to save could reflect their ongoing caution toward the economic outlook. It could also be collateral damage from the downturn in the property market. It is also possible that it could reflect a worsening of the income distribution. Figure 10 plots the ratio of average to median household income against household savings rates. When the average rises relative to the median, the income distribution is becoming increasingly unequal, with more going to the already better off. Since high-income households tend to save more, the more skewed distribution could explain some of the trend increase in savings rates.
Figure 10
My estimate for consumption growth is somewhat higher than that of retail sales, which grew by 3.7 percent in 2025. My estimate includes the consumption of services, which rose by 5.5 percent in 2025 and which are not fully captured in the retail sales data. According to NBS Director Kang Yi, services now account for 46 percent of household consumption.
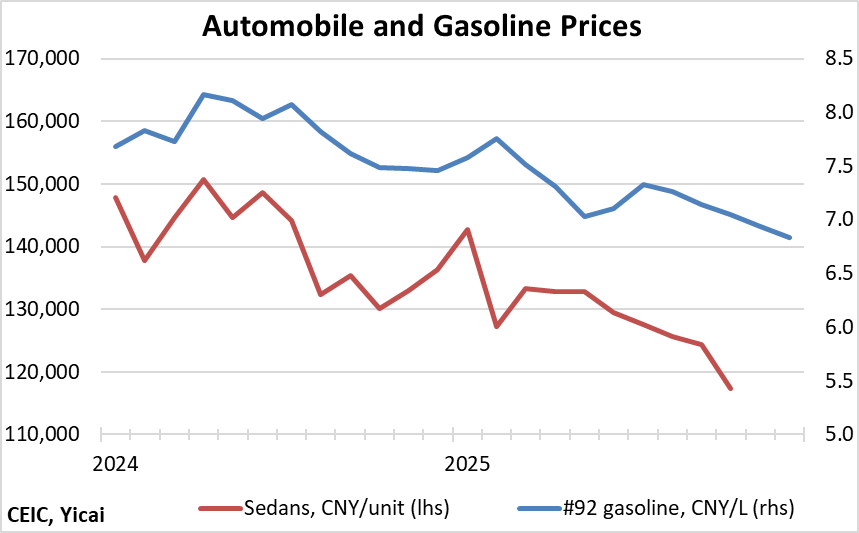
It should also be emphasized that retail sales are measured in nominal terms and they give a distorted picture of consumption when there are large price movements. Table 3 shows that retail sales of automobiles and petroleum, two large consumption categories, fell in 2025. But this decline seems to be entirely due to lower prices (Figure 11). In price-adjusted terms, consumption of automobiles and petroleum likely increased by 6 and 1 percent, respectively.
Table 3
Sales in Large Retail Establishments
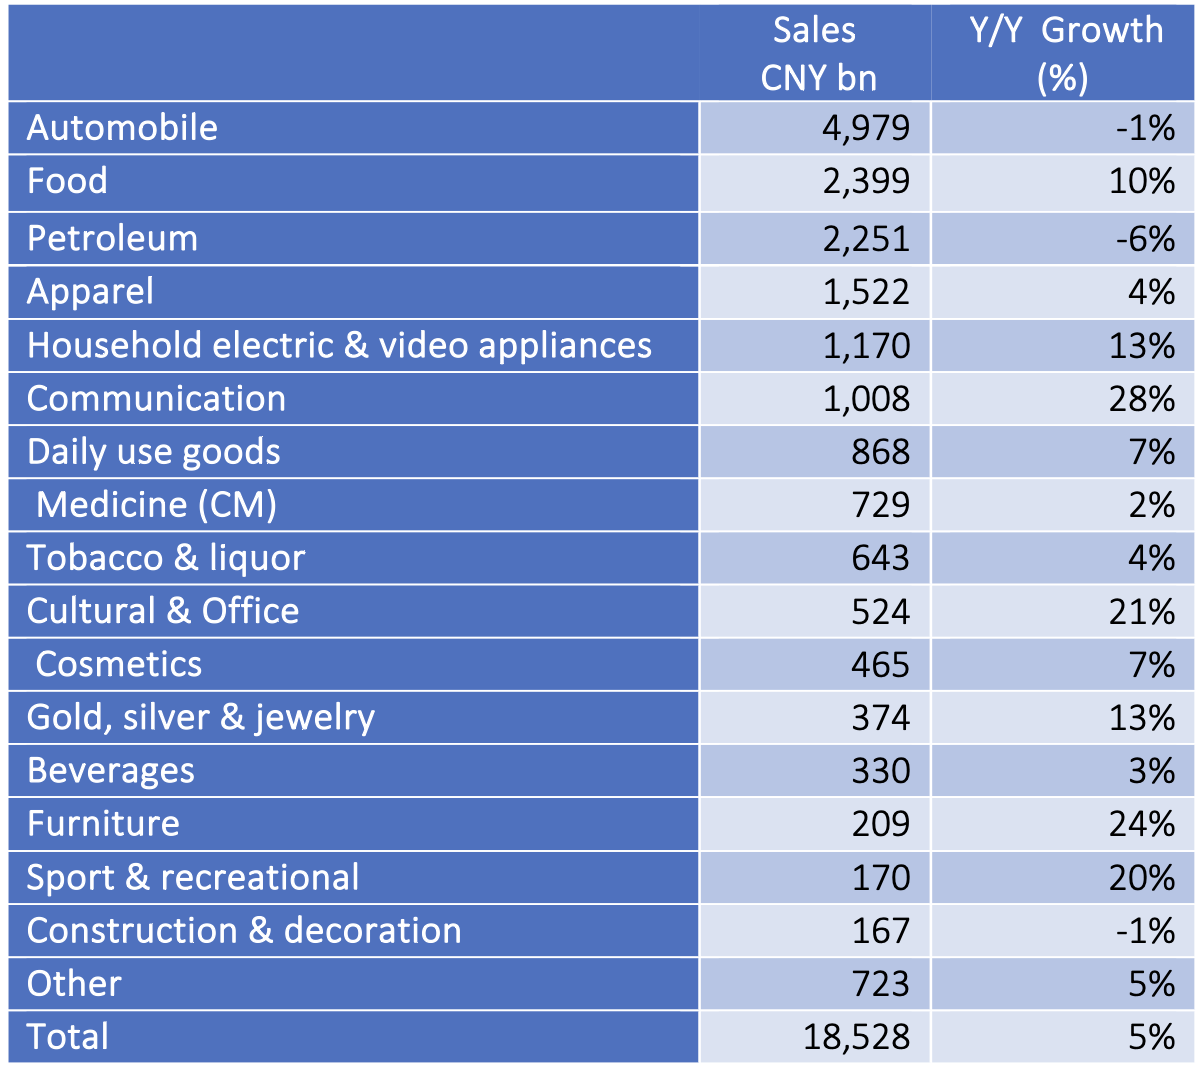
Figure 11
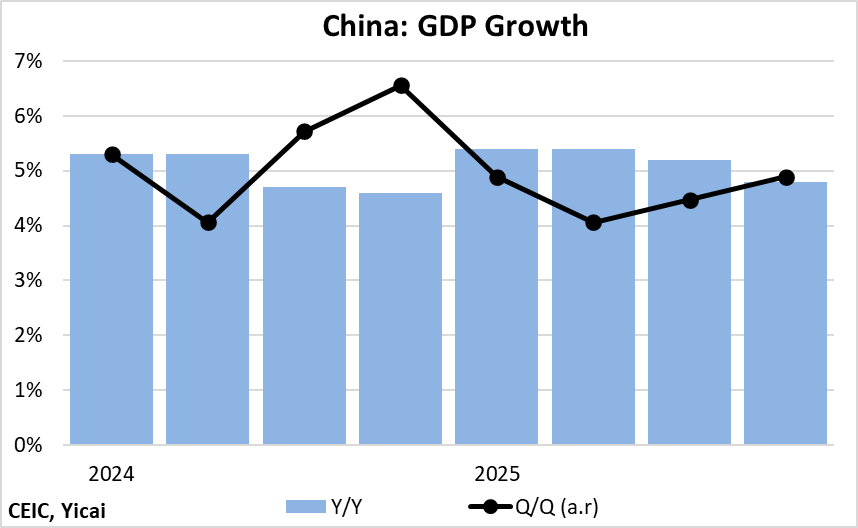
My best guess for GDP growth in 2026 comes from extrapolating recent quarter-over-quarter numbers at annual rates. These data give a more up to date picture of the economy’s momentum than the year-over-year rates. Over the last four quarters, growth has averaged 4.6 percent (Figure 12).
Figure 12
One could imagine that 4.6 percent growth could be achieved through a gentle increase in consumption to 2020-23 rates, a very modest increase in the contribution of investment and a smaller but still significant boost from net exports (Figure 13). While growth in the 4½ percent range would represent a slowing from what we have seen since 2020, it would likely be achievable with less fiscal support. In addition, while growth might slow from 2025, it appears that the downside risks are smaller, due to more favourable geopolitics, than they were last year at this time.
Figure 13
 Mark KrugerBased in Shanghai, Mark Kruger holds Senior Fellow appointments at the Yicai Research Institute, the Centre for International Governance Innovation and University of Alberta’s China Institute. Between 2020 and 2023, Mark was the Opinion Editor at Yicai Global. Previously, he had a 30-year career with the Bank of Canada in the course of which he served as a Senior Advisor to the Canadian Executive Director at the IMF and the head of the Economic and Financial Section of the Canadian Embassy in Beijing.


