 How Is China’s Recovery Progressing?
(Yicai Global) June 6 -- On June 1, China’s National Bureau of Statistics released its Purchasing Managers' Indices (PMIs) for . The press has tended to focus on the indices' monthly dynamic and has emphasized a slowing manufacturing sector and an accelerating service sector. However, the opposite conclusion can be drawn just as easily. May's manufacturing PMI reading – 50.6 percent – was still quite strong, about two standard deviations above its 2019 average. And, at 53.6 percent, the non-manufacturing PMI remains somewhat below its mean reading for last year.
Taken together, the PMIs seem to indicate that the economy is slowly recovering but it is hard to tease out the speed of the recovery from the information they provide. We discussed some of the problems with the PMIs in a previous piece.
To get a sense of how rapidly the economy is growing, we have developed the weekly Yicai High-Frequency Economic Activity Index (YHEI), which is based on eight component daily indices. We calculate year-over-year growth rates for each index and smooth them bit to get rid of the sharp rebound after the Chinese New Year. Following the method developed by economists at the , we extract the common trend from the eight growth rates and calibrate its mean and standard deviation to match year-over-year GDP growth.
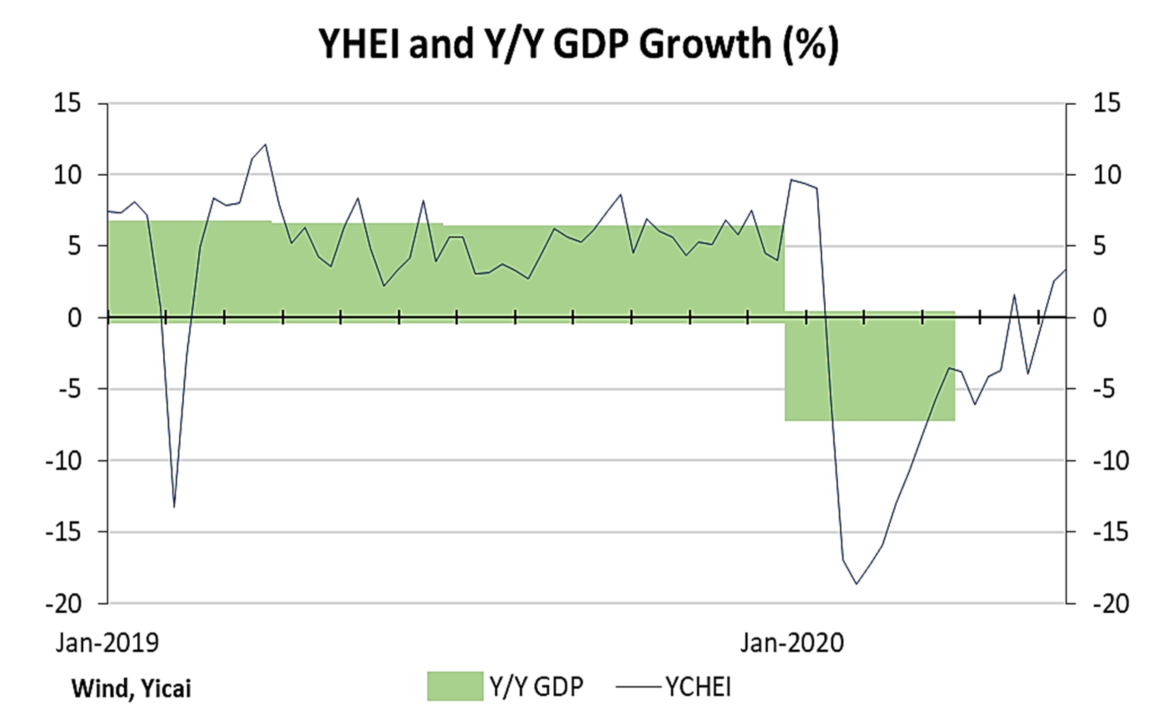
The graph below plots the YHEI data to May 30 against year-over-year GDP growth. In the first quarter, the YHEI fell to a low of -19 percent on February 8 before rebounding to -4 percent on March 28. For the quarter as a whole, the YHEI averaged -6.7 percent, compared to GDP growth of -6.8 percent.
The YHEI continued to climb in April and May, albeit at a slower pace than in March. It averaged -4.4 percent in April and 0.6 percent in May. Should this pace of recovery be maintained, the YHEI for June will come in at close to 5 percent and the second quarter will average 0.4 percent.
If GDP were to follow the path predicted by the YHEI and come in at 0.4 percent in the second quarter, it would be quite an achievement. Not only would it indicate a return to positive year-over-year growth following the terrible drop in Q1, but the level of GDP would be only 2 percent lower than that of the fourth quarter of 2019, which was the highest to-date.
Now let’s look at the components of our YHEI in more detail.
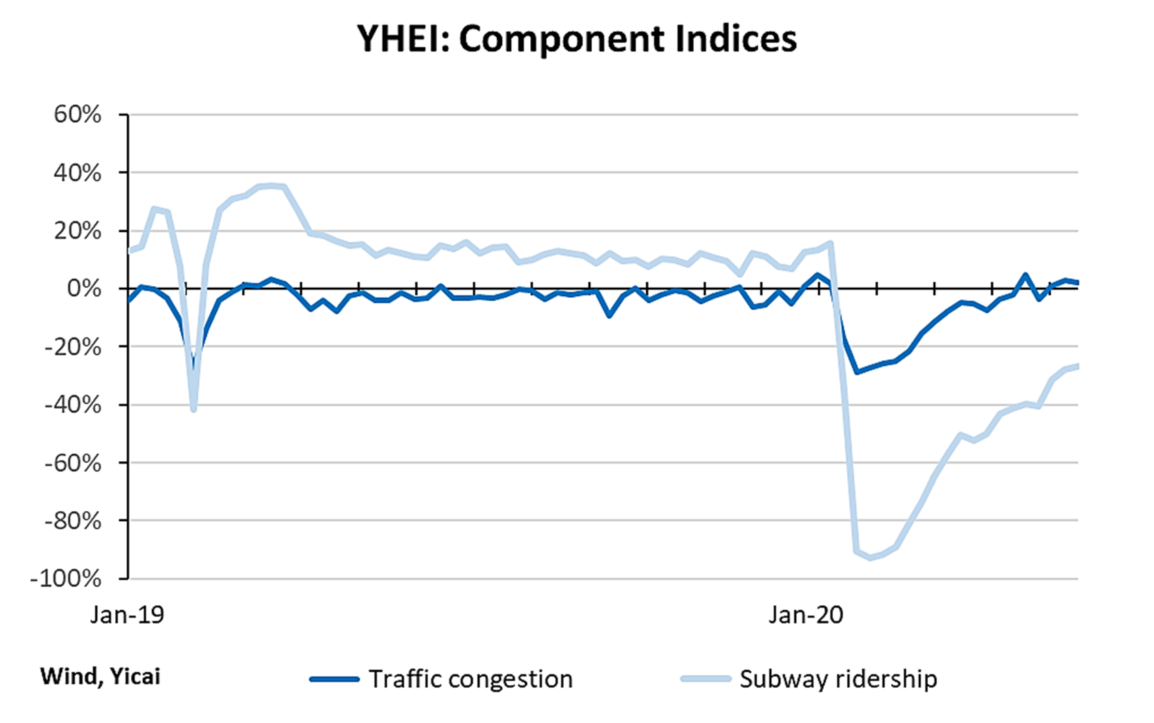
We have two mobility-based indices. Our 30-City Traffic Congestion Index is a weighted average of peak traffic congestion times compiled by AMAP. We weight congestion in China’s 30 most economically important cities by their relative municipal GDPs. We like this index because it is broad and not tied to a specific industry or sector. We also like it’s being available for a large number of cities. Our 8-City Subway Ridership Index looks at daily subway passenger traffic in Shanghai, Guangzhou, Chengdu, Nanjing, Xian, Suzhou and Chongqing. This index does not have as broad a coverage as our Traffic Congestion Index.
Both of these indices show rebounds from their February lows. However, subway ridership is still down about 20 percent, perhaps reflecting fear of infection and greater work from home. Low subway ridership could be inflating the traffic congestion series, which has recovered to its pre-crisis level.
We have two power-based indices. Our Coal Consumption Index reflects how much coal is consumed at China’s major power plants. More than two-thirds of China’s electricity production comes from burning coal and there is a good short-run correlation between this coal consumption indicator and monthly electricity consumption.
Our 8-City Air Pollution Index is a simple average of the readings of PM 2.5 concentrations in Beijing, Guangzhou, Nanjing, Suzhou, Nantong, Changzhou, Wuxi and Xuzhou. The burning of coal is a major contributor to PM 2.5 pollution.
While the air pollution index is more volatile than the one for coal consumption, the two show broadly similar trends and reflect power generation that has returned to normal levels.

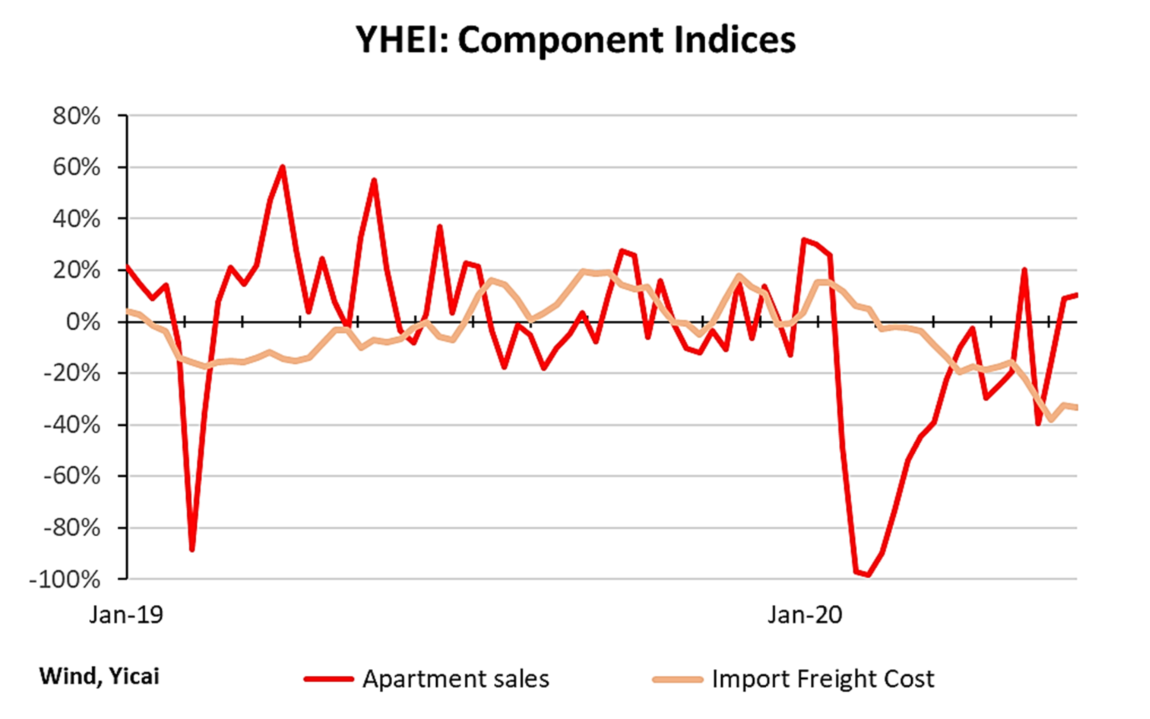
Our 30-City Unit Apartment Sales Index presents total unit apartment sales in China’s 30 biggest cities. Our Import Freight Cost Index reflects the China Import Dry Bulk Freight Index, a composite of the costs of shipping four types of cargo (iron ore, coal, grain and nickel ore) to China via 14 global routes. This index has a good, medium-term correlation with imports.
The trends in these indices are quite different. Apartment sales are back to normal, while the cost of shipping bulk goods to China is still well below last year.
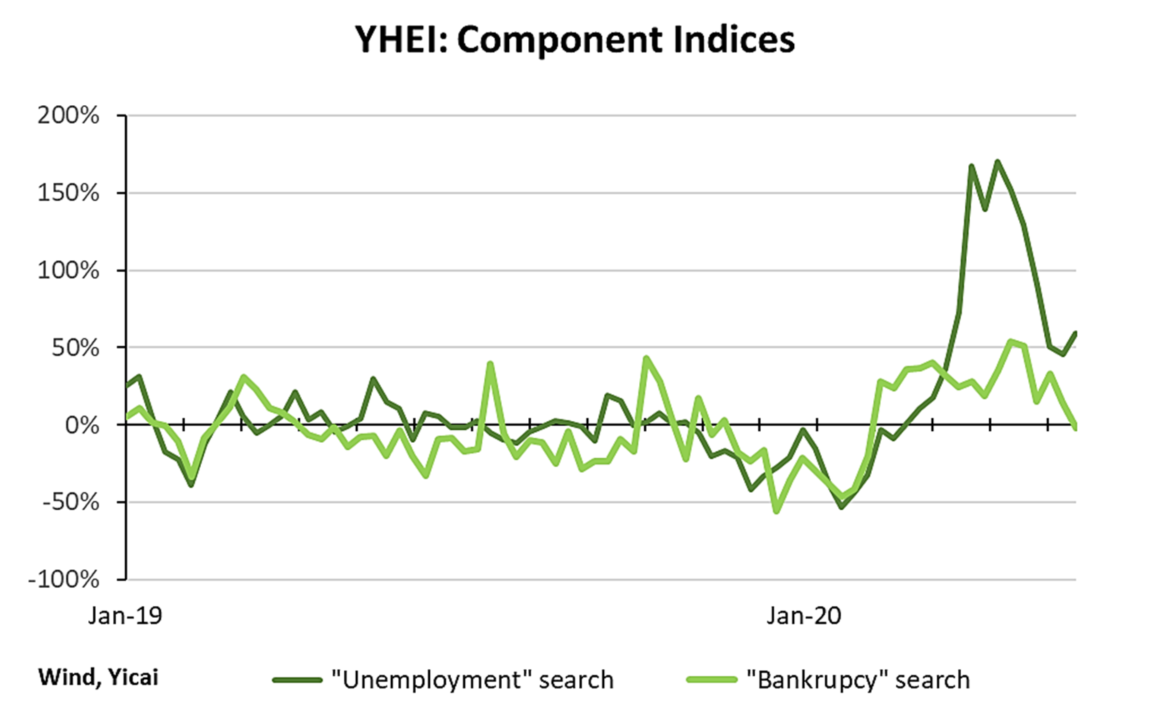
Our final set of indices reflect searches on the Baidu website (China’s Google) for the keywords unemployment (失业) and bankruptcy (破产).
The graph below shows that searches for these two terms increased in February, with those for “unemployment” spiking particularly sharply. Searches for “bankruptcy” have essentially returned to normal while those for “unemployment” have receded from their April peaks but remain 50 percent higher than last year.
Our eight component indices do not make equal contributions to the YHEI. Their weights depend on the extent that they reflect the common trend on which the YHEI is based. The importance of the two mobility indices, apartment sales and coal consumption are roughly equal and about ten times as important as the other four indices. Still, when a minor index like searches for “unemployment” makes a big move, it too can have a significant effect on the YHEI.
Forecasts for GDP growth this year are clouded by many types of uncertainty. We don’t know how the virus will evolve. We don’t know how quickly countries around the world will get back to work. We don’t know how supportive new macroeconomic or how destructive new trade policies might be. We cannot even be sure how well our models fit the real world. However, monitoring a wide set of alternative data on a high frequency basis can offer a “reality check” on traditional data, like the PMIs, which may be less informative than usual.


