 Is the Bottom Falling Out of China’s Property Market?
(Yicai Global) Dec. 5 -- In its November , the US Federal Reserve noted that its market contacts had become increasingly preoccupied by shocks emanating from China, which could spill over and disrupt the American economy. Close to half of the Fed’s contacts raised the possibility of a significant China regulatory/property market shock in the next 12 to 18 months. This made it the third most cited high-impact risk, following domestic monetary tightening and vaccine-resistant Covid variants.
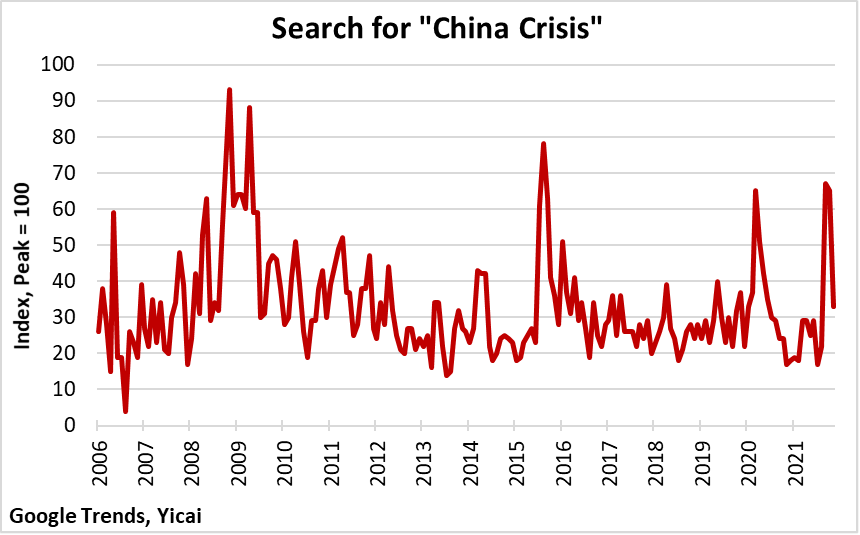
The Fed’s contacts’ apprehension mirrors a larger trend of anxiety about China. A simple Google search for the term “China Crisis” shows a spike in September-October when it looked like giant property developer Evergrande might default (Figure 1). Previous spikes reflected the outbreak of Covid-19 (spring 2020), the surprise devaluation of the renminbi and ensuing financial market volatility (summer 2015) and the global financial crisis (winter 2008-09).
Figure 1
This concern is understandable. China’s property market is huge. Sales of newly constructed homes totalled CNY 15.5 trillion ($2.2 trillion) last year. That’s seven times the value of new home construction in the US. The Chinese property market is connected globally through raw material imports and developers’ finance. So, a sharp housing downturn in China could, indeed, have global ramifications.
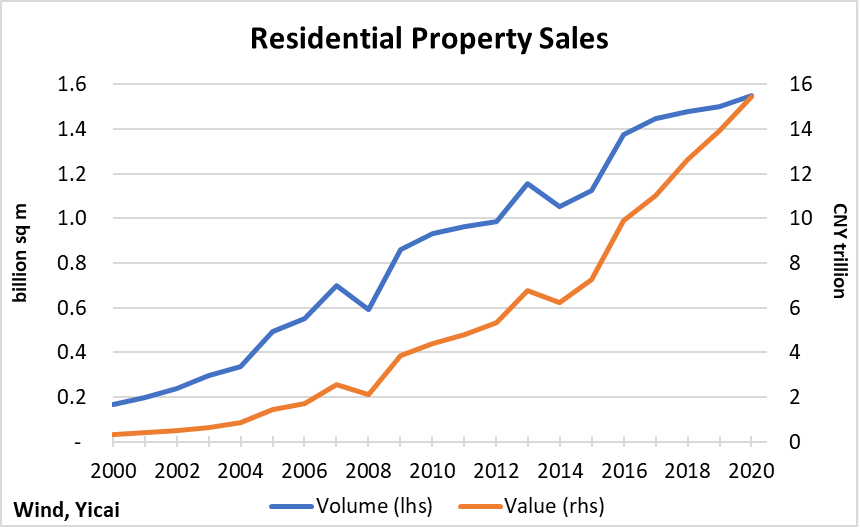
China’s housing market has grown very fast. The value of sales more than tripled between 2011 and 2020 with the volume of floor space sold rising by 60 percent over the nine-year period and prices doubling (Figure 2). In part because of its rapid growth, the market has been subject to a series of stop-and-go cycles. The downturns in 2008 and 2011-12 were largely policy-driven. The authorities tightened home purchase policy to rein in price increases and improve affordability. In contrast, the slump in 2014-15 was primarily driven by market forces, including a significant buildup of inventories, slowing economic growth and financial innovation that offered households a wider range of investment opportunities.
Figure 2
The current cycle has also been policy-driven, but this time the authorities were trying to contain financial risks rather than apartment prices. Chinese property developers’ business model involves borrowing large sums to acquire land and constructing apartment blocks, a process that typically takes three years to complete. With the market growing so rapidly, the developers have become highly indebted.
In August 2020, the authorities began to implement the “Three Red Lines” framework, which is calibrated to align property developers’ borrowing with the health of their balance sheets. The liabilities of developers that breach all three of the red lines are not permitted to grow, while those of developers who don’t breach any may increase by 15 percent per year.
In late October, that of the 30 biggest property developers, 3 had breached all three red lines, 5 had breached two, 13 had breached one and 9 had respected all three. These 30 developers sell close to 45 percent of China’s residential property.
The Three Red Lines have made developers less willing to undertake new projects and more eager to unload their existing properties. As a result, prospective home buyers are now less likely to find attractive new projects on the market. Moreover, with developers lowering their prices, they are more willing to take a wait-and-see approach before buying in case prices fall further.
Home sales were quite robust last winter, but they have dropped precipitously since the summer. The prices of new apartments are sensitive to the trend in sales (Figure 3). There were prolonged periods of month-over-month price declines in 2011-12 (8 months) and 2014-15 (11 months) when sales were especially weak.
Figure 3
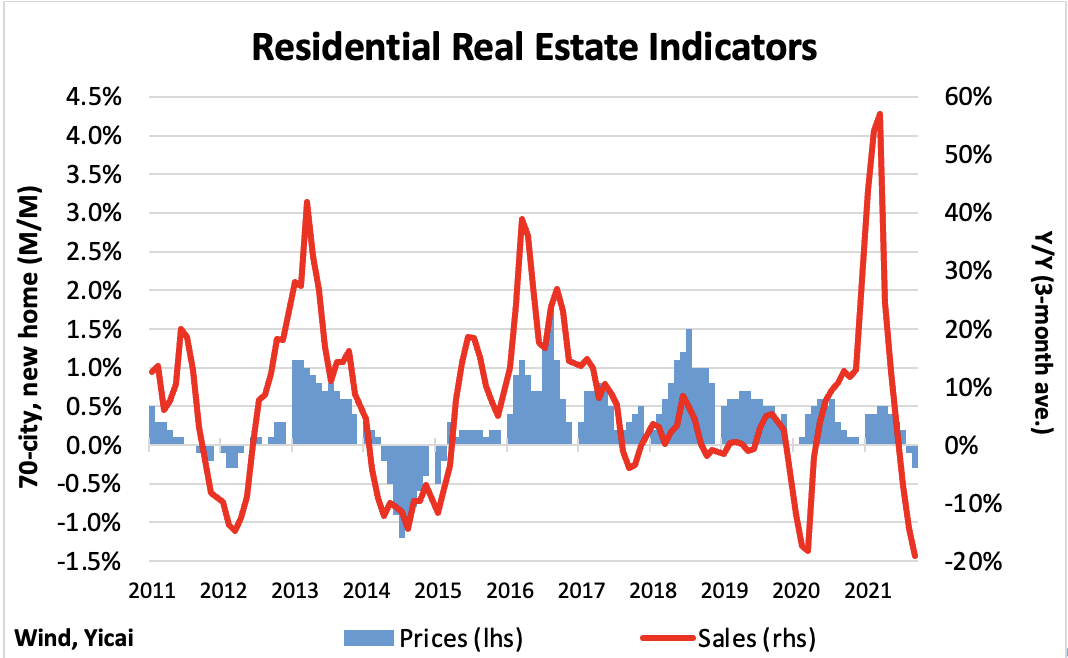
In this cycle, prices have just begun to fall. Across China’s 70 biggest cities, existing home prices decreased in both September and October. The decline was widespread geographically, with 64 of the 70 cities reporting month-over-month drops in October (2 cities reported no change and 4 reported increases).
The question on everyone’s mind is: how deep and how long will this cycle be?
Three factors suggest that the current cycle will be milder than the one in 2014-15.
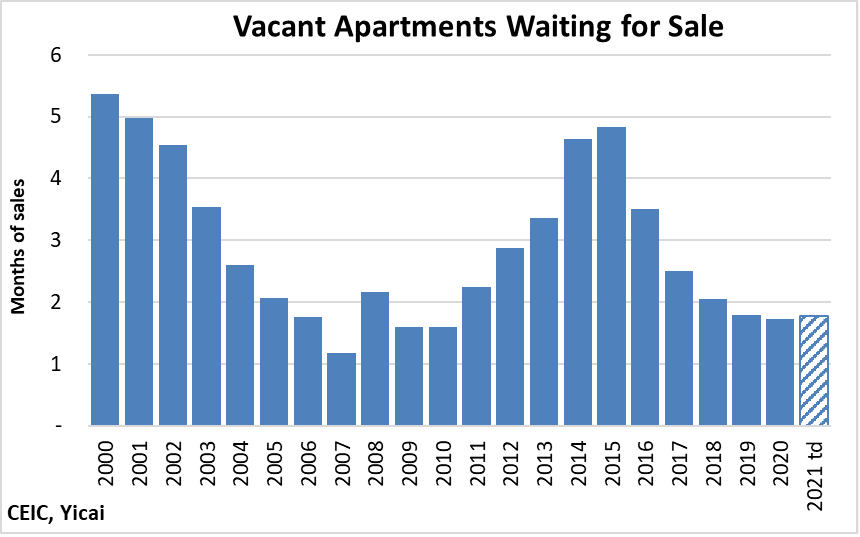
First, inventories are much lower now than during previous cycles. In terms of months of sales, inventories are less than half as high as they were during 2014-15 (Figure 4). This means that developers do not have a particularly large stock of unsold apartments to liquidate before they begin building again.
Figure 4
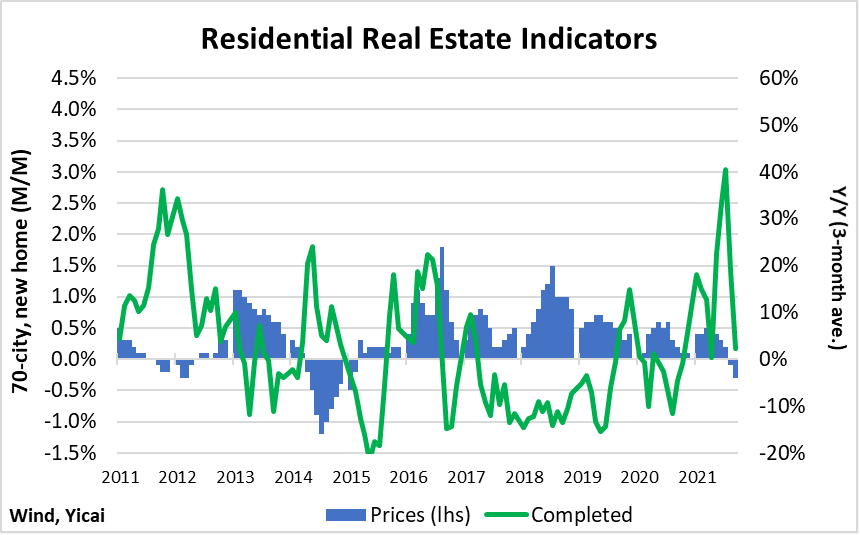
Second, the Three Red Line policy will limit how quickly developers will be able to resume new construction. Looking back over previous cycles, prices increased more rapidly when fewer apartments were completed, for example during 2013 and 2017-18 (Figure 5). More stringent regulation of developers’ borrowing means that we can anticipate a relatively slow supply response during this cycle. This should support price growth and re-attract those wait-and-see buyers.
Figure 5
Third, we believe that the underlying demand for housing remains strong. It is true that the housing market has matured and is no longer being driven by demographics. Population growth has slowed to a crawl. While there is bound to be some more rural-urban migration, the biggest exodus has already occurred. However, I would not underestimate the demand for upgraded accommodation. Indeed, all over Shanghai, dilapidated housing is being torn down and replaced with gleaming apartment towers, whose units are not hard to sell.
To get a more nuanced picture of the demand for upgrades, we turn to data collected by RIWI (). RIWI uses patented, machine-learning technology to reach the broadest possible set of respondents. It continuously draws in populations otherwise not included in surveys. Anyone using the Web in China could be randomly exposed to a RIWI survey. The vast majority of RIWI’s Chinese respondents have never, or rarely, taken surveys before. Typically, Chinese surveys only draw on those living in key urban centres or on habitual, incentivized survey respondents. Or they use content drawn from social media. RIWI’s surveys are anonymous, continuous, random and do not collect personally identifiable information, increasing the likelihood that respondents will answer authentically.
While RIWI’s survey data do not allow us to measure “better properties” directly, they do offer strong indirect evidence that the demand for upgrades remains robust. RIWI asked its survey participants how much the price of their apartments had changed in the last 12 months.
In China, it is very easy to know the current market price of your apartment. Most urban families live in neighbourhoods (小区) made up of many, fairly similar, apartment towers. The prices of the units for sale are posted in the offices of the real estate agents, which seem to dot every street corner. Given the posted per-square-meter price of the units for sale, it is fairly easy to estimate the price of your own apartment.
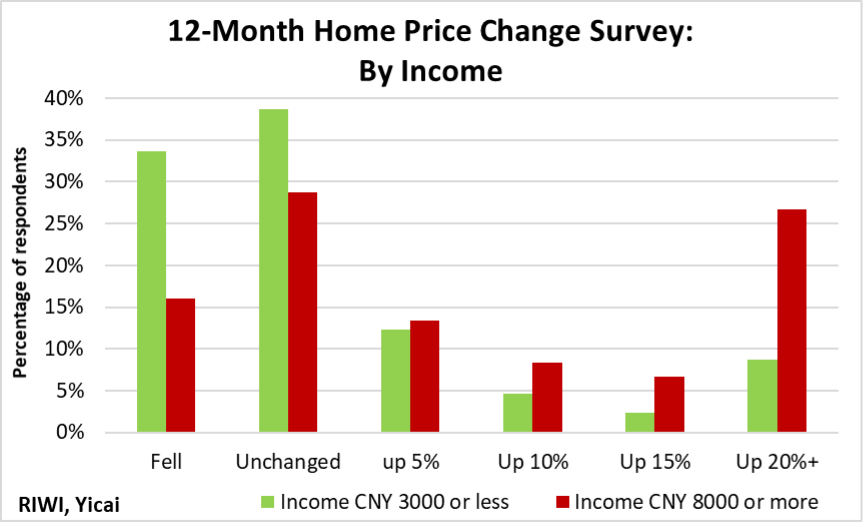
In this exercise, we look at the responses RIWI obtained for September-November. RIWI is able to sort the 12-month apartment price change by income group (Figure 6). For the low-income group that earns CNY 3000 or less a month, 34 percent reported price declines, 39 percent reported unchanged prices and 28 percent reported increases.
In contrast, for the high-income group that earns CNY 8000 or more a month, only 16 percent reported declines, 29 percent reported unchanged prices and 55 percent reported increases. In fact, more than a quarter of the high-income group reported increases of 20 percent or more!
Across China’s 70 largest cities, existing home prices were only up 2.2 percent year-over-year in September-October. The much more rapid home price appreciation of those with higher incomes suggests that demand for upgrades is quite robust.
Figure 6
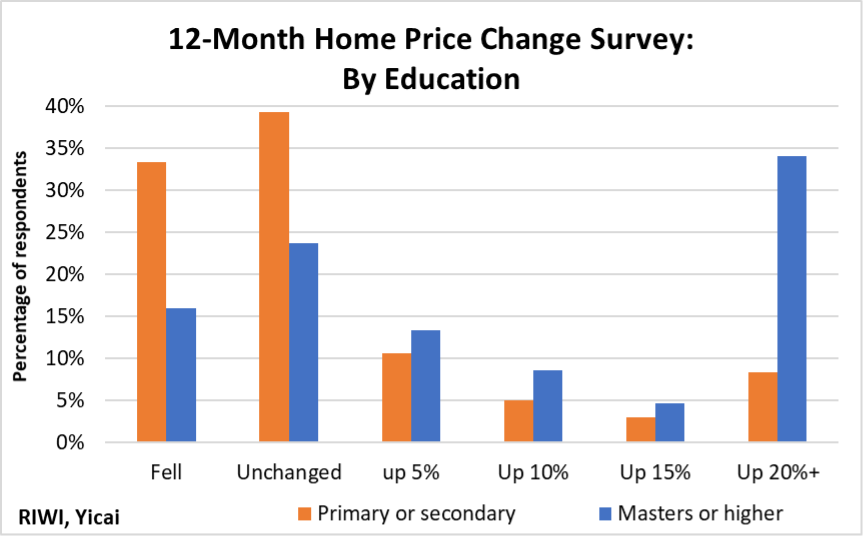
RIWI is also able to sort the data by educational attainment (Figure 7). A similar, if not somewhat starker, picture arises. Twice as many respondents with only primary or secondary education report price declines as those with master’s degrees or higher.
For the highly-educated group, 61 percent report price increases, more than double those with primary or secondary education. A third of the highly educated respondents report price increases of 20 percent or more.
I assume that the better educated not only have higher incomes but also come from wealthier families than those with primary or secondary education and that this explains the greater price dispersion in Figure 7 versus Figure 6.
Figure 7
Make no mistake about it, a major slump in the housing market would pose a serious risk to the Chinese economy. In particular, developers are counting on robust sales to comply with the Three Red Lines. Should sales fail to bottom out, we could see more developers going bankrupt and increased stress put on Chinese financial institutions.
However, the demand for housing appears to be intact and is likely to rematerialize once the market stabilizes. Given the low level of inventories, stabilization could be much more rapid than during 2014-15. Moreover, tighter regulation of the property developers suggests that supply will only adjust slowly thus modulating the depth of the downturn.


