 Assessing Covid’s Macroeconomic Scarring
(Yicai) Feb. 29 -- The battle against the Covid pandemic left profound scars on the global macroeconomy.
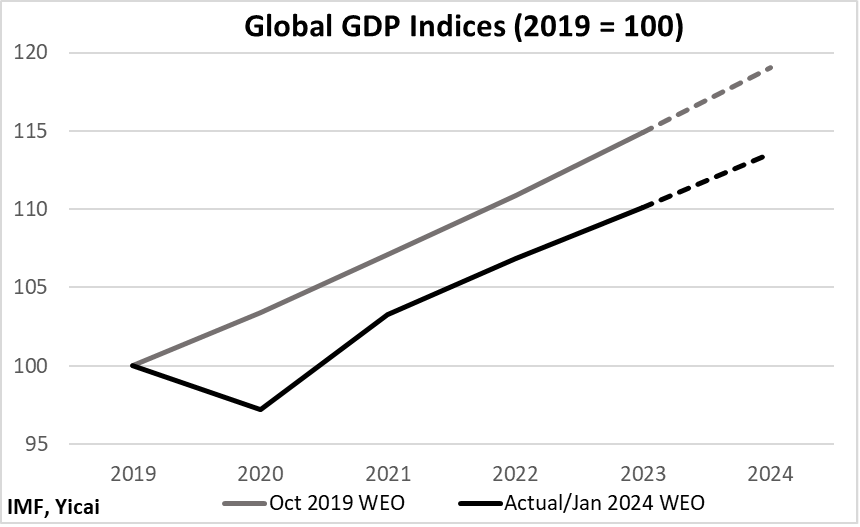
The scale of global GDP lost to both the ravages of the disease and the measures taken to keep populations safe can be seen by comparing the IMF’s most recent World Economic Outlook (WEO) against the forecast it made in October 2019.
Rather than growing by 3.4 percent, as expected in the October 2019 WEO, the global economy shrank by 2.8 percent in 2020 (Figure 1). The decline was the sharpest since the Great Depression and 2020’s outturn was far worse than during the Global Financial Crisis.
The global economy recovered rapidly in 2021, exceeding its pre-pandemic peak. However, it has not returned to the growth path expected in the October 2019 WEO. In fact, since 2021, the divergence from that path is becoming somewhat wider. In the October 2019 WEO, the IMF forecast that global GDP would increase by 3.6 percent this year. Only 3.1 percent growth is expected in the Fund’s January 2024 update.
Figure 1
One way to think about the extent of the output lost during the pandemic period is to consider the differences between the October 2019 WEO forecast and the actual outcomes.
Figure 2 shows that the level of global GDP in 2020 was 6 percent below the October 2019 forecast. The gap narrowed to 3.5 percent in 2021 but subsequently widened a bit. The IMF’s January WEO suggests that global GDP will be 4.6 percent below the October 2019 forecast this year.
Figure 2
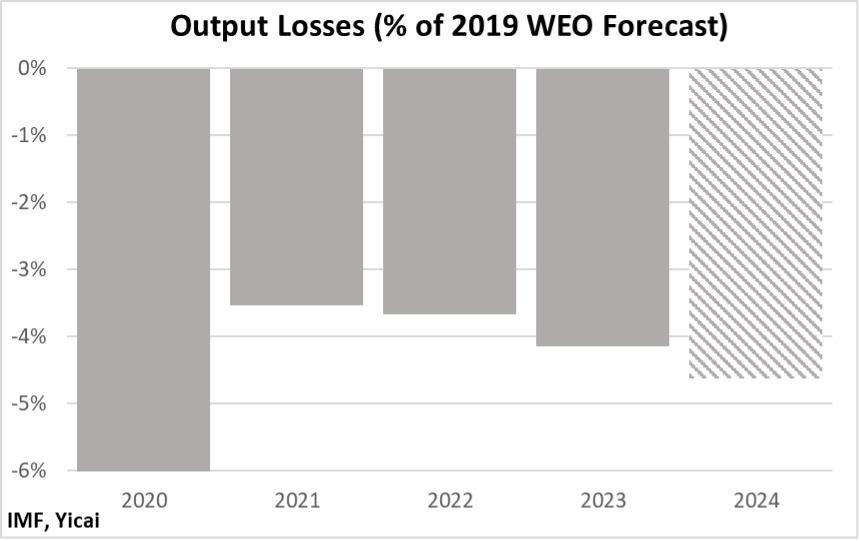
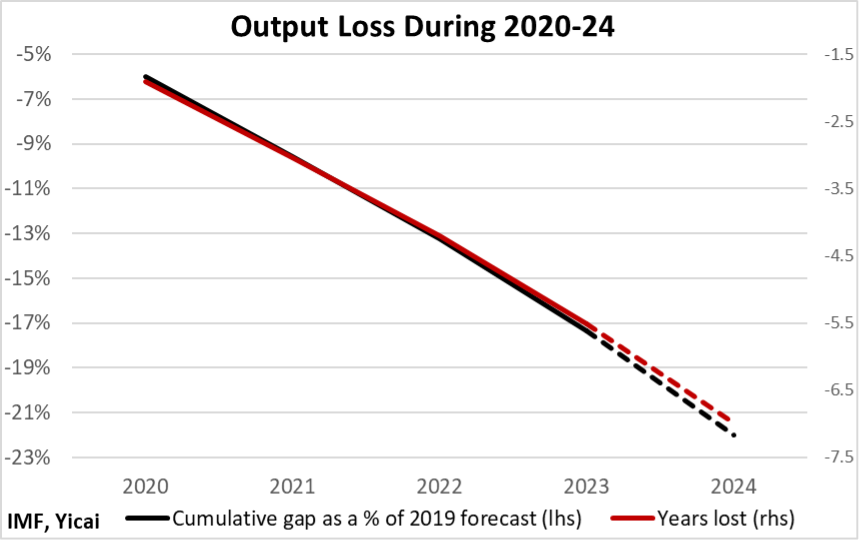
Figure 3 sums the annual gaps between the October 2019 WEO on the one hand and the actual outcome over 2020-23 and the Fund’s most recent forecast for 2024 on the other. In 2023, the cumulative gap was more than 17 percent of the forecast level. This is the equivalent of 5½ years of growth, based on the rates the IMF expects over 2024-25. If the Fund’s January 2024 WEO forecast is realized, then the world will have lost the equivalent of 7 years of GDP between 2020 and 2024.
Figure 3
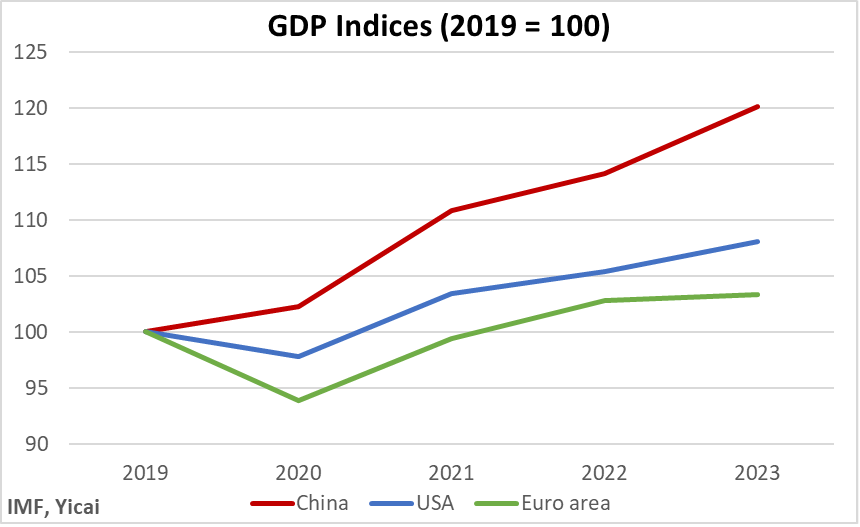
Digging down to the country level, we see that China’s economy was one of the fastest growing over the last four years. It did somewhat better than India but not as well as Turkey. By 2023, it was 20 percent larger than in 2019 (Figure 4), outstripping the US (+8 percent) and the Euro Area (+3 percent). This is not surprising as China’s potential growth is higher than those of the other two major economies.
Figure 4
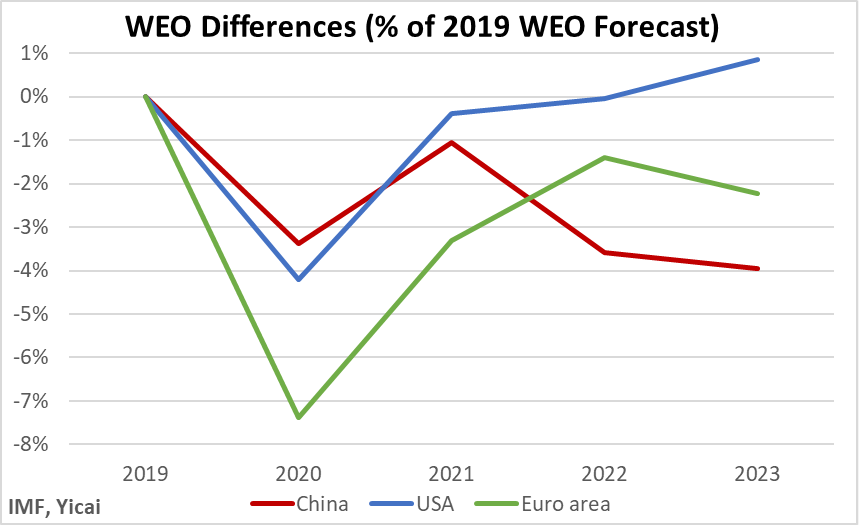
While the Chinese economy did grow relatively rapidly, it fell well short of where the October 2019 WEO expected it would be. Last year, the level of China’s GDP was 4 percent below those expectations (Figure 5). The Euro Area has under-performed as well. In contrast, the US economy returned to the predicted growth path in 2022. Last year, its GDP was 1 percent higher than what the October 2019 WEO forecast.
Figure 5
The US economy’s robust rebound was due to policymakers’ early and aggressive use of fiscal and monetary stimulus. Policy was very loose in 2020. It subsequently became more restrictive as the recovery took hold and inflation rose. Surprisingly, tighter policy did not thwart the recovery as the economy benefitted from a strong increase in its labour force – especially from workers who had immigrated to the US. This positive shock to the US’s labour supply helped to dissipate inflationary pressures and prevented the economy from falling into a recession.
Despite the US economy’s relatively strong macroeconomic performance, its households remain unimpressed.
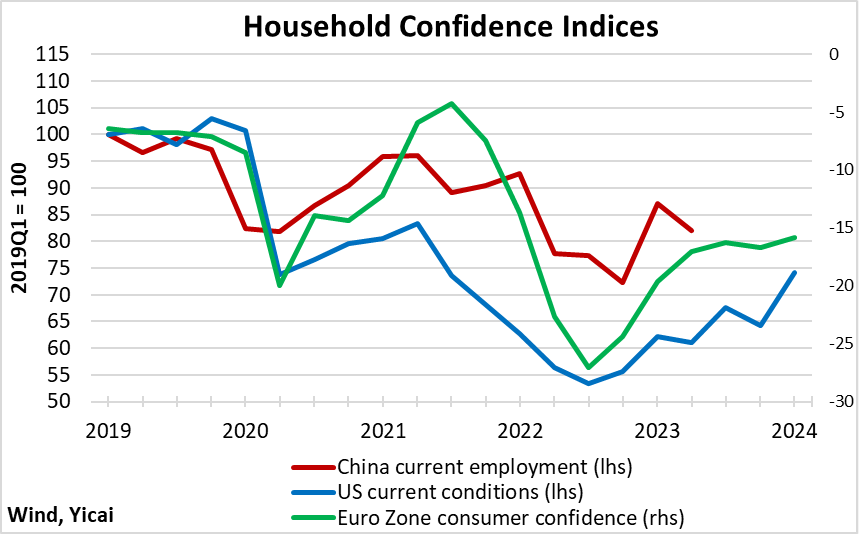
The University of Michigan regularly surveys households’ assessments of economic conditions. It asks two questions: (i) are you better or worse off financially than a year ago and (ii) is this a good or a bad time to purchase a major household item? Its index of current conditions is based on the differences between the positive and negative responses.
The blue line in Figure 6 shows that while consumers’ sentiment toward current conditions has recovered from the recent low recorded in early 2022, it remains well below pre-pandemic levels. According to analysis done by the University of Michigan, American households had been concerned about rising prices since 2021. Their discomfort peaked in the summer of 2022 at historic highs. While they became less anxious about high prices as inflation receded, they have been increasingly preoccupied by the effects of high interest rates.
Prices in the US are currently some 20 percent higher than they were in January 2019. The Euro Area experienced a similar level of inflation over the past four years. However, in China, cumulative inflation was just over 7 percent. As a result, while interest rates in the US and the Euro Area have risen to relatively high levels, Chinese rates are falling.
Even though macroeconomic conditions in the US, the Euro Area and China have been quite different, Figure 6 shows that the evolution of household sentiment in the three major economies has been surprisingly similar.
Figure 6
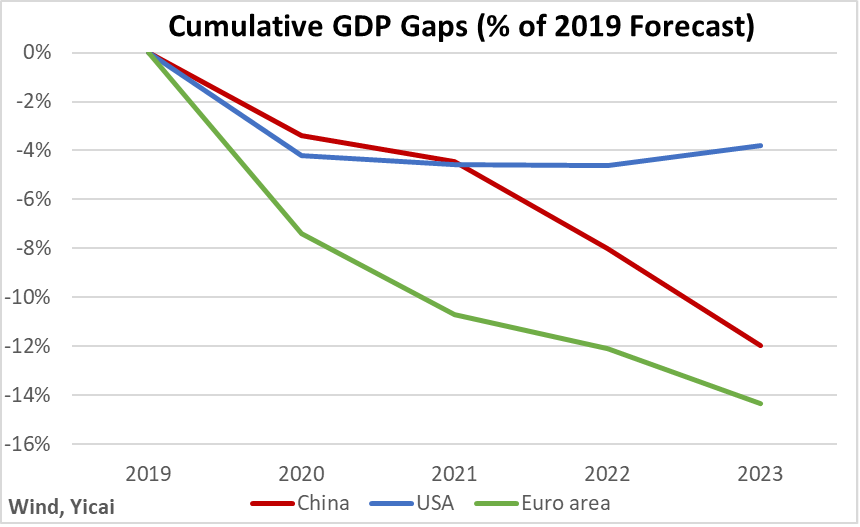
Through 2023, the cumulative output lost in the US was just under 4 percent of the level projected in 2019 (Figure 7). The corresponding losses for China and the Euro Area were 12 percent and 14 percent, respectively.
The IMF projects that, over 2024-25, the Chinese economy will grow by 4.4 percent, the US’s by 1.9 percent and the Euro Area by 1.3 percent. This implies that the US lost 2.0 years of growth during the pandemic period, China lost 2.8 years and the Euro Area lost an eye-popping 11 years.
Figure 7
Of course, the cost of the pandemic cannot simply be measured in terms of forgone GDP, especially since measures undertaken to protect public health were part of the reason that the global economy performed poorly relative to pre-pandemic expectations.
The public health impact of the pandemic on a given country has been typically assessed in terms of Covid-related deaths. However, the comparability of this metric depends on how “Covid-related death” is defined across various jurisdictions. As a result, researchers have increasingly used “excess mortality” as a way of assessing the human cost of the pandemic.
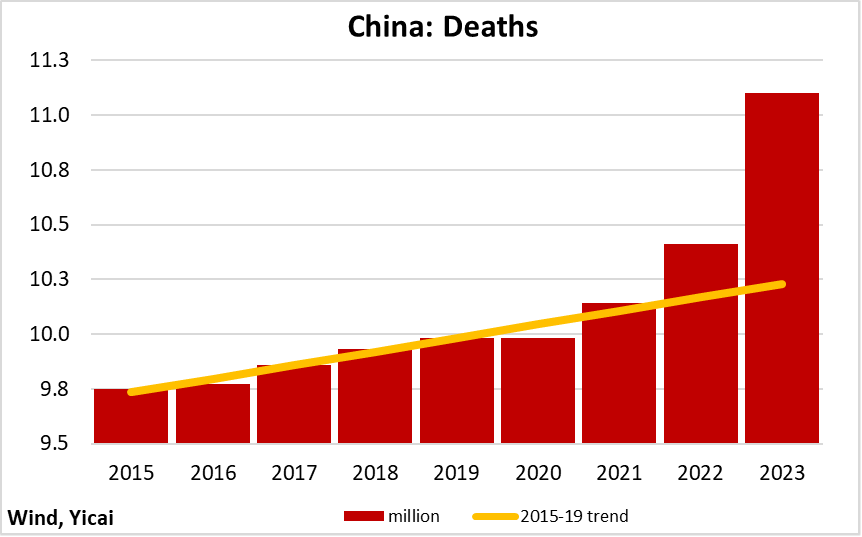
Following Karlinsky and Kobak, I calculate excess mortality during 2020-23 for the three major economies as the difference between actual deaths and the number predicted by the 2015-19 trend. For the US and the Euro Area, the deaths data come from the World Mortality Dataset complied by Karlinsky and Kobak.
In January, China’s National Bureau of Statistics reported a total of 11.1 million deaths in 2023. This was up sharply from the 10.4 million deaths in 2022 (Figure 8). Based on the 2015-19 trend, I estimate that there were 1.15 million excess deaths in China over 2020-23, with close to 900,000 occurring last year.
The estimate of excess deaths last year is consistent with the modelling based on Hong Kong’s experience with the Omicron variant. Those projections suggested that there would be just over 964,000 deaths following the relaxation of public health policies in late 2022.
Figure 8
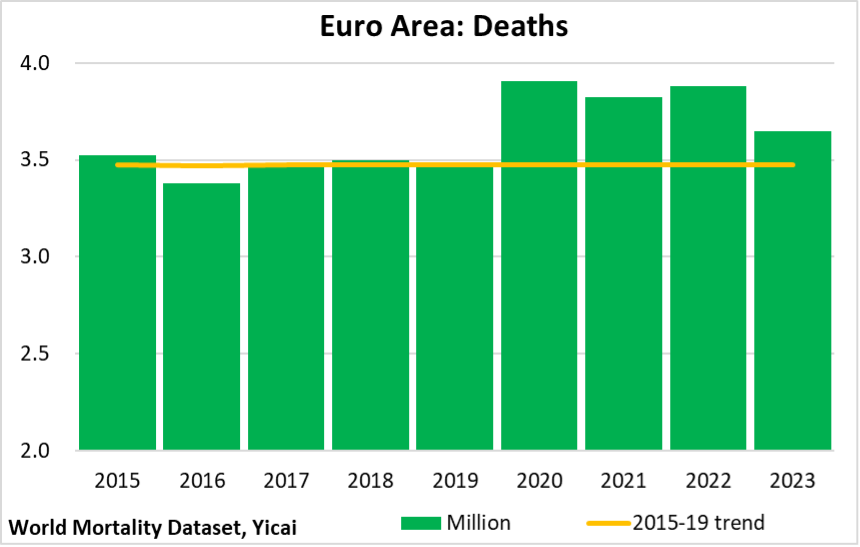
I estimate that excess deaths in the Euro Area reached 1.36 million over 2020-23 (Figure 9).
Figure 9
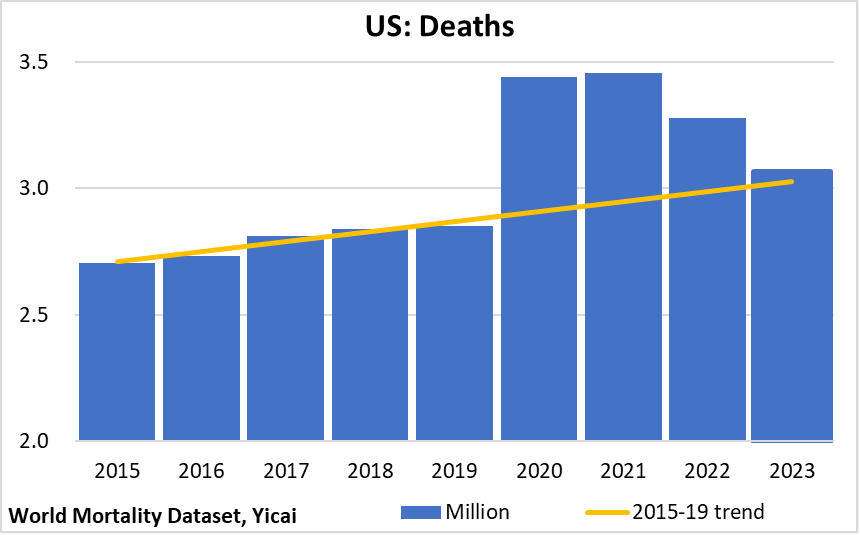
My estimate for excess deaths in the US is very similar: 1.37 million.
Figure 10
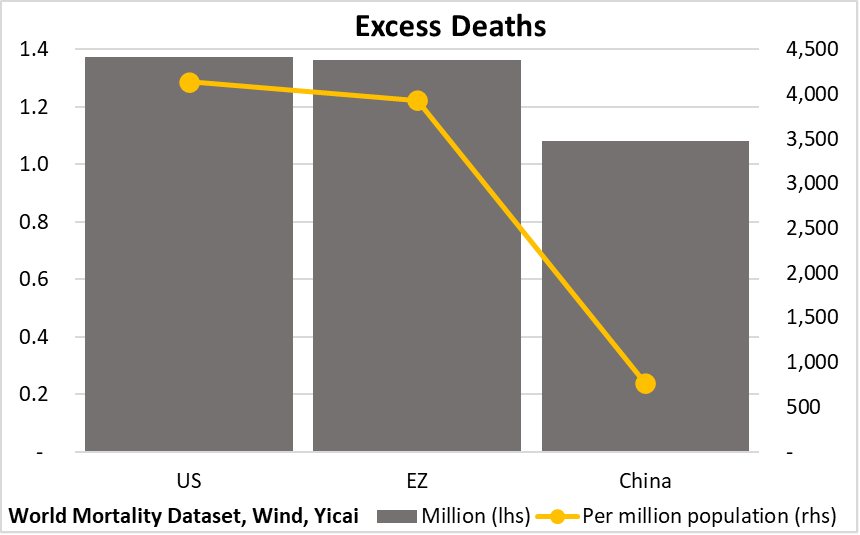
Adjusting for population, there were 812 excess deaths per million people in China. This was well below the rates in the US and the Euro Area, where excess deaths were in the 4000 per million people range (Figure 11).
Figure 11
Even though the pandemic has been brought under control, households in the three major economies remain dissatisfied with economic conditions. This is understandable given how much weaker economic activity is than what we expected before the pandemic hit. Moreover, in many countries, higher prices have cut households’ spending power.
Looking across the three major economies, it appears to me that China has not done too poorly. The economy is a fifth larger than it was in 2019. While it has lost the equivalent of 2.8 years of output, it did much better than the global economy as a whole, which lost 5.5 years. And it was not far behind the 2.0 years lost by the US. Inflation has been relatively well behaved. And, most importantly, the human cost of the pandemic was much lower than in the US or the Euro Area.
Nevertheless, cross-economy comparisons may only offer Chinese households cold comfort. Ultimately, the economy will need to perform well in 2024 to lift their spirits.
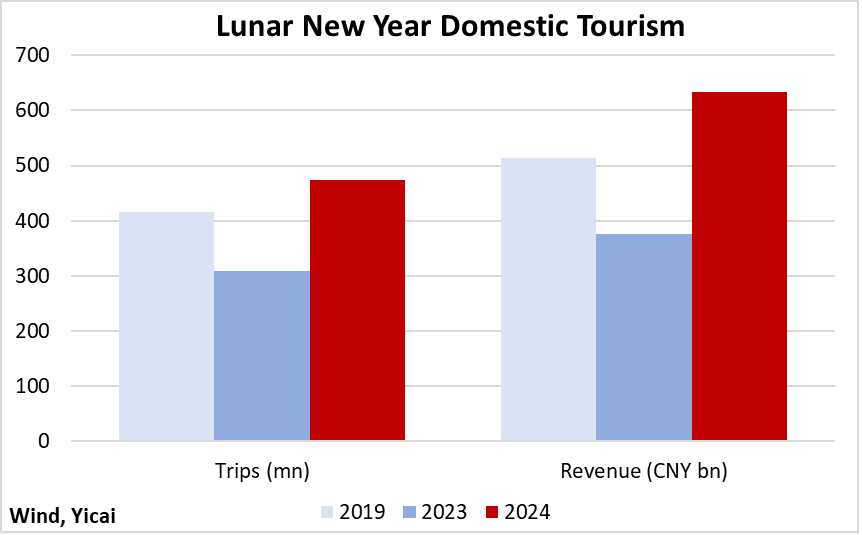
Some of the year’s early economic news has been encouraging. Both domestic travel and spending during the Lunar New Year period were up sharply over last year and they topped 2019 levels for the first time (Figure 12). This suggests that Chinese consumers are becoming more inclined to spend. In other good news, Chinese automobile exports were up 47 percent year-over-year in January.
If they can be maintained, strong consumption and exports will, hopefully, help households forget the scars of the pandemic.
Figure 12
 Mark KrugerMark Kruger is Yicai Global's Opinion Editor and Senior fellow to the Yicai Research Institute. He is also a Senior Fellow at both the University of Alberta's China Institute and the Centre for International Governance Innovation. Mark was formerly a Senior Policy Director in the Bank of Canada's International Department, a Senior Advisor to the Canadian Executive Director at the International Monetary Fund and head of the Economic and Financial Section in the Canadian Embassy in Beijing.


