 Big Mac Prices – No Bull
(Yicai Global) March 1 -- Happy Year of the Ox! I want to take a moment, in my first Opinion Piece of this new lunar year, to wish you and your families health, prosperity and all good fortune.
In honor of this Chinese New Year’s mascot, the Golden Bull, I wanted to explore a beefy dataset with you – the Economist’s Big Mac Index. The Economist has been collecting data on MacDonald’s hamburger prices around the world for many years. In my opinion, these data provide an interesting perspective on the evolution of prices both in China and internationally.
A country’s price level is central to assessing the size of its economy and the wealth of its citizens. So, economists have a strong interest in understanding how prices compare across countries.
To make cross-country comparisons, economists often rely on market exchange rates. However, market exchange rates can fluctuate wildly, they can be manipulated by central banks and they can diverge from economic fundamentals for long periods of time.
Purchasing power parity (PPP) exchange rates offer an appealing alternative. PPP exchange rates represent the rate at which the currency of one country would have to be converted into that of another to buy a common basket of goods and services. For example, if the basket costs $1000 in the United States and 9,400 pesos in Mexico, then the dollar-peso PPP exchange rate is 1 to 9.4.
The task of defining this common basket and then pricing it around the world falls to the International Comparisons Program (ICP). The ICP is a statistical initiative under the auspices of the United Nations, which is coordinated by the WorldBank.
The ICP “one of the largest statistical initiatives in the world” and it is easy to see why. In 2017, it collected the prices of close to 1000 different goods and services in each of 176 countries. It took nearly three years to collate and release the results. And, the next update of this exacting process won’t be conducted until 2021.
The ICP produces a useful trove of detailed cross-country price information, which data junkies like me really appreciate. But it seems to me that the Economist is able to do a very similar job at only a fraction of the cost. Indeed, the Economist updates its Big Mac Index twice a year, albeit for only 50-odd countries, and can provide much more timely data than the ICP.
Let’s take the bull by the horns and see how the two datasets compare.
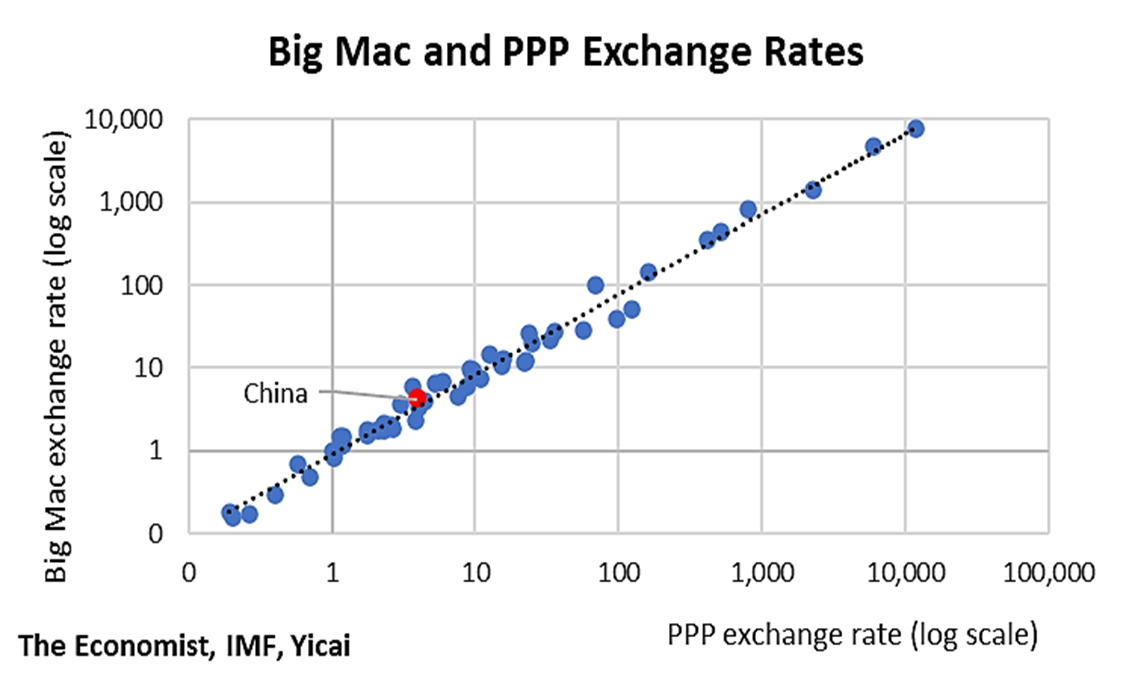
The vertical axis in Figure 1 shows the January 2021 Big Mac exchange rate. That is the price of a Big Mac in a given country divided by the price in the US. The ICP’s PPP exchange rate is plotted on the horizontal axis. Here too, the value of the common basket in a given country is expressed with respect to its price in the US. Both exchange rates are plotted in logs.
In many cases, the Big Mac and PPP exchange rates are quite close, suggesting that a simple hamburger is an excellent composite good. For example, in China, the Big Mac exchange rate is 4.0, while the ICP PPP exchange rate is 4.2.
Figure 1
The Big Mac data provide useful information but they also have the potential to be misinterpreted.
For example, a Big Mac in the US cost $5.66, while the same burger went for CNY 22.40, or $3.46 at market exchange rates, in China. According to the Economist’s , the Big Mac Index is based on the theory that “… in the long run exchange rates should move towards the rate that would equalize the prices of an identical basket of goods and services (in this case, a burger) in any two countries.”
A simplistic application of the Index would imply that, since Big Macs are close to 40 percent cheaper in China than in the US, the renminbi must be significantly under-valued.
The Big Mac Index rests on one of economics’ oldest theories: the Law of One price, which can be back to French economists in the mid-1700s. It states that the prices of tradable goods in different countries should be similar, differing only in the cost of transportation and taxes.
While one can send out for a hamburger, cross-border deliveries are uncommon and Big Macs really cannot be considered tradable goods. So, is there any value in comparing hamburger prices between countries?
I think there is. In fact, the hamburgers can be giving us important information about non-tradable prices, which are due to cross-country differences in incomes and wages.
According to the Economist’s January 2021 survey, the cheapest Big Macs could be found in Russia ($1.81), while those in Switzerland were the most expensive ($7.29). As Figure 2 shows, Big Macs tend to get more expensive as incomes rise. We use GDP per capita (at market exchange rates) as our measure of incomes.
This is not surprising and is in line with an empirical regularity called the “” after the two economists that independently recognized it in the early 1960s. The idea is that countries with higher incomes per capita tend to be more productive and have a higher level of domestic prices.
Figure 2
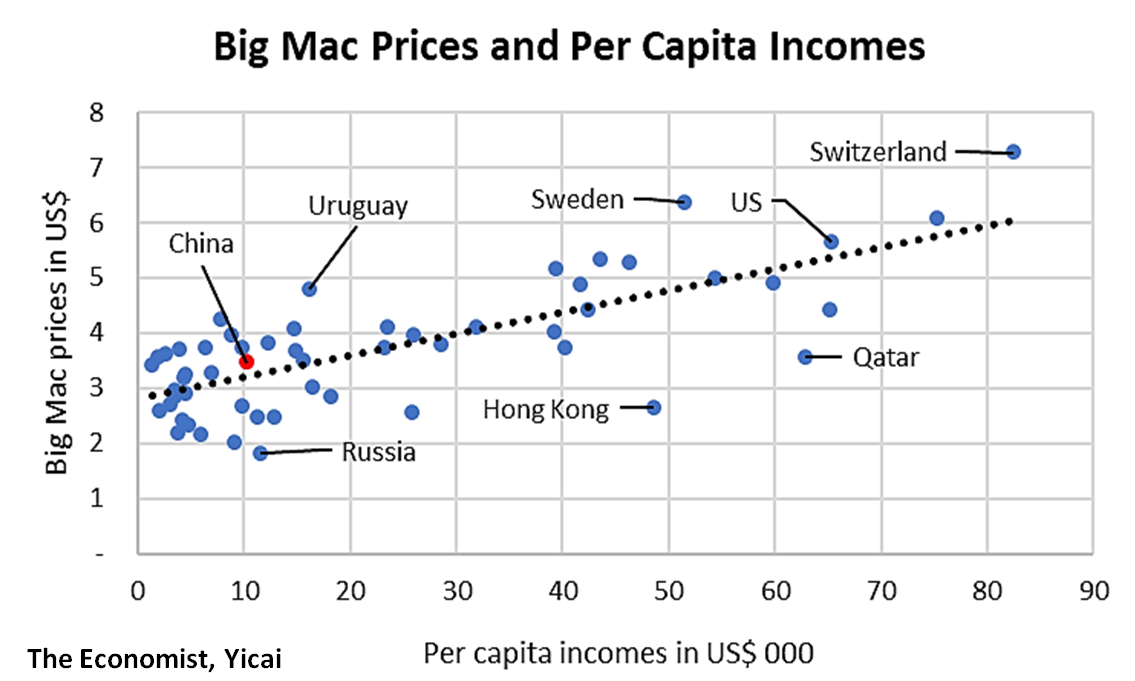
But other factors play important roles too. For example, Sweden and Hong Kong are fairly close in terms of per capita GDP, but Big Macs sell for $6.37 in the former and $2.64 in the latter. I suspect that taxes account for this large difference.
The price of Big Macs in China is just about where one would expect, given the country’s per capita income, implying that the renminbi is fairly valued.
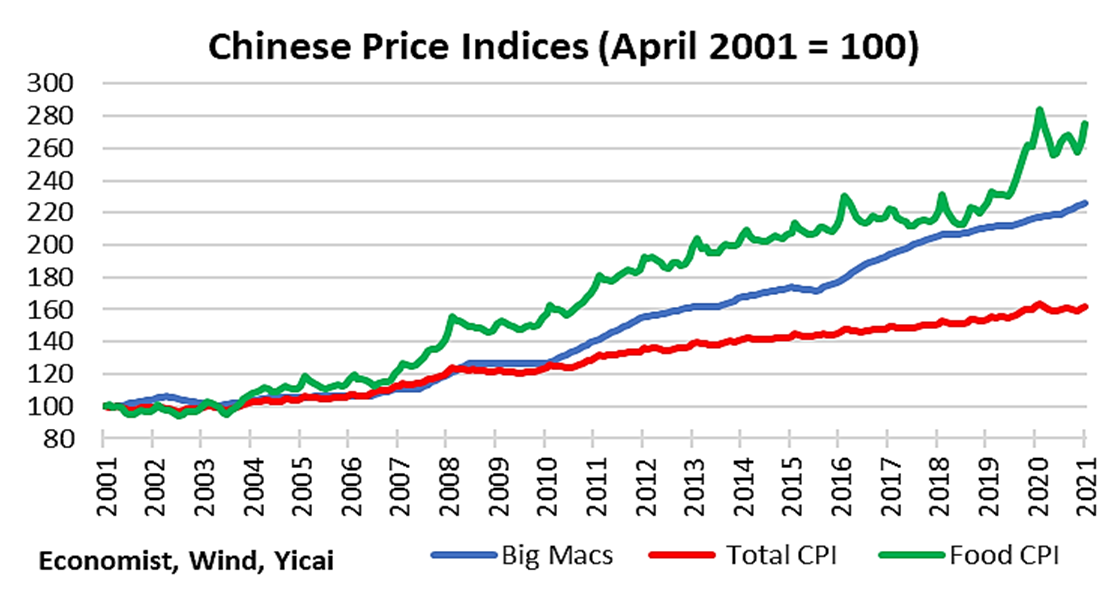
Over the last two decades, Chinese Big Mac prices have increased at an average annual rate of just over 4 percent. That’s significantly faster than that of the general level of consumer prices(+2.5 percent), as calculated by the National Bureau of Statistics.
No surprise here, as Chinese food products have accounted for much of the rise in consumer prices, rising at an average annual rate of over 5 percent. Non-food prices only increased by 1 percent annually. So, over time, Big Macs have become a relatively more affordable way to dine.
Figure3 shows my estimates of the price level indices for the food and non-food components of the consumer price index, as well as for Chinese Big Macs.
Figure 3
The year-over-year price change data indicate that the Big Mac prices no longer simply reflect the costs of beef and buns. Figure 4 shows that there have been four major cycles in Chinese food prices since 2001. Big Mac prices responded to the first three but not the most recent one.
Considering that, this time last year, beef prices were rising by more than 20 percent, it is interesting that the prices of Big Macs were only up 3 precent. This disconnect likely reflects the efforts that firms like MacDonald’s have been putting into improving their supply chains.
Figure 4
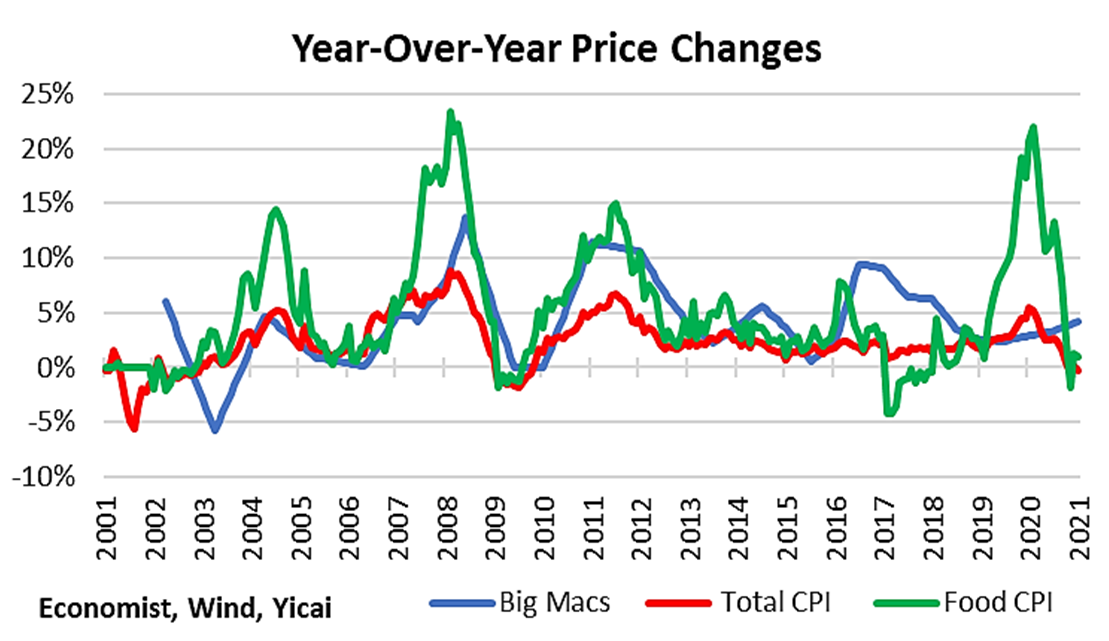
While Big Mac prices have decoupled from those of food, they appear to be sensitive to labour costs. The spike in Big Mac prices in late 2016, when food prices were soft, corresponds to tightness in the Chinese labour market, as reflected in the employment component of the National Bureau of Statistics’s purchasing managers’ indices. Similarly, the low Big Mac inflation in early 2019 corresponds to weakness in those labour market indicators.
Regular readers of this column know that I can talk about data until the cows come home, but I really do believe that Big Mac prices contain much more information than the simple costof a fast food burger.
 Mark KrugerBased in Shanghai, Mark Kruger holds Senior Fellow appointments at the Yicai Research Institute, the Centre for International Governance Innovation and University of Alberta’s China Institute. Between 2020 and 2023, Mark was the Opinion Editor at Yicai Global. Previously, he had a 30-year career with the Bank of Canada in the course of which he served as a Senior Advisor to the Canadian Executive Director at the IMF and the head of the Economic and Financial Section of the Canadian Embassy in Beijing.


