 China’s Economy Exceeded Expectations in Q1
(Yicai) April 27 -- The data recently released by China’s National Bureau of Statistics (NBS) showed that the economy made a surprisingly good start in the first quarter. GDP grew by 5 percent year-over-year, beating market expectations of 4.8 percent growth.
The composition of growth in the first quarter differed from what we saw in 2025. The contribution of investment more than doubled while that of net exports halved. Consumption’s contribution dipped somewhat (Figure 1).
Figure 1
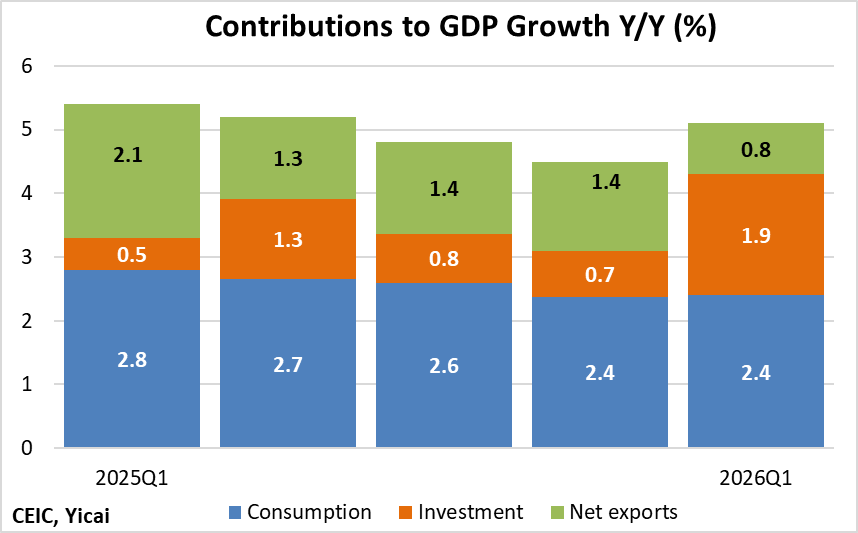
I estimate that investment, on a National Accounts basis, grew by 4.7 percent year-over-year in Q1. This is up sharply from 1.9 percent in 2025 (I derive these estimates by dividing investment’s contribution by its share in GDP).
This rate of growth is much more rapid than that of the NBS’s fixed asset investment measure. That is because the two investment series have important methodological differences. Most notably, the National Accounts measure is on a value-added basis. It only includes assets – buildings, machinery, software and R&D – produced during the reference period. In contrast, fixed asset investment is expenditure-based. It includes the purchase of existing assets – land and capital goods – in addition to those that were newly produced. Moreover, fixed asset investment is measured in nominal terms, while investment on a National Accounts basis is adjusted for price changes.
While it is investment on the National Accounts basis that enters into the calculation of GDP, the NBS only provides sectoral detail for fixed asset investment.
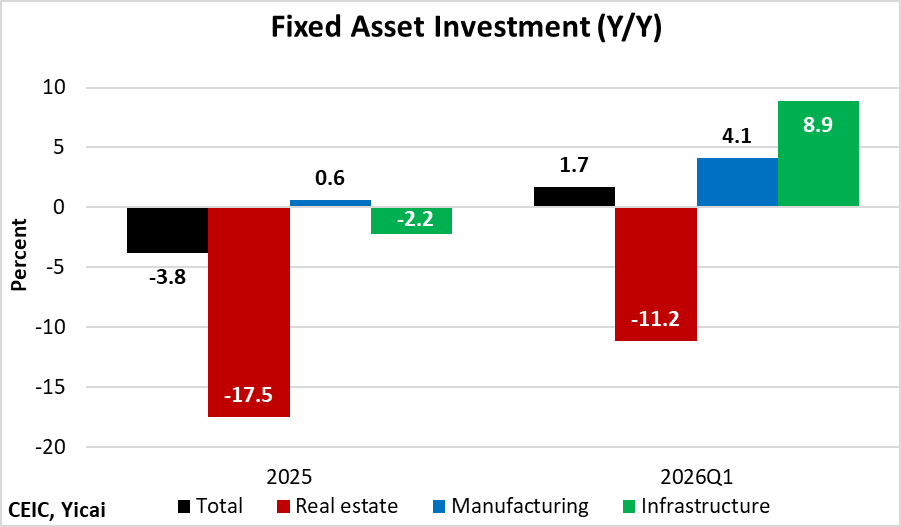
Figure 2 shows that the growth of fixed asset investment rebounded to 1.7 percent year-over-year in the first quarter from a decline of 3.8 percent in 2025. Each of the three components picked up in the quarter, with investment in real estate showing a significantly smaller drop.
According to Wang Changlin, deputy director of the National Development and Reform Commission, pro-investment policies underpinned large-scale equipment upgrades in the manufacturing sector, while rapid growth in aviation and water transport helped to lift infrastructure investment.
Figure 2
The contribution of net exports to GDP growth fell as the increase of imports (+23 percent) outpaced that of exports (+15 percent).
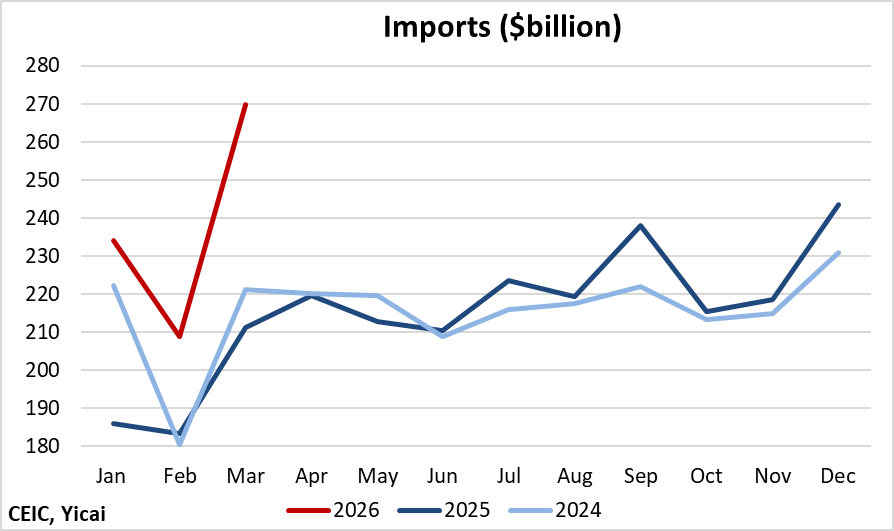
In the first quarter, import growth was driven by large purchases of machinery and equipment, including computers and parts (+50 percent) and integrated circuits (+45 percent). In addition, imports of precious metals rose 263 percent, as residents bought gold in large quantities at record-high prices.
Imports rose particularly rapidly in March, with machinery and equipment and precious metals each accounting for some 40 percent of the overall increase (Figure 3).
Strong imports of machinery and equipment and elevated investment growth bode well for production in future quarters.
Figure 3
While not as rapid as that of imports, export growth in Q1 was almost three times as fast as in 2025.
Exports of mechanical and electrical products rose by 21 percent year-over-year in the quarter, up from 8 percent in 2025. Sales of electric vehicles (+83 percent), integrated circuits (+77 percent), lithium-ion batteries (+55 percent) and computers and parts (+27 percent) accounted for half the increase in China’s overall exports during the quarter.
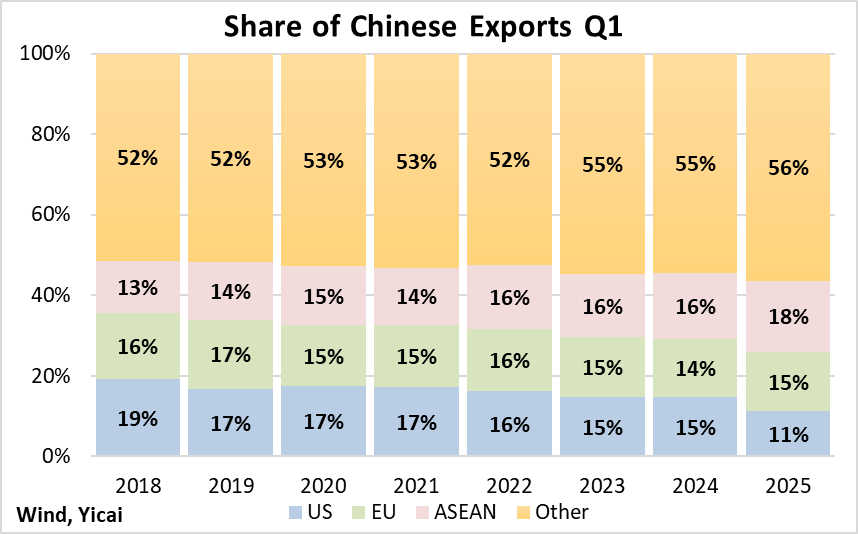
China’s exports turned in a strong performance despite a 16 percent fall in sales to the US. As a result, the US’s share of China’s exports fell to 11 percent, a drop of 4 percentage points from the first quarter of 2025 (Figure 4). Sales to the EU (+21 percent) and ASEAN (+20 percent) accelerated from 2025.
Figure 4
The behaviour of passenger car sales illustrates the stabilizing effect of China’s being able to export to a large selection of diversified markets.
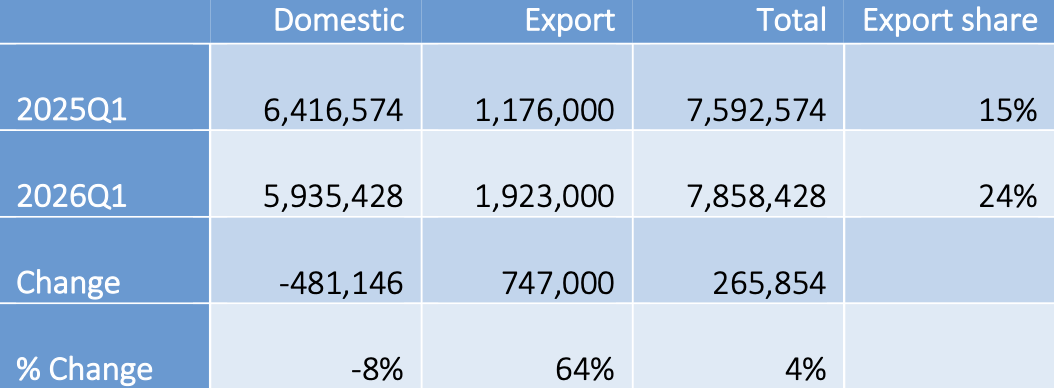
Domestic auto sales declined by 8 percent in the first quarter as subsidies were reduced and trade-in rules were tightened. Sales had been very strong in late 2025 in anticipation of these changes. However, exports of passenger cars jumped by 64 percent, more than offsetting the decline in domestic sales. Exports accounted for 24 percent of China’s passenger car sales in the first quarter, up from 15 percent a year earlier (Table 1).
Table 1
Passenger Car Sales (units)
As a result of the Iran war and the run-up in oil prices, we can expect electric vehicle demand to remain strong. Reuters reports that new battery-electric registrations were up 51 percent year-over-year in major European markets in March, as drivers looked for alternatives to internal combustion engines.
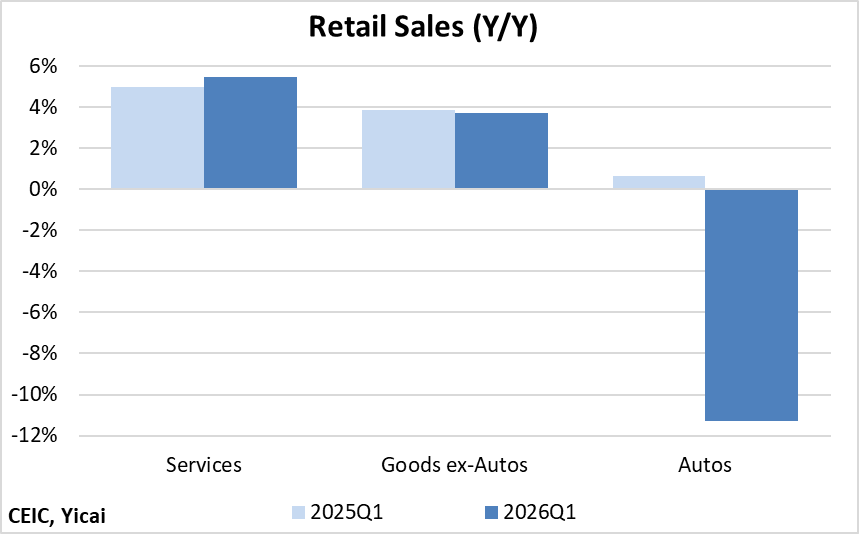
The policy-induced decline in car sales was the major factor weighing on consumption in the quarter (Figure 5). The growth of retail sales of goods ex-autos was similar to a year earlier, while the consumption of services accelerated modestly.
Figure 5
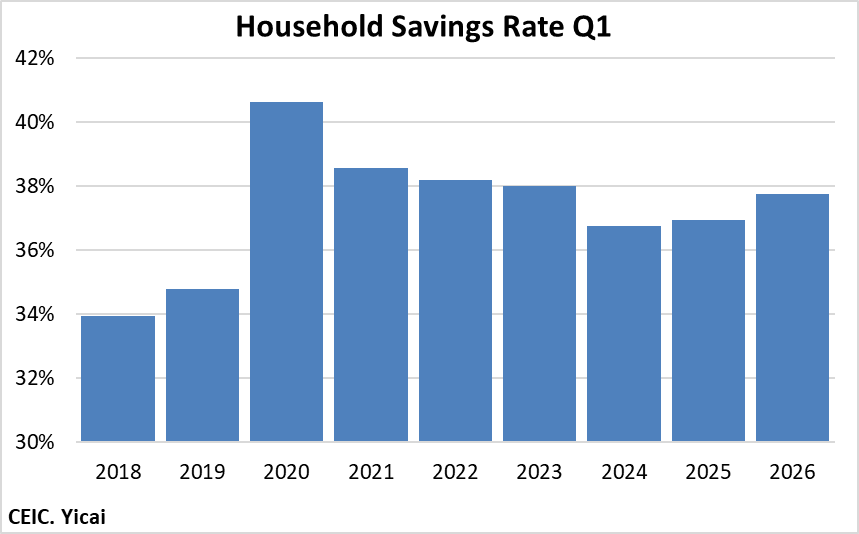
In Q1, the household savings rate jumped by close to a percentage point from a year earlier. While it remains below levels recorded during the pandemic, it is still significantly higher than 2018-19 (Figure 6).
Figure 6
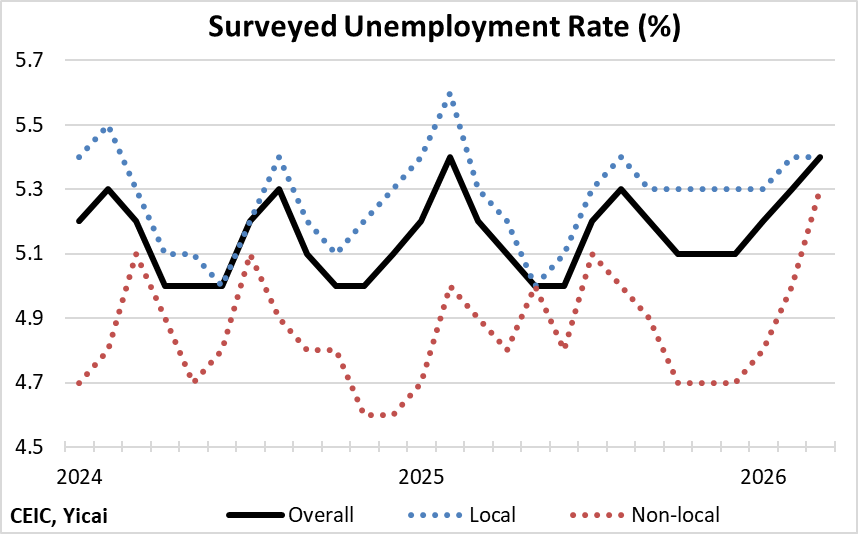
While higher household savings may simply be a reflection of the pullback in the auto sector, they may also be responding to incipient signs of softness in the labour market.
The unemployment rate has risen from 5.1 percent in December to 5.4 percent in March. The unemployment rate for workers with local household registration edged up slightly, but the increase was much sharper for those with non-local registration.
Non-local workers typically have more flexible contracts and they tend to be the first hired and the first fired. Thus, the 0.6 percentage point increase in their unemployment rate bears careful monitoring (Figure 7).
Figure 7
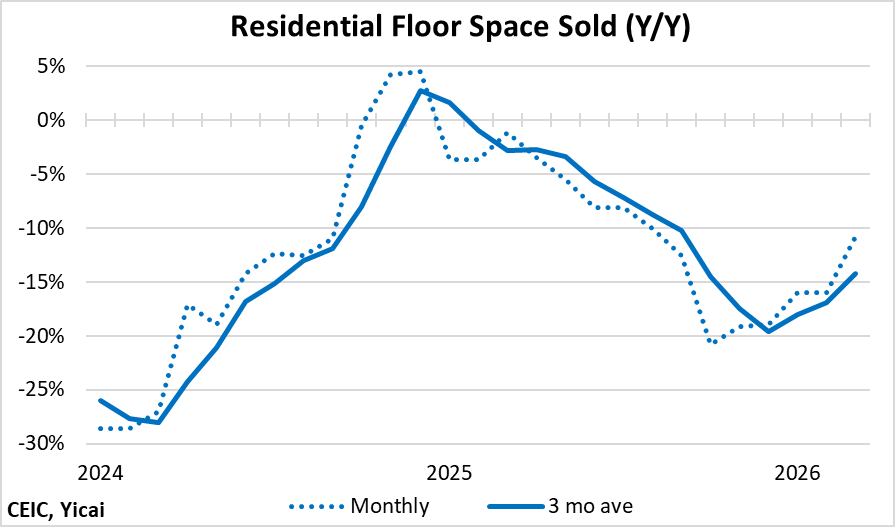
The correction in the property market continued in the first quarter, with sales (-13 percent) and starts
(-22 percent) continuing to fall.
There are emerging signs that the rate of decline of sales is slowing. What is not clear is if this trend will be long-lived or if it represents the sort of “false spring” we saw toward the end of 2024 (Figure 8).
Figure 8
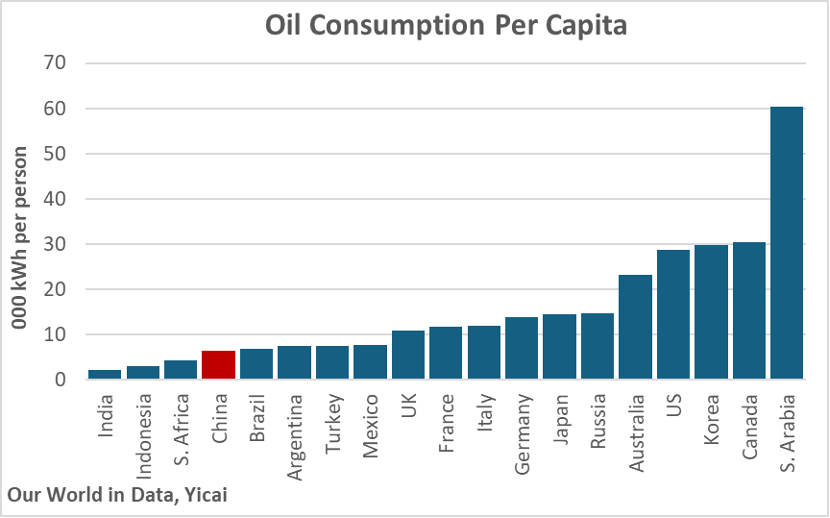
Looking ahead, the war in Iran and higher oil prices will weigh on economic growth. China’s economy is not especially oil-intensive. Per capita oil consumption is only 42 percent of the G20 median (represented by France in Figure 9). Nevertheless, as countries pay more for oil, natural gas and other products, there will be fewer funds available to buy China’s exports.
Figure 9
While no one profits from the conflict, there are some silver linings for China.
First, as with the case of electric vehicles discussed above, the supply chain uncertainty caused by the blockage of the Straight of Hormuz will likely renew interest in solar and wind power. And China is a key producer and exporter of these technologies.
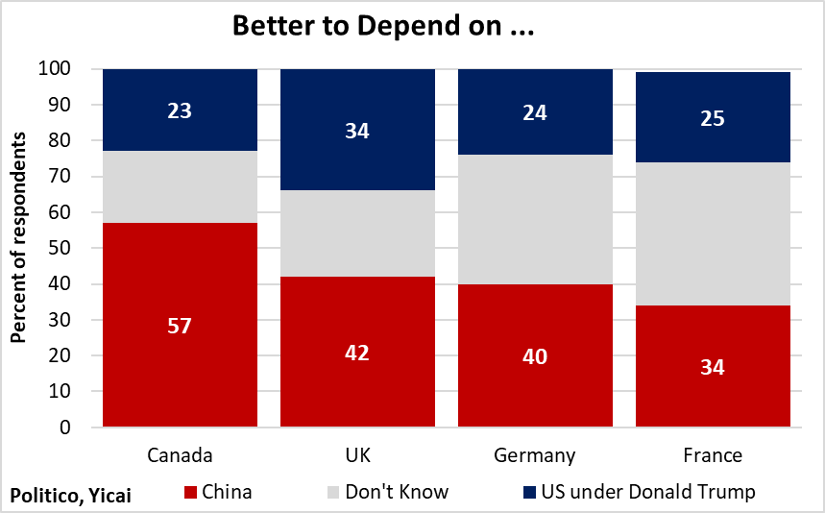
Second, President Trump has tarnished the US’s reputation. A survey conducted by Politico – based on more than 2000 respondents in each of Canada, the UK, Germany and France – shows that a majority believe it is better to depend on China rather than the US under Donald Trump (Figure 10). The polling was conducted from February 6 to 9, before the US and Israel attacked Iran. Since the war is deeply unpopular, it is likely that international opinion has shifted even further toward China since then.
The improvement in perceptions of China is likely to lead to deeper trade and investment ties with the rest of the world. Indeed, Beijing has hosted numerous world leaders this year – including many of the US’s traditional allies – as countries look to recalibrate their relationship with China. These renewed ties have the potential to offset some of the dislocation caused by the conflict in Iran.
Figure 10
 Mark KrugerBased in Shanghai, Mark Kruger holds Senior Fellow appointments at the Yicai Research Institute, the Centre for International Governance Innovation and University of Alberta’s China Institute. Between 2020 and 2023, Mark was the Opinion Editor at Yicai Global. Previously, he had a 30-year career with the Bank of Canada in the course of which he served as a Senior Advisor to the Canadian Executive Director at the IMF and the head of the Economic and Financial Section of the Canadian Embassy in Beijing.


