 How is China’s Economy Shaping Up in the Fourth Quarter?
(Yicai) Nov. 3 -- China’s National Bureau of Statistics (NBS) recently gave us our first peak at the economy’s performance in the fourth quarter. The news was not encouraging as October’s readings for both the manufacturing and non-manufacturing (PMIs) dipped below their September levels (Figure 1).
Figure 1
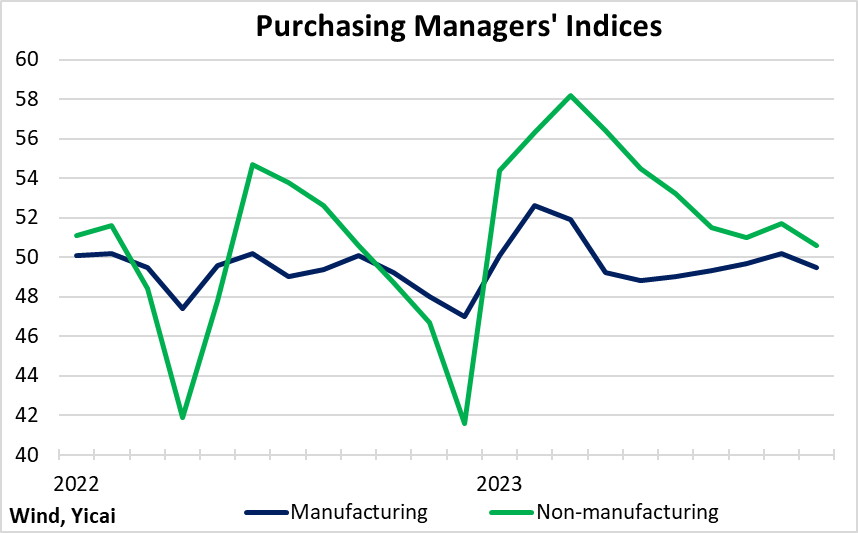
To construct the PMIs, the NBS asks company officials if economic conditions are currently better, worse or unchanged compared to those in the previous month. Given the modest drop in producer sentiment, should we be concerned that China’s recovery is losing steam?
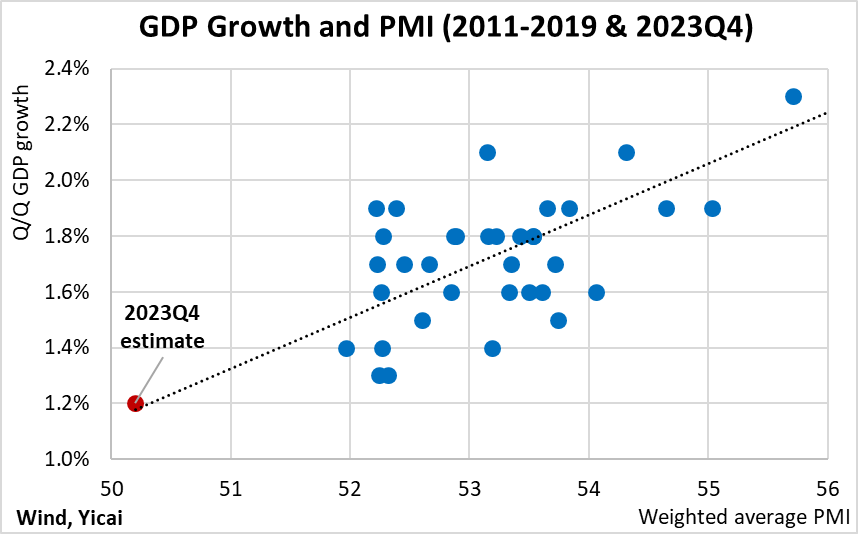
While the PMIs are positively related to GDP growth, the correlation is far from perfect. The blue dots in Figure 2 show the correspondence between quarter-over-quarter GDP growth and the quarter’s average PMI reading for the pre-pandemic period (2011Q1 to 2019Q4). The PMI measure used here is a weighted average of the manufacturing and non-manufacturing indices.
On average, over this sample, the level of the PMIs predicted just under half the rate of quarterly GDP growth. However, there has been a lot of variation. For example, PMI readings in the range of 52.3 were associated with quarterly GDP growth as low as 1.3 percent and as high as 1.9 percent.
Some of the PMIs’ lack of accuracy comes from the survey’s design. Company officials can respond “better’ or “worse” but there is no scope for them to indicate how much better or worse conditions are compared to the previous month. This made the PMIs particularly unreliable predictors during the pandemic when the quarterly swings in output were very large.
While recognizing the uncertainties in the PMI data, we can still use the relationship presented in Figure 2 to predict how fast GDP will grow in the fourth quarter. Assuming the average PMI reading remains at its October level, the historical relationship suggests that quarterly growth in Q4 will be 1.2 percent (as illustrated by the red dot in Figure 2).
Growth of 1.2 percent is quite slow compared to the pre-pandemic sample. However, 1.2 percent at quarterly rates is 4.9 percent at annual rates. Most economists would put China’s potential growth rate somewhere between 4 and 5 percent. This means that despite the relatively weak PMI readings, GDP growth remains broadly on trend.
Figure 2
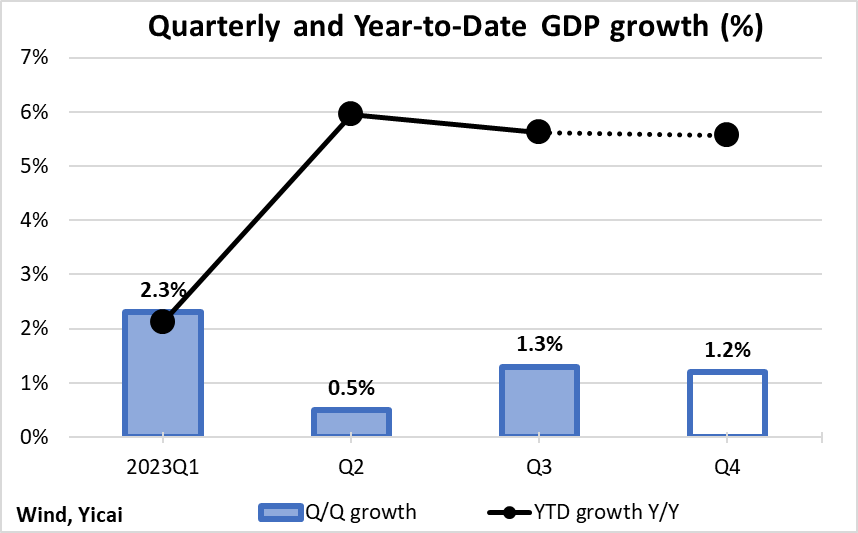
While growth of 1.2 percent in Q4 would be slightly slower than the average of the first three quarters, it would be more than sufficient to meet the government’s target of “around 5 percent” for the year as a whole (Figure 3). Indeed, should the fourth quarter come in at 1.2 percent, growth for the year would be 5.6 percent.
Figure 3
At 5.6 percent, growth would modestly exceed current expectations for 2023. However, looking back to the beginning of the year, we might have expected an even stronger outcome given last year’s weakness.
Figure 4 shows the headline GDP numbers for the last several years as well as an estimate for trend growth. Over 2018-19, GDP growth averaged just over 6 percent. In 2020-21, the average dipped to 5½ percent. Let’s assume that trend growth continued to fall to an average of 5 percent over 2022-23. Given the slowdown in 2022, we might have assumed that the economy should have rebounded to 7 percent this year.
Figure 4
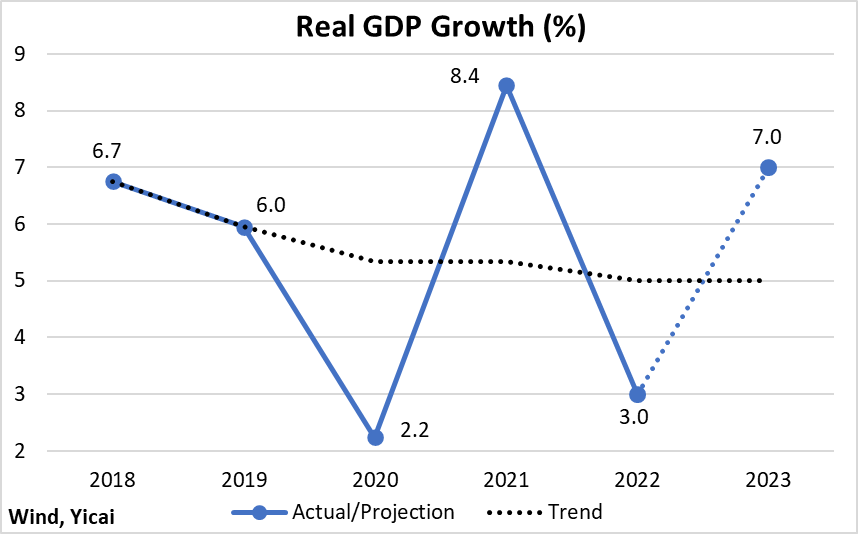
In fact, GDP growth this year will be closer to 5 than 7 percent because the economy has been hit by two major shocks.
The first of these is the weakness in foreign demand resulting from higher interest rates in China’s trading partners. Higher rates mean that consumers in these countries have to pay more to service their debts and have less money left over to purchase China’s exports. The NBS estimates that weaker net exports took some 0.7 percentage points off of growth in the first three quarters of the year.
The second shock is the downturn in the property market. Using the area of floor space under construction to measure real estate activity, I estimate that property market weakness has taken about 1.3 percentage points off of growth so far this year.
The NBS reported 5.2 percent growth for the year-to-date. The combined effect of the two shocks was to take 2 percentage points off of growth. Thus, these two shocks go a long way to explaining the difference between the 7 percent we might have naively expected and the actual outturn.
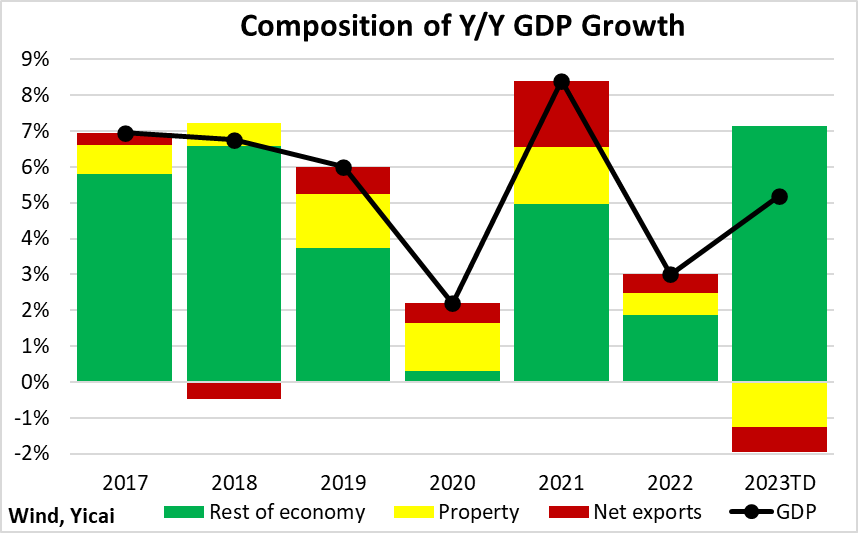
Figure 5 provides a historical perspective of the contributions net exports, the property market, and the rest of the economy made to GDP growth. What I want to emphasize here is that abstracting from these shocks – which are significant – the growth of the rest of the economy is very much in line with pre-pandemic rates.
Figure 5
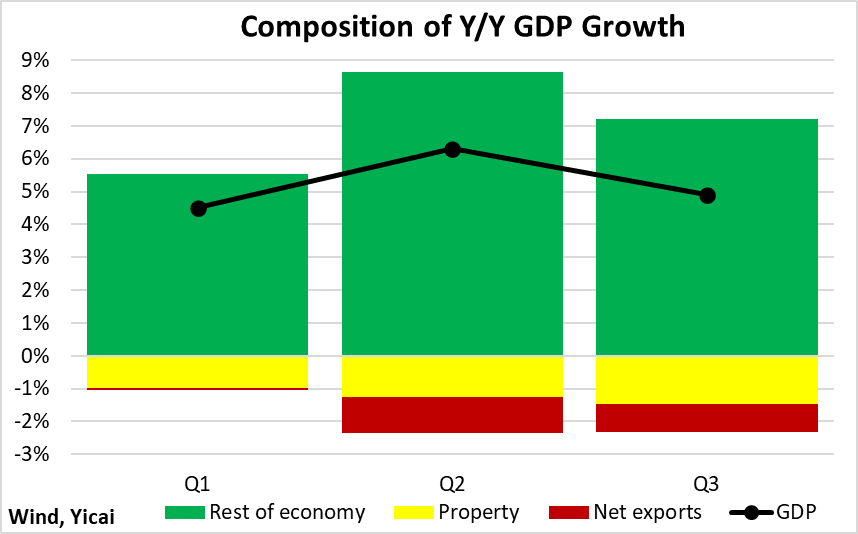
Focusing on each of this year’s quarters, we see that the magnitude of the two shocks increased over time but that the rest of the economy has remained fairly resilient (Figure 6). This provides a good starting point for the fourth quarter.
Figure 6
Looking ahead, the contractionary effects of the net export and property market shocks could still grow.
While policy rates in China’s major trading partners may have peaked, their effect on consumption could still increase as more mortgages are renewed at higher costs. This points to continued headwinds for China’s exports.
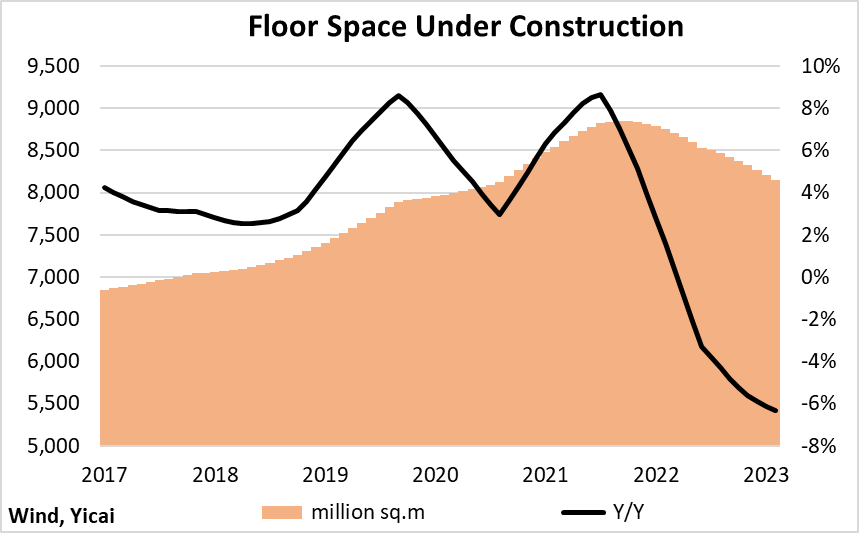
Similarly, we see that the decline in floor space under construction has not yet troughed (Figure 7). This indicates that the weakness in the property market could put increased downward pressure on the economy in coming quarters.
Figure 7
There are, however, two positive developments that could provide something of an offset.
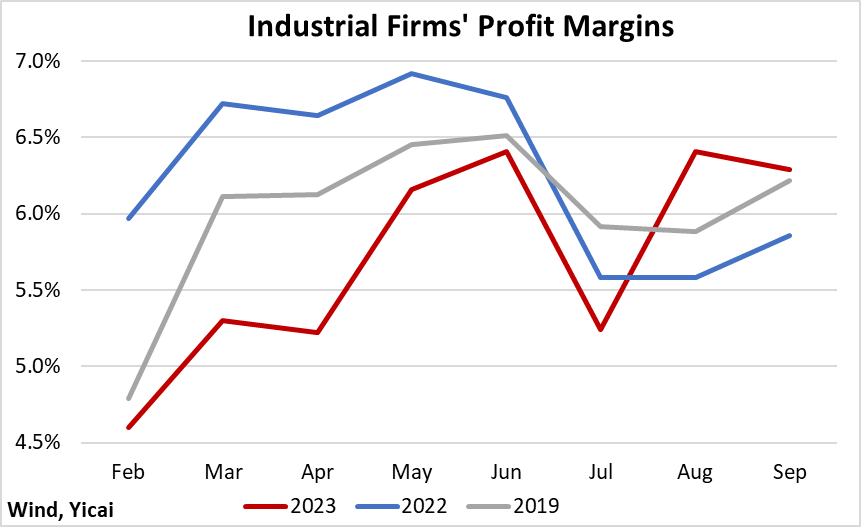
First, industrial firms’ profit margins strengthened in August and September and exceeded both last year’s and pre-pandemic levels (Figure 8). Industrial output appears to be positively related to profitability. Thus, a more favourable operating environment could well support increasingly robust factory activity in coming months.
Figure 8
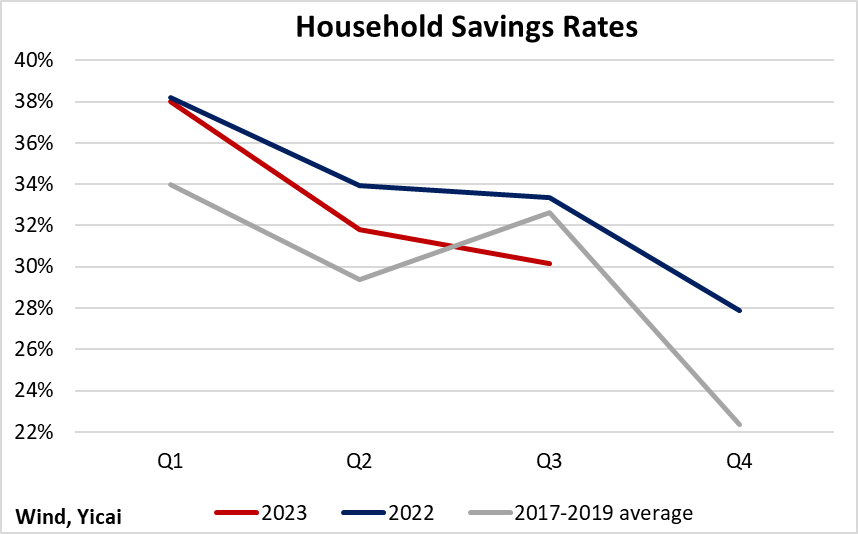
Second, households are becoming more confident and increasingly willing to spend. Precautionary savings are falling. Savings remained elevated in Q1 but they dropped toward pre-pandemic levels in Q2. They fell further in Q3 – to below their 2017-19 average (Figure 9). The additional release of pent-up demand, such that the household savings rate falls well below last year’s levels in Q4, could provide an important boost to the economy.
Figure 9
To summarize, as it enters the fourth quarter, China’s macroeconomy faces a complex environment with both negative and positive aspects. The bad news is that the effects of the external demand and property market shocks could grow in coming quarters. The good news is that, notwithstanding these shocks, resilience elsewhere in the economy is keeping growth close to the 5 percent trend.
 Mark KrugerBased in Shanghai, Mark Kruger holds Senior Fellow appointments at the Yicai Research Institute, the Centre for International Governance Innovation and University of Alberta’s China Institute. Between 2020 and 2023, Mark was the Opinion Editor at Yicai Global. Previously, he had a 30-year career with the Bank of Canada in the course of which he served as a Senior Advisor to the Canadian Executive Director at the IMF and the head of the Economic and Financial Section of the Canadian Embassy in Beijing.


