 Faster, Higher, Stronger: Comparing Economic Recoveries
Olympic fever has taken hold of our family.
My daughters are captivated by the exploits of Chinese freestyle skier . My wife has been scouring the internet in hopes of buying a mascot and I am closely following the fortunes of Canada’s .
For those of a mercantilist bent, economic development is seen as a sort of Olympic-style competition. And, with China, the US and the EU all having reported their national accounts for 2021, they would award medals for the fastest recovery, the highest GDP and the strongest economic performance.
Let’s have a look at how the recoveries compare.
The three panels in Figure 1 show the evolution of quarterly real GDP versus its pre-pandemic (2018-19) trend for China, the US and the EU. We can think of the trend as a crude measure of these economies’ productive capacity and actual GDP as representing aggregate demand. We have set both actual GDP and the trend to equal 100 in 2019 Q4, which was the pre-pandemic peak.
Three observations emerge from these graphs.
First, GDP in each of the major economies has now surpassed its pre-pandemic peak, although the EU just barely crosses the 100 line.
Second, China’s GDP has grown the fastest from 2019 Q4. Its GDP is 10 percent higher than its pre-pandemic peak, while those of the US and the EU are up 3 percent and 0.4 percent, respectively. China’s faster growth is hardly surprising. It had a much higher rate of trend growth going into the pandemic (6 percent) than either the US (3 percent) or the EU (2 percent).
Third, as at the end of 2021, actual GDP in all of the major economies remained below trend. This suggests that all of the major economies are suffering from a shortfall in aggregate demand compared to productive capacity. The gap was the smallest in the US (-1.8 percent), followed by China (-2.3 percent) and then the EU (-2.5 percent).
Figure 1
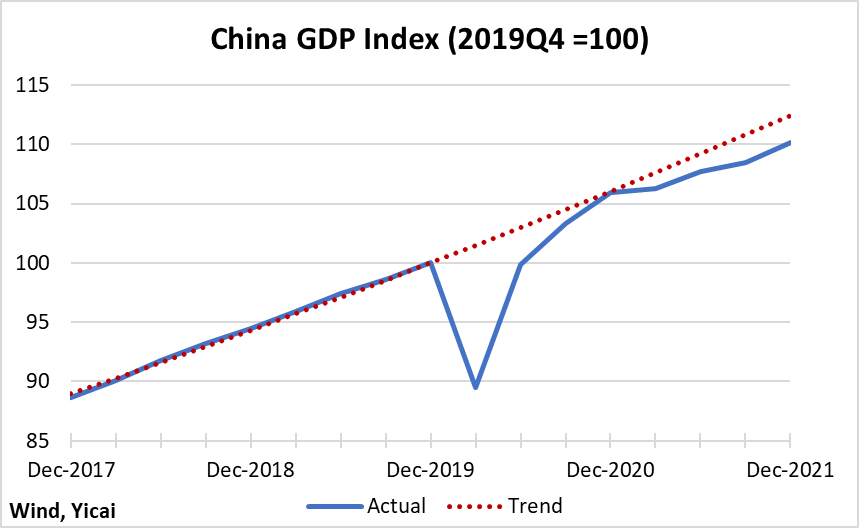
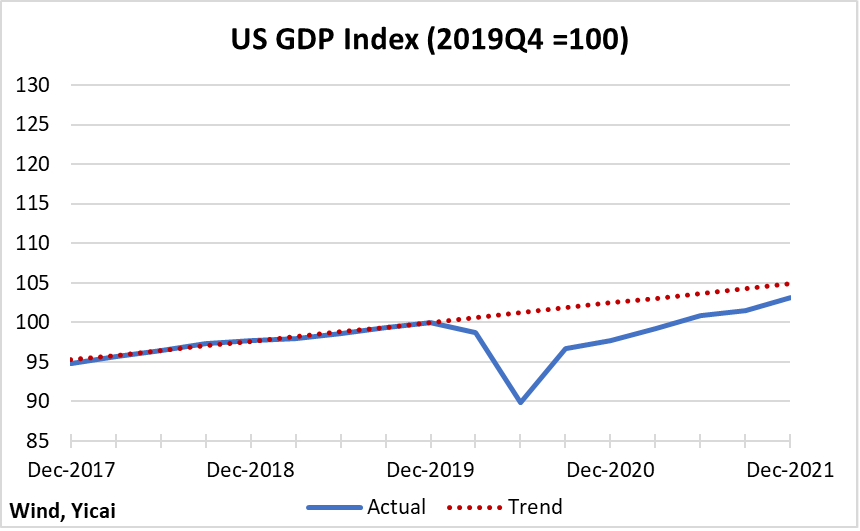
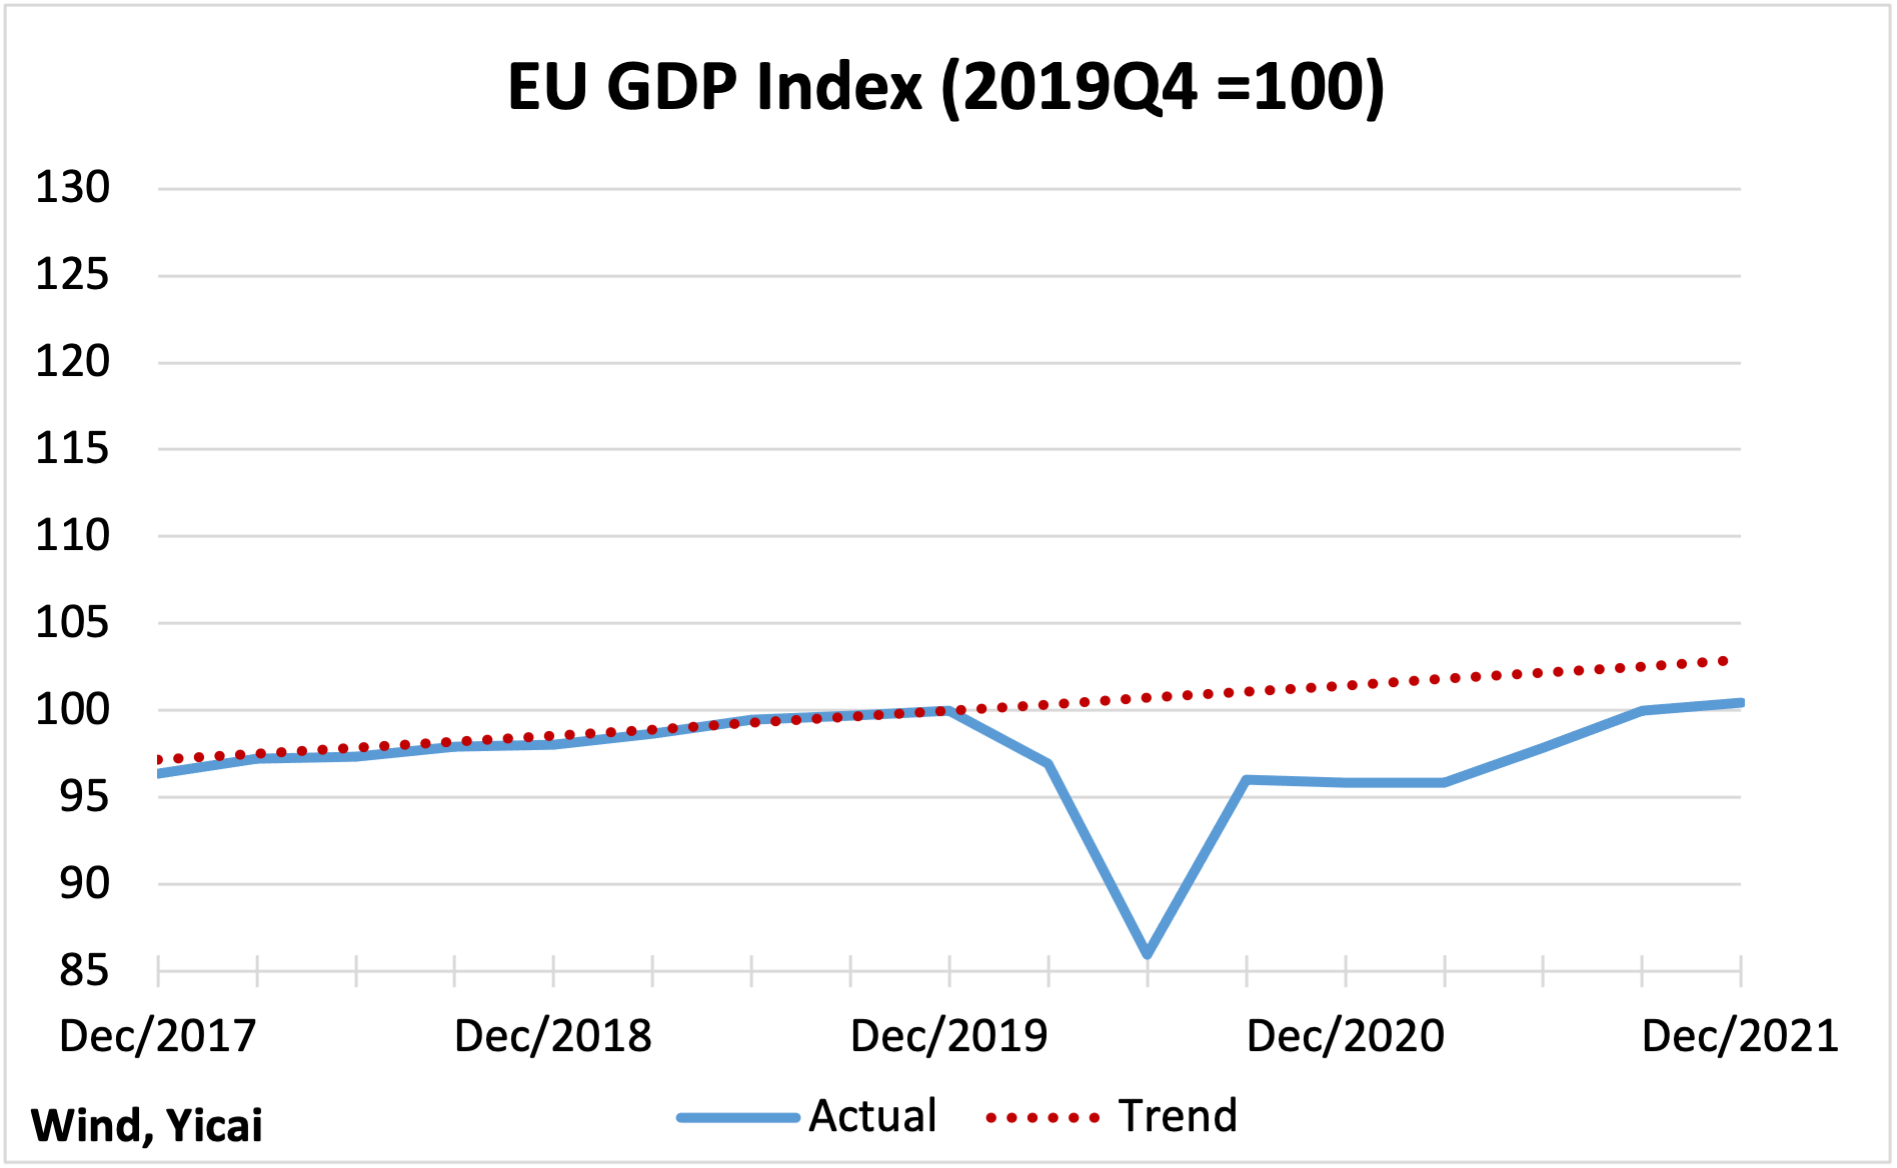
It is worth pointing out that while GDP in the US and the EU appear to be slowly heading back toward their trends, China’s GDP had essentially returned to trend at the end of 2020 and subsequently veered away.
China’s below-trend growth in 2021 appears to be policy-induced. Fiscal policy was a significant drag on growth. The government’s deficit was CNY1.9 trillion smaller than in 2020 and even CNY400 billion smaller than in 2019. Moreover, monetary policy tightened. Credit growth slowed to 10.3 percent, year-over-year, in December from 13.3 percent in December 2020 and 10.7 percent in December 2019, as the authorities turned their attention from supporting the economy to reining in financial risks. Finally, the consistent application of the Three Red Lines policy weighed on both the supply of and the demand for residential real estate.
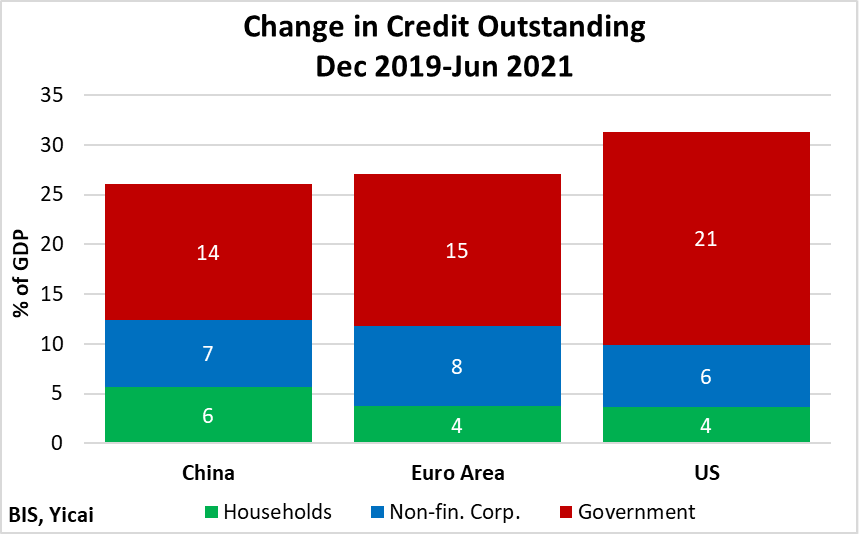
China’s policy retrenchment comes after having provided significant support to offset the contractionary effects of the pandemic. Overall credit outstanding jumped by 26 percent of GDP between the end of 2019 and mid-2021 (Figure 2). In comparison, indebtedness had only risen by 7 percent of GDP over the previous three years. Government borrowing accounted for just over half of the increase, with the rest pretty evenly split between households and non-financial corporations.
In the Euro Area, the scale of credit growth and its composition were pretty similar to what we saw in China. In the US, the increase in credit was 10 percent of GDP larger, with government borrowing playing an outsized role.
Figure 2
With Chinese policy already having retrenched, it should be fairly neutral in 2022. In contrast, macroeconomic policy is widely expected to tighten in both the US and Europe as inflationary pressures rise.
Current inflation dynamics are somewhat unusual as price increases are accelerating even though GDP remains below trend. This means that, in the short run at least, supply constraints are keeping the economies’ productive capacity below the levels implied by the trend.
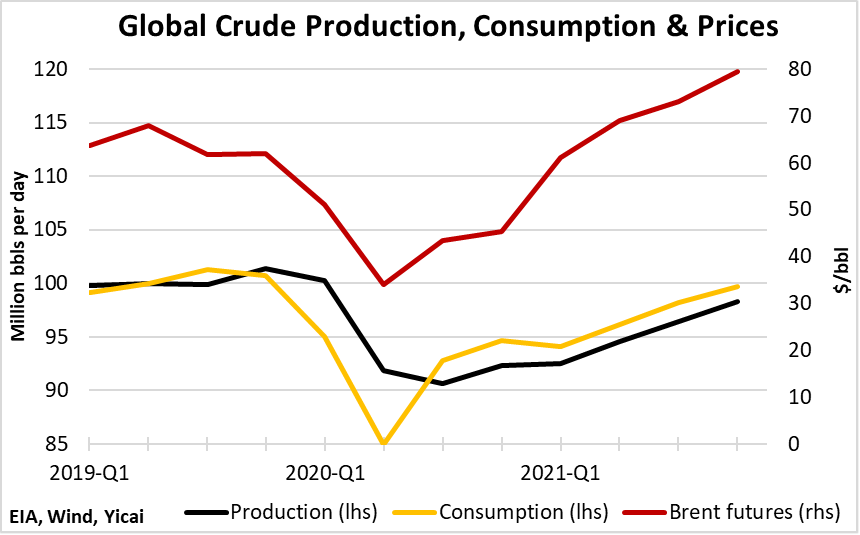
The global oil market best illustrates the interplay between weak supply and rising prices. With the outbreak of the pandemic, global oil consumption contracted and Brent oil prices fell sharply (Figure 3). Since mid-2020, oil production has not kept up with the recovery in consumption. Inventories fell and prices began to rise.
Even though OPEC+ continues to increase its production quota, supply constraints are limiting the cartel’s ability to produce. In early February, Brent prices broke USD90. Crude oil is currently close to 60 percent more expensive than a year ago, as prices have reached their highest level since mid-2014.
Figure 3
Supply constraints, which prevent goods from reaching their destination in a timely manner, are playing a broader role in raising prices. According to the , these disruptions have been “particularly severe” in the US as its consumers shifted their purchases from services to goods especially rapidly. This led to a large imbalance between strong demand and constrained supply and explains why core (ex-food and energy) inflation has risen more sharply in the US than in the EU or China (Figure 4).
Figure 4
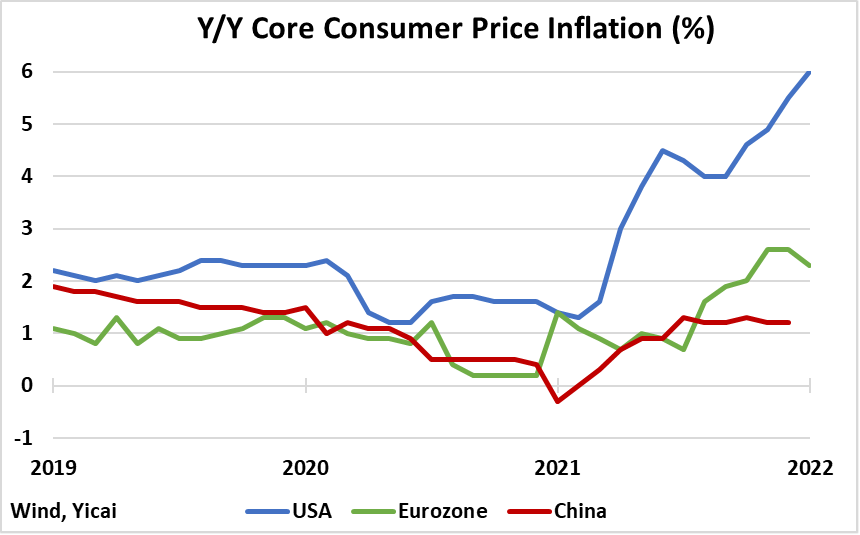
With US core and headline inflation at 6 and 7½ percent respectively, the Federal Reserve is in a bit of a bind. Monetary policy is an effective tool for adjusting aggregate demand. But the inflationary pressures are coming from supply constraints, which are weighing on the economy’s productive capacity.
The Fed had been taking a wait-and-see approach, hoping that the supply constraints would prove temporary. Now the risk is that expectations of high inflation will become entrenched and monetary policy will have no choice but to reduce aggregate demand to a level that is consistent with constrained productive capacity.
However, as was pointed out in an excellent by the Brookings Institution, US policymakers have other options. To explain inflation dynamics and possible policy responses, podcast host David Dollar interviewed Don Kohn. Kohn is a true expert on US monetary policy. He worked at the Fed for four decades and rose to be Vice Chairman of its Board of Governors. Kohn said that the Biden Administration could reduce the tariffs imposed by its predecessor. Tariff reductions would lower the cost of imports and have “a very direct impact on prices in the US.”
Kohn is not alone in recognizing the benefits – to Americans – of reducing the Trump Administration’s tariffs. A group of 41 Democrat and Republican senators recently US Trade Representative Katherine Tai to exclude more imports from the tariffs. In particular, they requested that Tai exclude products “for which imports from China represent nearly all imports to the United States.” The senators noted that the “exceptional reliance on China for those specific imports suggests that moving these supply chains out of China is uniquely unlikely, and that our efforts to diversify production locales and reshore manufacturing would be better spent on other products.”
Indeed, from a global perspective, the mercantilist analogy between the Olympics and the economy breaks down. At the microeconomic level, we do see firms battling to gain market share in the same sort of way that athletes compete.
At the macroeconomic level, however, countries’ inter-dependence becomes much more evident. Your exports are my imports. And we both benefit from the economies of scale inherent in larger markets. Your technological innovation could just be the breakthrough I needed for my own invention. And we both benefit from the free flow of technology. Conversely, your pollution affects my environment. And we both benefit from global rules that protect our planet.
It is, no doubt, recognition of this deep interconnection that inspired the International Olympic Committee to revise its from the “Faster, Higher, Stronger” that Pierre de Coubertin first proposed back in 1894 and to add the word – “Together”.
 Mark KrugerBased in Shanghai, Mark Kruger holds Senior Fellow appointments at the Yicai Research Institute, the Centre for International Governance Innovation and University of Alberta’s China Institute. Between 2020 and 2023, Mark was the Opinion Editor at Yicai Global. Previously, he had a 30-year career with the Bank of Canada in the course of which he served as a Senior Advisor to the Canadian Executive Director at the IMF and the head of the Economic and Financial Section of the Canadian Embassy in Beijing.


