


 Is the Renminbi Really Undervalued?
(Yicai) July 8 -- Last month, European Central Bank President Christine Lagarde told a Brussels audience that global leaders needed to talk about the renminbi.
Citing IMF research, she said China's currency was undervalued by 15 to 16 percent once its exchange rate was adjusted for cross-country inflation differences. Her comments came days after a G7 summit in France that made global imbalances a priority, though without formally addressing currency valuation. They were, however, in the same vein as a February 2026 report from a French government body – the Haut-Commissariat à la Stratégie et au Plan – that put the undervaluation figure even higher, in the 20-to-25-percent range.
Jian Junbo, director of the Center for China-Europe Relations at Fudan University, dismissed Lagarde’s remarks as Europe deflecting attention from its own competitiveness problems rather than a serious economic diagnosis of exchange rate dynamics.
The People's Bank of China (PBOC) had made its own case months earlier. In March, Governor Pan Gongsheng told the China Development Forum that Beijing had “no need — and no intention — to use currency depreciation to gain trade competitiveness.” The PBOC's policy, he said, is to let the market drive the exchange rate, with the central bank only stepping in to smooth out speculation and prevent destabilizing swings.
The Europeans say that there is a gap between where the renminbi trades and what “fundamentals” say its value should be. We tested a simple version of this proposition, using the April 2026 edition of the IMF's World Economic Outlook database, to see whether a simple cross-country comparison supports the undervaluation story.
The underlying logic of our analysis traces back to the law of one price. In a frictionless market, identical goods should cost the same everywhere, once prices are converted to a common currency. For example, an ounce of silver should cost the same in New York and Paris, otherwise silver would be bought in the cheaper city and sold in the more expensive one until such arbitrage ensured the prices were equal.
The Economist's Big Mac Index is an application of this logic. It compares the price of a McDonald's burger across countries. In January, a Big Mac cost about $5.80 in the US. The same hamburger cost CNY 25.50 in China. So, the exchange rate, in terms of Big Macs is 4.40 renminbi per US dollar. In contrast, the market exchange rate in January was 7.0 renminbi per US dollar.
The law of one price says the same good should trade at the same price in all markets. But a dollar’s worth of hamburger only required CNY4.40 while in the foreign exchange market, a dollar can purchase CNY7.0. Does that mean the renminbi is undervalued by 37 percent ([4.40-7.0]/7.0)?
Part of this 37 percent gap likely reflects the fact that a Big Mac is not a tradable good in the way an ounce of silver is. Its price is dominated by local rents, wages, and other non-tradable inputs, which the law of one price and arbitrage cannot equalize across borders.
Economists, looking around the world, have long known that prices in poorer countries are almost always lower than those in richer ones. A haircut, a restaurant meal, or an hour of labor costs less in Lagos than in Zurich.
This isn't a policy distortion. The price level differences follow from the Balassa-Samuelson effect, named after economists who discussed this empirical fact in two papers published in 1964. Bela Balassa and Paul Samuelson showed that countries with higher productivity in their tradable sectors tend to have higher wages economy-wide. Since workers in non-tradable sectors are not correspondingly more productive — it always takes four musicians to play a string quartet – the higher wages get passed through as higher prices for non-tradable goods and services.
To facilitate comparisons of different countries’ price levels, economists at the World Bank construct a basket of precisely defined goods and services that are comparable across economies and represent an important part of final purchases. This allows us to create an exchange rate in terms of a broader set of expenditure items than a hamburger. This purchasing power parity (PPP) exchange rate is expressed in international dollars and it tells you how many units of this currency it takes to buy what $1 buys in the US.
We can measure the relationship between countries’ incomes and their price levels directly. First, we calculate the “price level ratio” by dividing the PPP exchange rate by the market exchange rate. Then, we graph the price level ratio against per capita incomes in current US dollars for 167 countries (Figure 1). We find what Balassa and Samuelson did some sixty years ago: richer countries have higher price levels. Indeed, per capita income explains close to two-thirds of the cross-country variation in domestic prices.
Figure 1
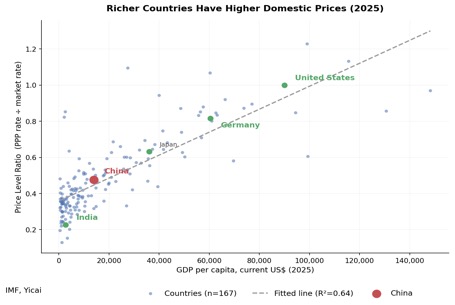
China's price level ratio in 2025 was only 48 percent as high as the United States. This means a US dollar converted to renminbi and spent in China buys roughly twice as much as it would in the United States. That pattern lets us ask a sharper question: for a country as rich as China, what price level would we normally expect? The dashed line in Figure 1 is our best estimate of that "normal" level at every income and so we can check whether China sits above it, below it, or right on it. China's actual ratio comes in just a touch above that line, which means its price level is almost exactly where you'd expect a country at its income level to be. This is not evidence of a currency being held artificially cheap.
Looking only at income is a blunt way to judge a currency. The IMF's own assessments, which produced the 15-to-16-percent estimate Lagarde cited, incorporate many factors, not simply income.
We extended our regression with two additional variables directly implicated in standard price level stories: gross national savings (as a percent of GDP) and government expenditure (as a percent of GDP).
The savings variable is the key one. China's exceptionally high savings rate is thought to suppress domestic consumption and, with it, the price of nontraded goods and services. This holds the currency's real value down even as the economy grows.
The government expenditure variable works the other way. Government spending goes largely toward services that must be produced locally — teachers, healthcare workers, public administrators — so a bigger public sector tends to push the domestic price level up, not down.Both of these variables hold up statistically and including them, along with per capita GDP, meaningfully sharpens the picture.
China's savings rate is 42.5 percent of GDP, roughly double the typical rate for a country at its income level. That puts it in the 98th percentile of all countries in the sample. Given how strongly the model penalizes high savings, it predicts China should have an especially low price level ratio: 0.411, meaning a dollar should stretch nearly two and a half times as far in China as in the US. But China's actual ratio, 0.476, only stretches about twice as far.
Government spending plays a much smaller role in China's story than savings does. China's government expenditure is 32.9 percent of GDP, at the 59th percentile of the sample. It nudges China's predicted price level up slightly, but it isn't doing any special work to explain why China looks different from what the model expects.
Put plainly, once we control for the single fundamental most often cited as the mechanism behind renminbi undervaluation — China's enormous savings rate — its currency looks slightly stronger relative to fundamentals, not weaker.
Our analysis is based on 2025 data. This year, the renminbi has strengthened against the dollar, from an average of about 7.14 per dollar in 2025 to 6.82 in June 2026, an appreciation of roughly 4.6 percent (Figure 2).
Figure 2
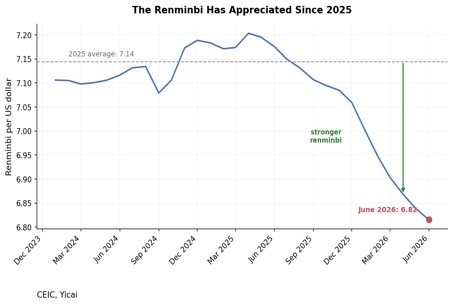
If the renminbi was not undervalued in 2025 by the measure in this analysis, it is most likely even less undervalued now.
None of this settles the argument Lagarde and Beijing are having. That would take a richer model than ours. But it's a reminder that the extent of undervaluation people cite — 15 to 16 percent, or 20 to 25 percent — depends entirely on the model that produces it. Indeed, the IMF's own currency-specific models put the renminbi's undervaluation at just 6 percent. Staff judgment was added to arrive at the 15-to-16-percent number.
 Mark KrugerBased in Shanghai, Mark Kruger holds Senior Fellow appointments at the Yicai Research Institute, the Centre for International Governance Innovation and University of Alberta’s China Institute. Between 2020 and 2023, Mark was the Opinion Editor at Yicai Global. Previously, he had a 30-year career with the Bank of Canada in the course of which he served as a Senior Advisor to the Canadian Executive Director at the IMF and the head of the Economic and Financial Section of the Canadian Embassy in Beijing.