


 Q2 GDP: Growth Slows But No Need to Panic
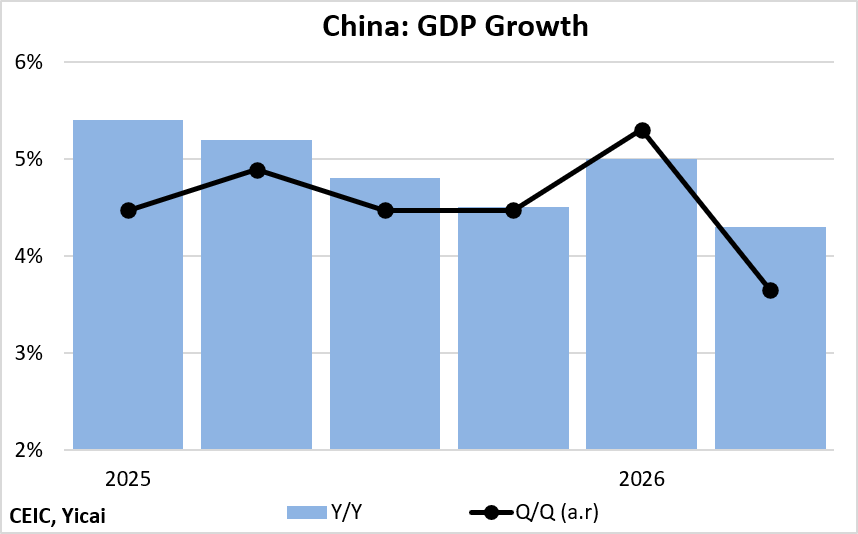
(Yicai) July 22 -- The data released by China’s National Bureau of Statistics (NBS) for the second quarter were disappointing. GDP grew by 4.3 percent year-over-year, slower than the 4.5 percent forecast by Yicai’s survey of Chief Economists and the slowest rate recorded since the fourth quarter of 2022. Quarter-over-quarter, growth was even slower: 3.7 percent at annual rates (Figure 1)
Figure 1
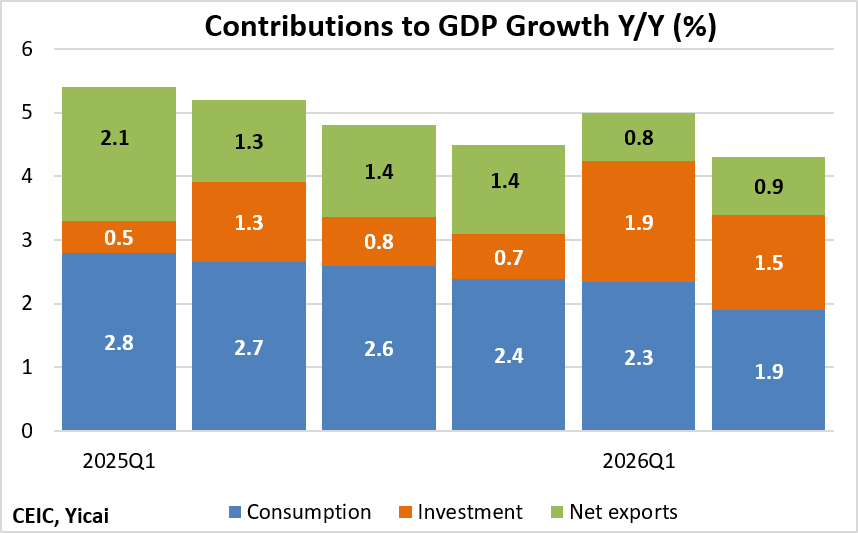
The source of the slowdown can be seen from the contributions of the demand components (Figure 2). Consumption only contributed 1.9 percentage points to second-quarter growth, down from 2.3 points in the first quarter and well below the 2.6 points contributed in 2025.
Investment’s contribution eased from 1.9 points in the first quarter to 1.5 points in Q2, though this measure of investment, drawn from the national accounts, tells a notably different story than the fixed-asset investment data discussed below.
Net exports added 0.9 percentage points, similar to Q1 but well below the 1.6 percentage points added in 2025.
Figure 2
At the risk of getting wonky, China has two investment measures.
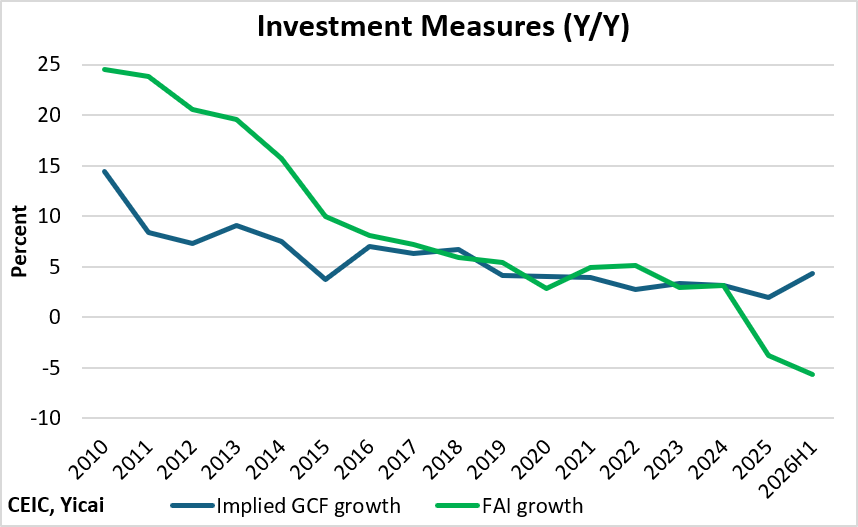
Fixed asset investment (FAI) is an administrative survey of reported project spending. It is measured in nominal terms. It captures land purchase costs and asset transfers that do not represent new value added and are not counted as part of GDP. FAI also excludes inventories.
The other measure, implied gross capital formation (GCF), by contrast, is derived from the national accounts, is calculated in real terms and includes inventory changes.
From 2010 to 2016, FAI grew much faster than GCF. The trends in the two series were fairly similar between 2016 and 2024. In 2025 and the first half of 2026, the two investment measures moved in opposite directions: FAI turned sharply negative as the real estate collapse deepened, while implied GCF growth actually accelerated (Figure 3). The most likely explanation is that FAI’s land-cost accounting overstates the true decline in construction-linked capital formation. In addition, inventory re-stocking, much of it from imports, seems to be boosting GCF growth.
Figure 3
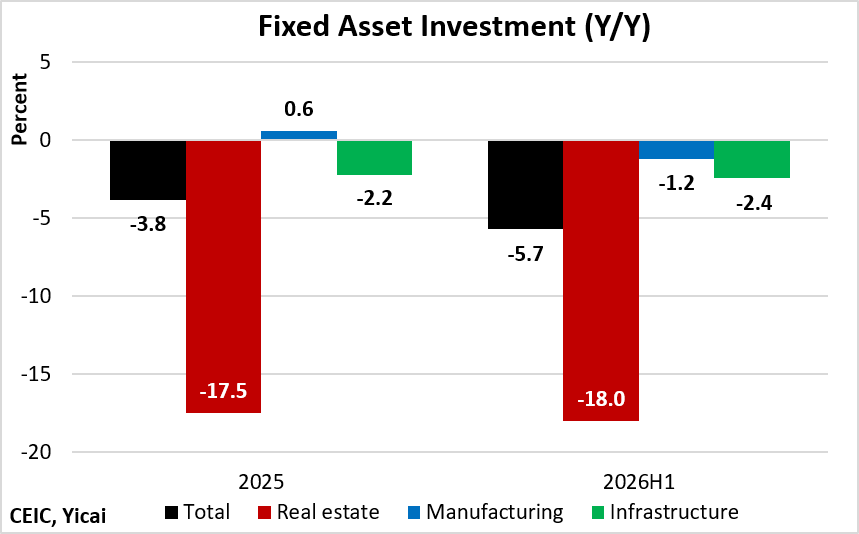
The fixed asset investment data show accelerating weakness, with the aggregate falling 6 percent year-to-date through June (Figure 4). This is almost 2 percentage points worse than 2025 as a whole and the deepest contraction on record outside the pandemic.
Real estate remains the largest drag. The decline in infrastructure investment, so far this year, is similar to that of 2025. However, the deterioration in investment has broadened to include manufacturing, which had been essentially flat in 2025 and has turned negative for the first time this cycle.
Figure 4
The investment decline is broad-based across sectors. Out of 14, only two – electrical machinery and equipment and computer and communications equipment – show faster investment growth from a year earlier (Table 1). The declines in several have been particularly sharp. For example, automobile manufacturing swung from 22 percent growth to a 4 percent decline, a deterioration of 26 percentage points (more on autos below). Investment in electricity, gas, and water fell by a similar magnitude.
The decline in fixed asset investment is the result of a confluence of factors. First, the spillover from real estate is evident in upstream industries — steel, cement, glass, and fabricated metals all show weak or negative investment growth.
A second factor is industrial policy. Since mid-2025, Beijing has run an explicit campaign against “involution-style” competition and has pushed firms toward capacity discipline rather than continued expansion. Manufacturing investment slowed significantly after this campaign began, especially in targeted sectors (steel, coal, cement, photovoltaics, batteries and EVs).
The third factor is fiscal policy. Local governments face tighter borrowing limits and reduced land-sale revenue. Much of the capital that once flowed through local governments and banks into infrastructure investment is increasingly used to pay down liabilities.
Finally, base effects matter. Several of the industries with the steepest declines — autos, food processing, utilities — were posting unusually strong growth a year earlier. So, part of 2026's deterioration reflects reversion from an elevated 2025 base rather than a fresh deterioration in underlying investment appetite.
Table 1
Fixed Asset Investment by Industry
Industry |
Jun 2025 YTD YoY (%) |
Jun 2026 YTD YoY (%) |
Change (ppt) |
| Electrical Machinery & Equipment | -7.8 | 1.2 | +9 |
| Computer, Communication & Other Electronic Equipment | 4.6 | 6.5 | +2 |
| Rail, Ship, Aircraft, Spacecraft & Other Transport Equipment | 27.3 | 24.7 | -3 |
| Textile | 14.5 | 9.4 | -5 |
| Chemical Material & Product | -1.1 | -6.5 | -5 |
| Medical & Pharmaceutical Product | -3.0 | -9.2 | -6 |
| Non-Ferrous Metal Smelting & Pressing | 9.1 | -4.1 | -13 |
| General Equipment | 16.6 | 1.9 | -15 |
| Special Equipment | 6.2 | -8.6 | -15 |
| Fabricated Metal Product | 11.1 | -5.5 | -17 |
| Agricultural & Sideline Food Processing | 18.4 | -1.9 | -20 |
| Food Manufacturing | 16.0 | -8.1 | -24 |
| Electricity, Gas & Water Production and Supply | 22.8 | -2.7 | -26 |
| Automobile Manufacturing | 22.2 | -4.2 | -26 |
The decline in FAI appears to be weighing on the household sector.
FAI includes land purchase costs, which are largely a transfer to local governments. Falling land sales strain local government budgets, delaying pay to public workers and contractors. When foreign-purchased commodities are being stockpiled, it is counted as inventory investment and boosts GCF but it does little to generate employment. Thus, FAI may be the more relevant gauge of the slowdown's impact on household income and consumption, even if GCF is the more theoretically correct measure of aggregate capital formation.
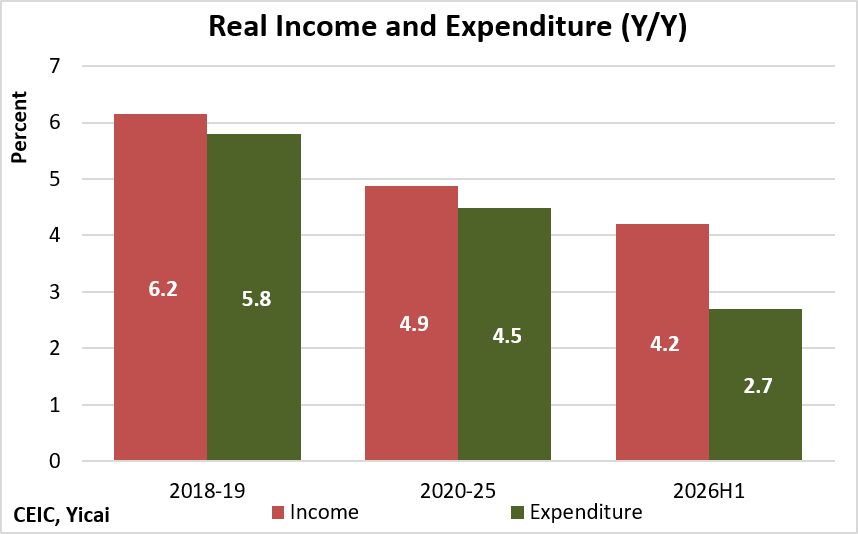
Consumption’s softness comes from two channels. Household income growth has slowed so far this year (Figure 5). Indeed, real household income grew 0.5 percentage points more slowly than GDP. This alone would weigh on consumption. However, the decline in household spending growth has been even more dramatic than that of income.
Figure 5
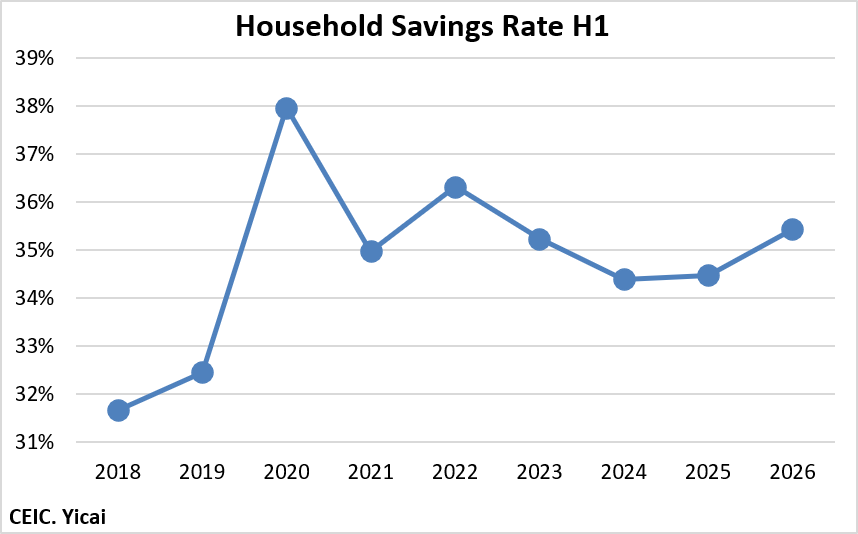
Another way of describing this is an increase in the household savings rate (Figure 6). In the first half of the year, the savings rate rose to 35.4 percent, almost a percentage point higher than the same period in 2025. A rising savings rate alongside weaker incomes is a discouraging combination for consumption-led growth and helps explain why retail sales have struggled to accelerate despite continued policy support.
Figure 6
Much of the weakness in overall retail sales is related to autos.
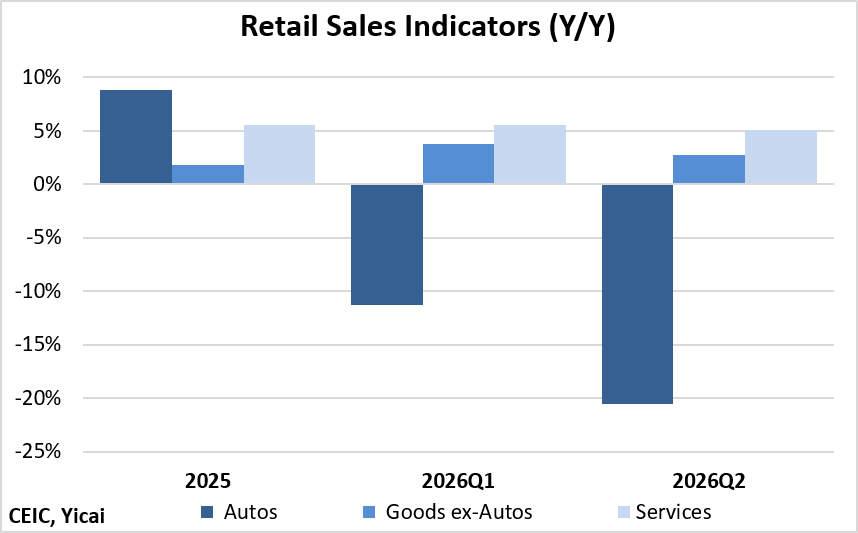
In 2025, auto sales grew by 9 percent. This year, the tax rebate on new EV purchases was halved and the incentive to trade in old vehicles evolved from a fixed amount to a percentage, which sharply reduced the amount available for low-price cars. Thus, sales in Q1 declined by 11 percent while those in Q2 registered a 21 percent decline (Figure 7).
Sales of goods excluding autos have held up well this year, growing at 4 percent and 3 percent in Q1 and Q2, somewhat faster than the 2 percent growth posted in 2025. Retail sales of services remain strong, growing at 6 percent and 5 percent in Q1 and Q2, compared to 6 percent growth in 2025.
In sum, the retail sales slowdown looks concentrated rather than universal, with autos accounting for most of the drag.
Figure 7
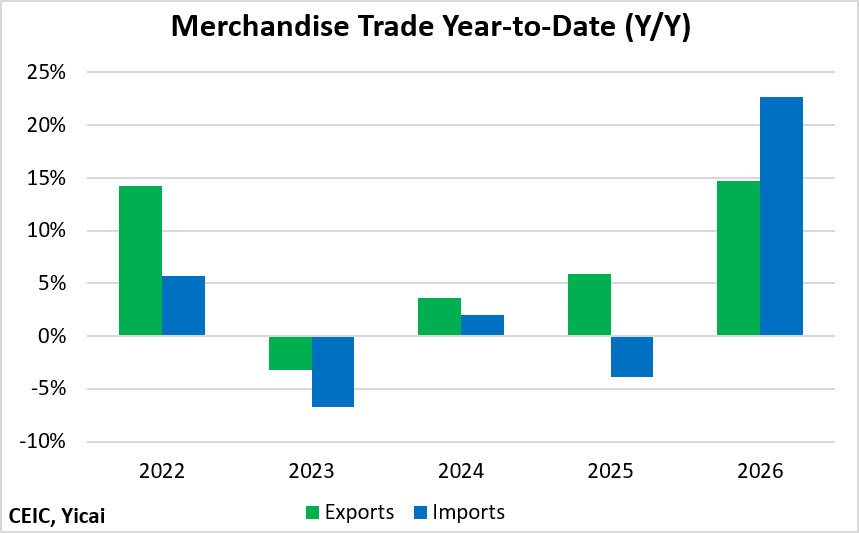
Net exports continue to play an important role in supporting overall GDP growth. Their contribution has fallen from 1.6 percentage points in 2025 to 0.9 percentage points in the first half of this year due to the surge in imports. Imports grew by 23 percent year-over-year in the first half. This was significantly faster than the 15 percent rebound growth in exports (Figure 8).
Figure 8
Almost half of the increase in Q2 imports came from just two categories: integrated circuits and computers and computer parts, underscoring the importance of China’s tech boom. Higher commodity prices were behind some of the increase in copper ore, crude oil and fertilizer.
Table 2
Import Growth 2025Q2-2026Q2
Item | 2026 Q2 ( $bn) | Change ($bn) | % |
| Electronic integrated circuits | 170.0 | +66.9 | +65% |
| Automatic data processing machines & parts | 52.6 | +27.1 | +106% |
| Unwrought copper & copper products | 18.7 | +5.6 | +43% |
| Copper ore & concentrate | 26.0 | +5.5 | +27% |
| Crude petroleum oil | 77.7 | +5.1 | +7% |
| Iron ore & concentrate | 32.1 | +2.7 | +9% |
| Soybeans | 15.8 | +1.7 | +12% |
| Coal & lignite | 9.3 | +1.5 | +19% |
| Meat | 6.5 | +0.9 | +16% |
| Aircraft | 3.2 | +0.8 | +33% |
| Fresh or dried fruit & nuts | 6.0 | +0.7 | +13% |
| Fertilizer | 1.7 | +0.7 | +70% |
| Natural gas | 14.0 | +0.8 | +6% |
| Subtotal | 433.6 | +120.0 | +38% |
| Other imports | 399.1 | +69.8 | +21% |
| Total imports | 832.7 | +189.8 | +30% |
The foreign tech boom played a significant role in the growth of China’s exports as the same top two categories accounted for 43 percent of the year-over-year increase. Exports of motor vehicles grew rapidly in the quarter, accounting for 9 percent of the period’s increase. The was also a rebound in mobile phone sales.
Table 3
Export Growth 2025Q2-2026Q2
Item | 2026 Q2 ($bn) | Change ($bn) | % Change | |
| Electronic Integrated Circuits | 104.8 | +55.1 | +111% | |
| Automatic Data Processing Machines & parts | 77.8 | +27.7 | +55% | |
| Motor vehicles | 51.0 | +17.1 | +50% | |
| Mobile phones | 27.8 | +6.0 | +28% | |
| Plastic articles | 31.4 | +3.6 | +13% | |
| Household appliances | 27.5 | +2.6 | +10% | |
| Unwrought aluminium & products | 7.9 | +2.5 | +46% | |
| Vehicle parts & accessories | 27.1 | +2.5 | +10% | |
| Ships | 16.7 | +2.3 | +16% | |
| Subtotal | 372.0 | +119.4 | +47% | |
| Other exports | 776.6 | +72.2 | +10% | |
| Total exports | 1,148.6 | +191.6 | +20% | |
Looking around the world, the growth in China’s exports was well distributed. Sales to ASEAN were a bit stronger and those to the EU were a bit weaker than the overall average.
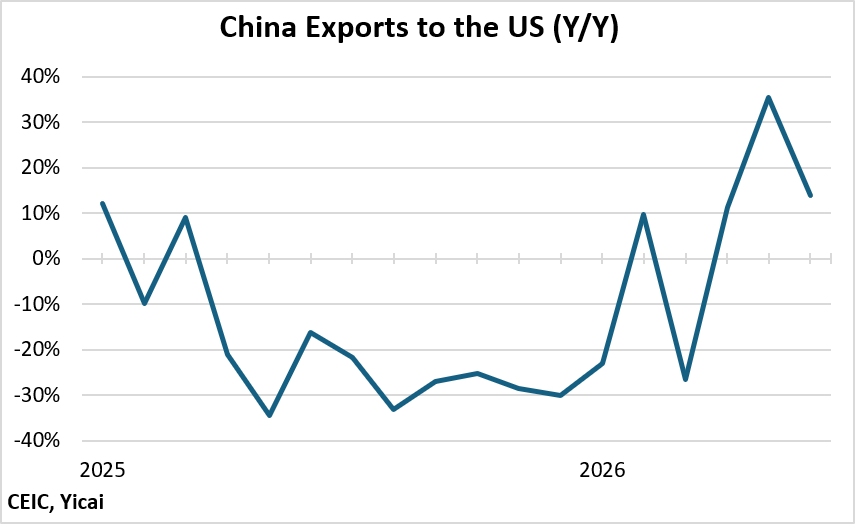
The most notable development has been a rebound in sales to the US (Figure 9). Growth in Q2 was 19 percent, a remarkable turnaround from the 18 percent decline a year ago. Some of this is due to the termination of the International Emergency Economic Powers Act (Liberation Day) tariffs in February. The tariffs imposed on China had been particularly high. They were replaced by the Section 122 tariffs, which were lower overall and discriminated less against China. The revised tariffs made China’s exports relatively less expensive in the US market.
Figure 9
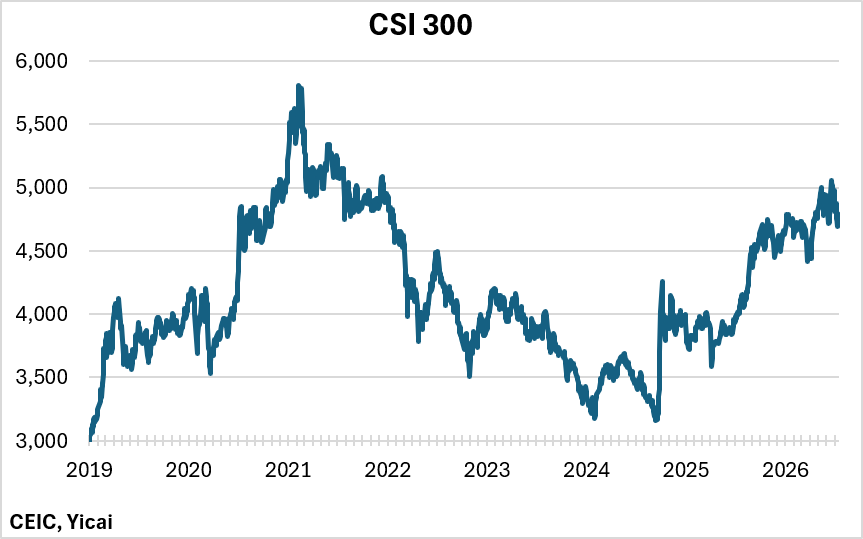
While consumer confidence, as evidenced by the increase in precautionary savings, has deteriorated, expectations for the business sector have improved. The CSI 300 stock index was up 25 percent year-over-year in the second quarter (Figure 10). Some of this was due to the 6 percent increase in earnings but most was the market trading listed companies at a more elevated price-earnings ratio – a vote of confidence in their future prospects.
Figure 10
Indeed, the profits of large industrial companies were up 19 percent year-over-year in the January-to-May period. This represents an acceleration from the 18 percent in the year-to-April. Profits continue to grow faster than revenues, pointing to better margins, possibly linked to the rebound in producer prices. The government’s campaign against involution-style price competition, which appears to be giving firms more pricing power, is likely also playing a role.
There are reasons for cautious optimism looking ahead.
NBS officials have pointed to the sequential improvement in monthly indicators within the second quarter: industrial production, services, and trade data all improved from April through June. This could be evidence that the quarter’s weakness reflects temporary factors, including the Iran-related energy shock, rather than a durable loss of momentum.
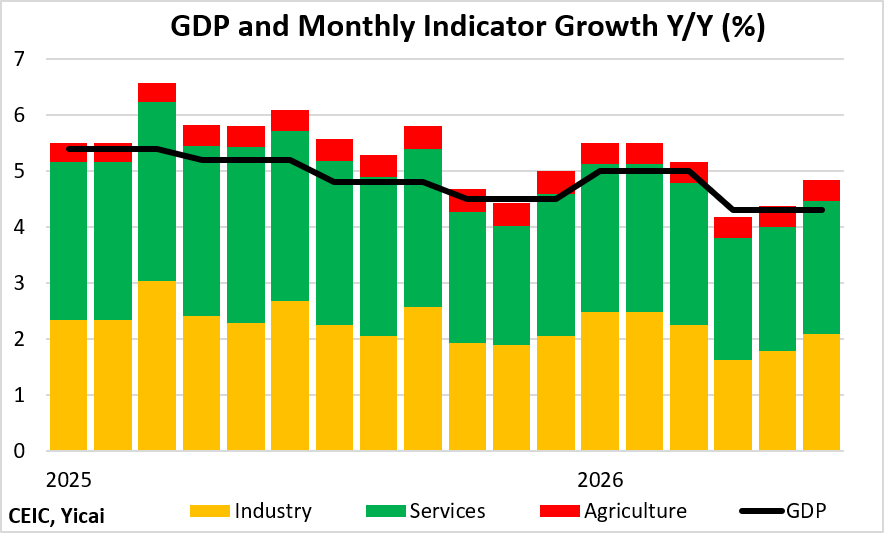
Our monthly GDP indicator lends some support to this reading. The indicator is a weighted average of industrial value added, service production and agricultural output. It shows that the GDP proxy fell sharply in April and recovered thereafter (Figure 11).
Figure 11
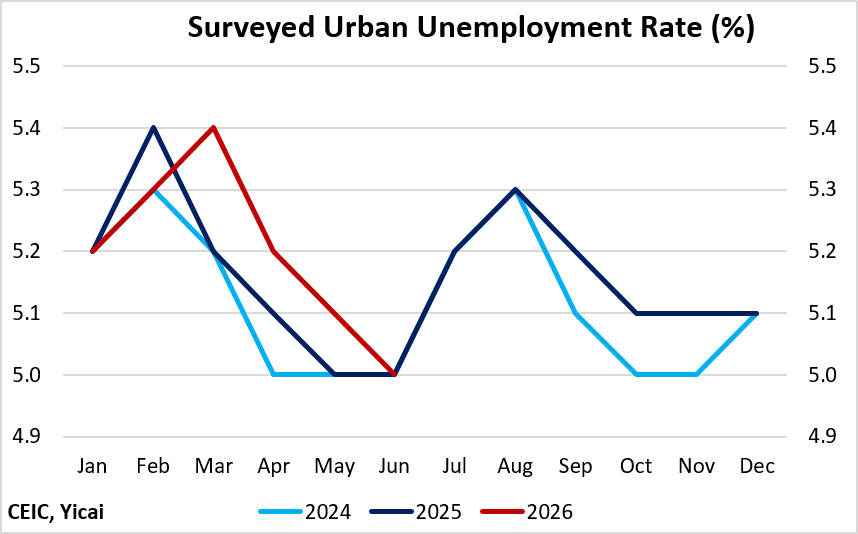
Similarly, the unemployment rate this year tracked higher than the two previous years in March-May but fell to their level in June, suggesting an intra-quarter improvement in labour market conditions (Figure 12).
Figure 12
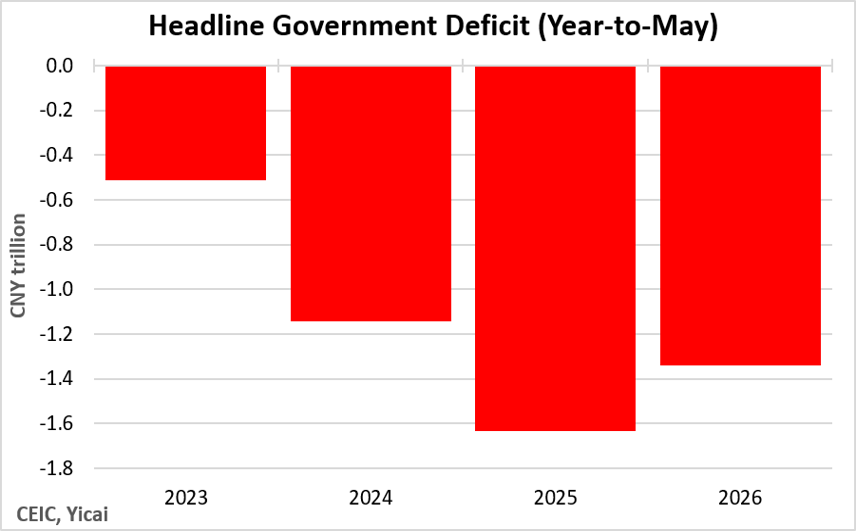
Fiscal policy may provide a more concrete source of support in the second half. In the first five months of the year, government expenditure only grew by 1 percent year-over-year, much more slowly than revenue’s 4 percent increase. As a result, the cumulative government deficit through May was running somewhat below its 2025 pace (Figure 13). The difference between the two represents a drag of ½ percent of GDP.
This year’s budget deficit target was 4 percent of GDP, the same as last year’s. Since the government typically meets this target, we would expect fiscal policy to be a tailwind in the second half.
Figure 13
Stepping back, the weakness in this quarter's data is narrower than the headline number suggests. Outside of autos and real estate, most of the economy is holding up reasonably well. Exports remained resilient and industrial profits accelerated. And China's "new growth drivers” continued to expand even as traditional heavy industry contracted. The slowdown is real, but it is concentrated in two large, closely watched sectors rather than spread evenly across the economy.
Beijing's policy choices this year have consistently favoured stability over growth. The anti-involution campaign trades near-term output for capacity discipline. Local governments, meanwhile, have prioritized cleaning up their balance sheets over funding new activity. The government has similarly resisted large-scale stimulus for real estate, allowing the sector to continue deleveraging rather than reinflating it.
Each of these policy choices accepts slower growth in exchange for reduced financial risk, consistent with a full-year growth target set as a wide 4.5-to-5-percent range rather than a single number. Seen this way, the second quarter's miss looks more like a policy choice than a policy failure.
 Mark KrugerBased in Shanghai, Mark Kruger holds Senior Fellow appointments at the Yicai Research Institute, the Centre for International Governance Innovation and University of Alberta’s China Institute. Between 2020 and 2023, Mark was the Opinion Editor at Yicai Global. Previously, he had a 30-year career with the Bank of Canada in the course of which he served as a Senior Advisor to the Canadian Executive Director at the IMF and the head of the Economic and Financial Section of the Canadian Embassy in Beijing.